. 2014 Jul 11;289(28):19539-54.
doi: 10.1074/jbc.M114.578104. Epub 2014 Jun 2.

Genomic determinants of gene regulation by 1,25-dihydroxyvitamin D3 during osteoblast-lineage cell differentiation

Affiliations

Genomic determinants of gene regulation by 1,25-dihydroxyvitamin D3 during osteoblast-lineage cell differentiation

Mark B Meyer et al. J Biol Chem. .

Abstract

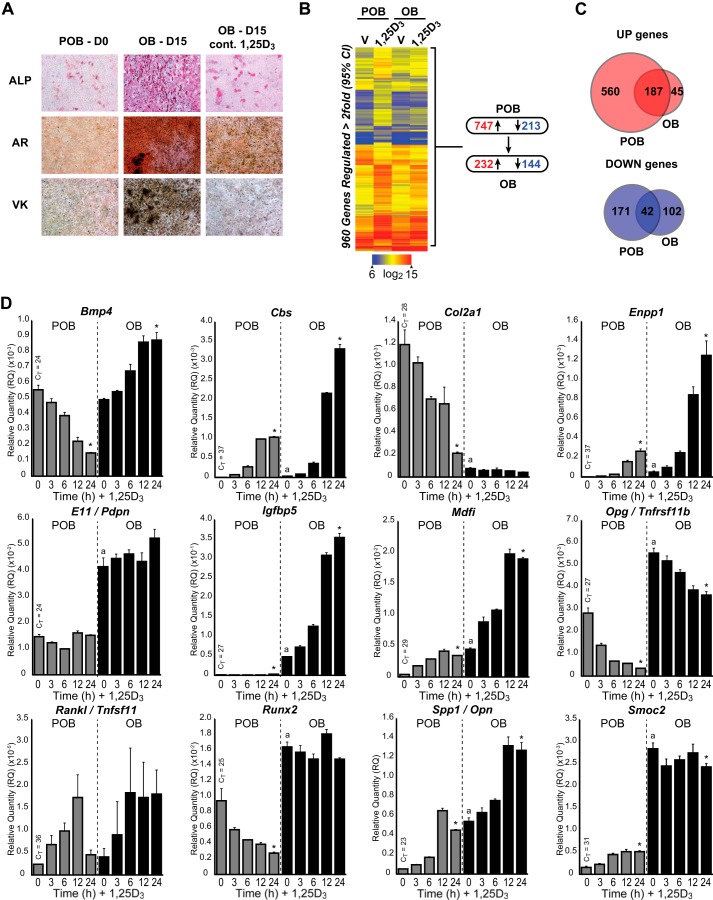
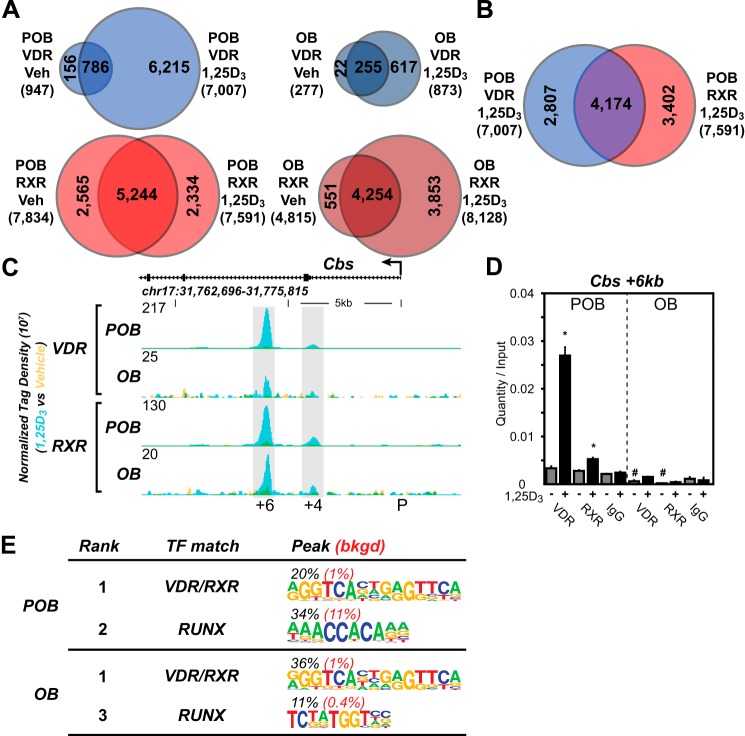
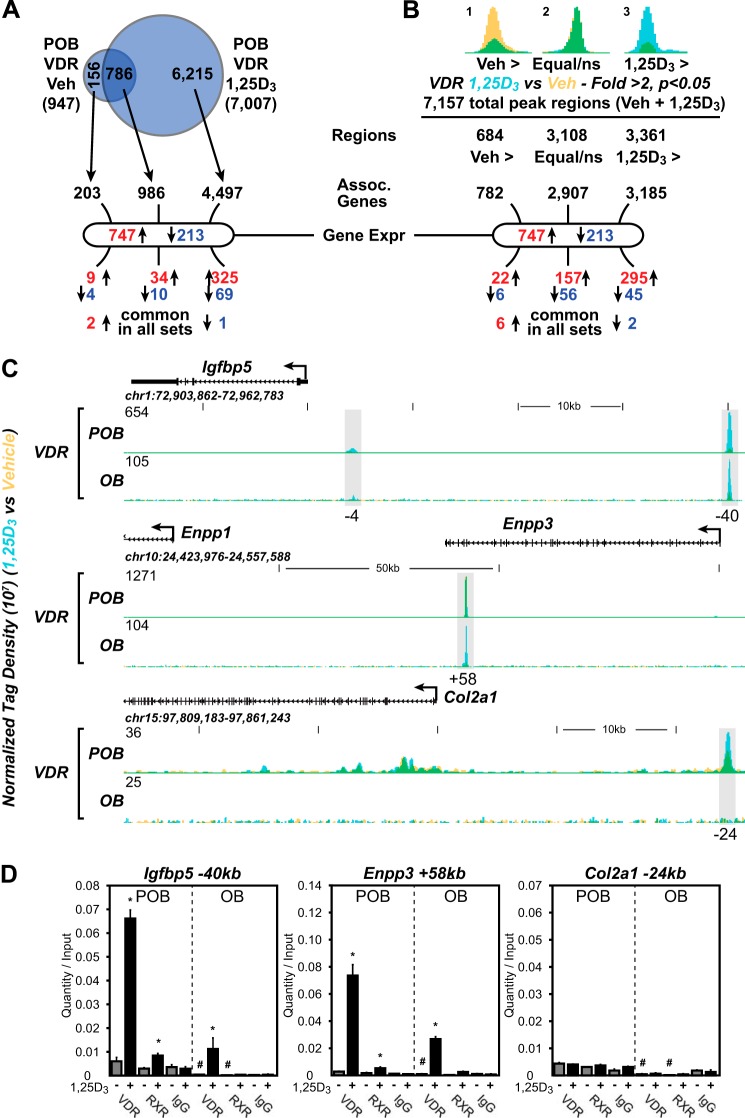
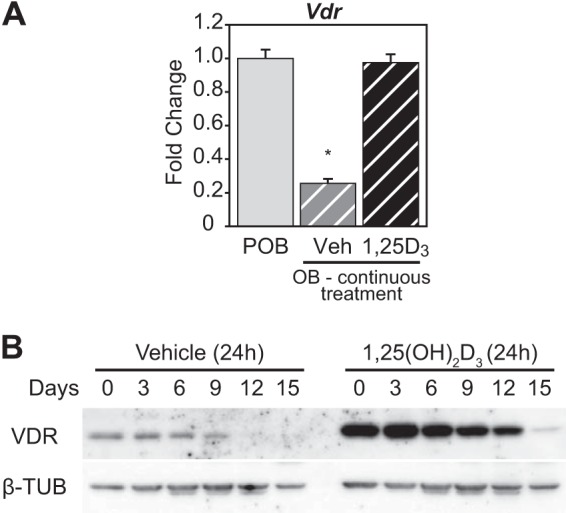
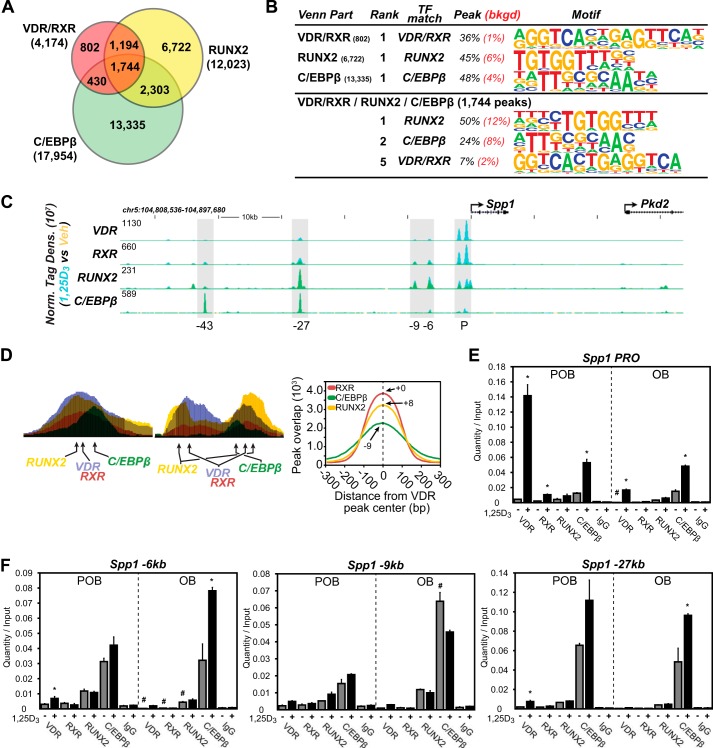
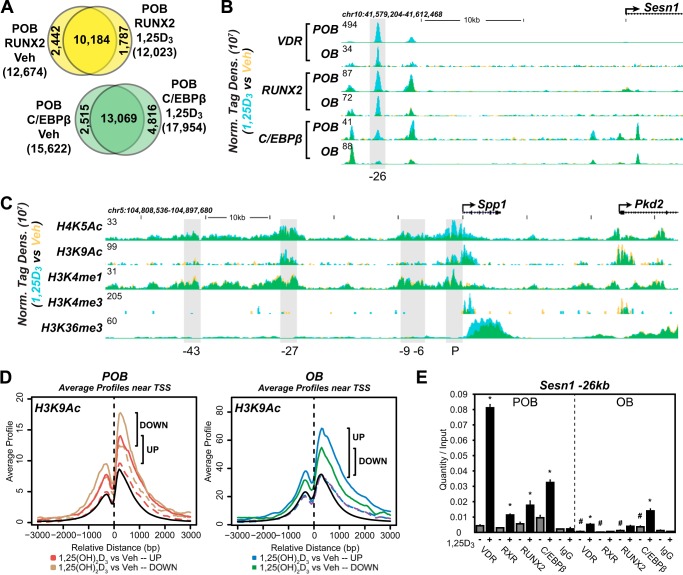
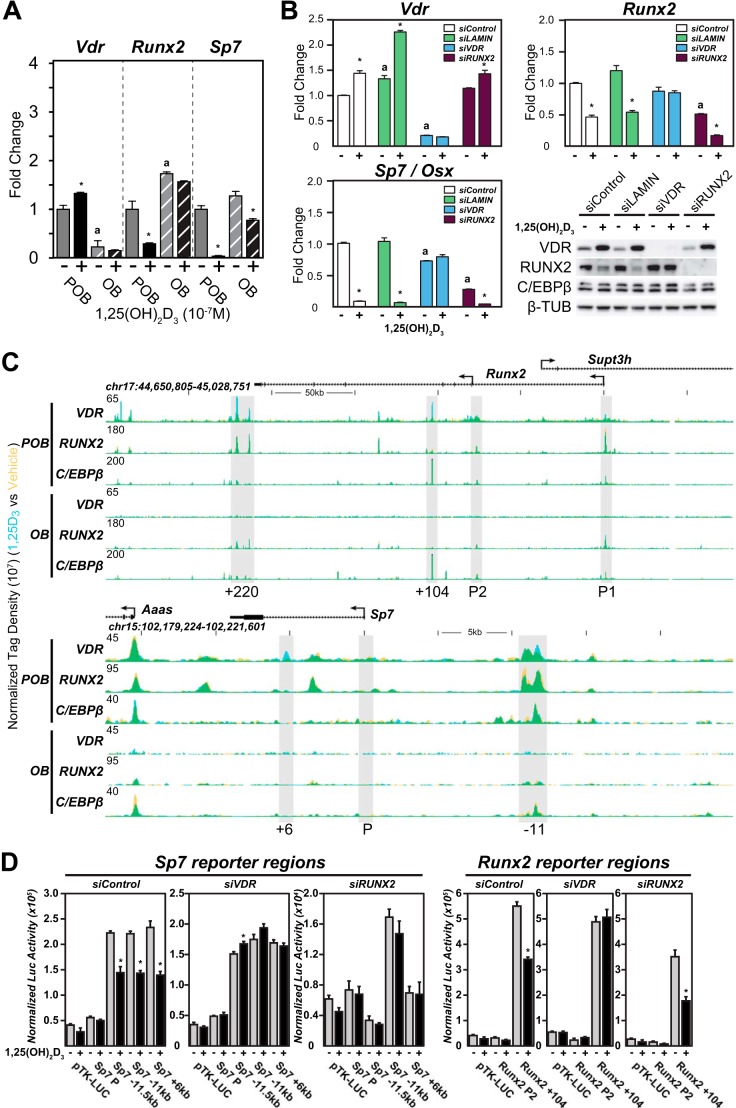
The biological effects of 1α,25-dihydroxyvitamin D3 (1,25 (OH)2D3) on osteoblast differentiation and function differ significantly depending upon the cellular state of maturation. To explore this phenomenon mechanistically, we examined the impact of 1,25(OH)2D3 on the transcriptomes of both pre-osteoblastic (POBs) and differentiated osteoblastic (OBs) MC3T3-E1 cells, and assessed localization of the vitamin D receptor (VDR) at sites of action on a genome-scale using ChIP sequence analysis. We observed that the 1,25(OH)2D3-induced transcriptomes of POBs and OBs were quantitatively and qualitatively different, supporting not only the altered biology observed but the potential for a change in VDR interaction at the genome as well. This idea was confirmed through discovery that VDR cistromes in POBs and OBs were also strikingly different. Depletion of VDR-binding sites in OBs, due in part to reduced VDR expression, was the likely cause of the loss of VDR-target gene interaction. Continued novel regulation by 1,25(OH)2D3, however, suggested that factors in addition to the VDR might also be involved. Accordingly, we show that transcriptomic modifications are also accompanied by changes in genome binding of the master osteoblast regulator RUNX2 and the chromatin remodeler CCAAT/enhancer-binding protein β. Importantly, genome occupancy was also highlighted by the presence of epigenetic enhancer signatures that were selectively changed in response to both differentiation and 1,25(OH)2D3. The impact of VDR, RUNX2, and C/EBPβ on osteoblast differentiation is exemplified by their actions at the Runx2 and Sp7 gene loci. We conclude that each of these mechanisms may contribute to the diverse actions of 1,25(OH)2D3 on differentiating osteoblasts.

Keywords: CCAAT/Enhancer-binding Protein (C/EBP); ChIP-sequencing (ChIP-seq); Chromatin Modification; Osteoblast; Transcription Enhancer; Vitamin D.


Figures

FIGURE 1.
FIGURE 1.
Effects of 1,25(OH)2D3 on gene expression during MC3T3-E1 osteoblast differentiation. A, POB cells differentiated for 15 days to OB cells were treated with 10−7 m 1,25(OH)2D3 (1,25D3) or vehicle every 3 days during culture. Plates were stained with alkaline phosphatase (ALP), von Kossa (VK), and Alizarin Red (AR). B, gene expression heatmap of vehicle (V) or 1,25(OH)2D3 (1,25D3)-treated POB and OB cells. Blue, low expression; red, high expression. Genes shown in each row refer to POB differentially regulated genes. Summary of gene changes is shown to the right, with down-regulated <2-fold shown in blue and up-regulated >2-fold shown in red. C, Venn diagram representation of up-regulated (top, red) and down-regulated (bottom, blue) genes that overlap in POB and OB cells. D, gene expression time course (0, 3, 6, 12, and 24 h) of 10−7 m 1,25(OH)2D3 treatment in POB and OB cells by TaqMan RT-qPCR. Data are displayed as relative quantitation (RQ) compared with β-actin ± S.E. *, p < 0.05, 24 h versus 0 h within cell type by one-way analysis of variance. a, p < 0.05, POB 0 h versus OB 0 h by two-way analysis of variance with Dunnett's post test.
FIGURE 2.
FIGURE 2.
Delineation of the VDR cistromes in POBs and OBs. A, Venn diagram depiction of replicate normalized VDR- (blue) and RXR (red)-binding sites in vehicle (Veh) and 1,25(OH)2D3 (1,25D3)-treated undifferentiated (POB) cells (left) and differentiated (OB) cells (right). B, overlapping Venn diagrams for VDR and RXR in the POB-treated cells from the 1,25(OH)2D3 condition. C, ChIP-seq tag density tracks for the Cbs gene locus for VDR and RXR binding (Veh, yellow; 1,25(OH)2D3, blue; overlap, green) in the POB and OB cells. Genomic location and scale are indicated, and maximum height of tag sequence density for the data track is indicated on the y axis (normalized to input and 107 tags). Gene transcriptional direction is indicated by an arrow and exons by boxes. Peak regions of interest are highlighted by gray boxes, and their distance from TSS (P, promoter) is indicated below. D, ChIP-qPCR analysis of Cbs +6-kb peak region. Data displayed as quantitation normalized to ChIP input ± S.E. *, p < 0.05, 10−7 m 1,25(OH)2D3 (+) versus vehicle (−) within ChIP antibody by Student's t test. #, p < 0.05, POB versus OB by Student's t test. E, de novo over-representation analysis of VDR 1,25(OH)2D3 peak sequences and matching transcription factor-binding sites found through HOMER. Abundance shown as percentage (black) compared with 50,000 GC content matched sequences (red).
FIGURE 3.
FIGURE 3.
Specific VDR binding to the genome correlates with the 1,25(OH)2D3-regulated expression of genes. A, Venn diagram depiction of replicate normalized VDR-binding sites assessed using HOMER in undifferentiated (POB) cells treated with vehicle (Veh) or 1,25(OH)2D3 (1,25D3). Arrows link the VDR-binding site subsets (Veh-specific, 1,25(OH)2D3 (1,25D3)-specific, and Veh/1,25(OH)2D3 overlap) to annotated neighboring genes using GREAT. B, statistical enrichment of VDR ChIP-seq tag density. Peaks were divided into Veh > 2-fold (Veh >, yellow), equivalent (not statistically different, Equal/ns), and 1,25(OH)2D3 > 2-fold (1,25D3 >, blue) and then correlated to genes using GREAT nearest neighbor analysis. Overlapping regions appear as green. Below A and B, genes found to be differentially regulated by 1,25(OH)2D3 for POB cells (747, up-regulated; 213, down-regulated) are shown. The GREAT-associated genes are cross-referenced to these gene sets and listed below. Up-regulated genes, red; down-regulated genes, blue. C, ChIP-seq tag density tracks for the Igfbp5, Enpp1/3, and Col2a1 gene loci for VDR binding (Veh, yellow; 1,25(OH)2D3, blue; overlap, green) in POB and OB cells. Additional details are the same as in Fig. 2. D, ChIP-qPCR analysis of Igfbp5 −40-kb, Enpp3 +58-kb, and Col2a1 −24-kb peak regions. Data displayed as quantitation normalized to ChIP input ± S.E. *, p < 0.05, 10−7 m 1,25(OH)2D3 (+) versus vehicle (−) within ChIP antibody by Student's t test. , p < 0.05, POB versus OB by Student's t test.
FIGURE 4.
FIGURE 4.
VDR expression is suppressed in OBs. A, POB cells differentiated for 15 days to OB cells were treated with 10−7 m 1,25(OH)2D3 (1,25D3) or Veh every 3 days continuously during culture. RT-qPCR was performed on RNA isolated from the POB and OB cells for Vdr levels. Values are relative quantitation (RQ) normalized to β-actin levels with fold change set to 1 for the POB sample (POB, gray; OB Veh, gray striped; OB 1,25(OH)2D3, black striped). Samples completed in biological triplicate ± S.E. *, p < 0.05 compared with POB sample. B, Western blot of VDR and β-tubulin (β-TUB) proteins from whole cell lysates collected every 3 days during differentiation from POB to OB (15 days). The cells were treated with vehicle or 10−7 m 1,25(OH)2D3 for 24 h prior to isolation.
FIGURE 5.
FIGURE 5.
VDR-binding sites contain RUNX2 and/or C/EBPβ cofactors. A, Venn diagram depiction of replicate-normalized VDR/RXR-, RUNX2-, and C/EBPβ-binding sites in POB cells. B, de novo over-representation analysis of VDR/RXR, RUNX2, and C/EBPβ peak sequences and matching transcription factor-binding sites found through HOMER. Abundance shown as percentage (black) compared with 50,000 GC content-matched sequences (red). C, ChIP-seq tag density tracks for the Spp1 gene locus for VDR, RXR, RUNX2, and C/EBPβ binding (Veh, yellow; 1,25(OH)2D3, blue; overlap, green). Additional details are the same as in Fig. 2. D, schematic depiction of VDR-, RUNX2-, and C/EBPβ-binding elements in relationship to peak maxima as found in ChIP-seq data sets, left. Right, ChIP-seq peaks for RXR, RUNX2, and C/EBPβ were plotted with their relationship to VDR-binding peak centers. Peak maxima for each factor indicated by number upstream (−) or downstream (+) from VDR peak center. E and F, ChIP-qPCR analysis of Spp1 peak regions. Data displayed as quantitation normalized to ChIP input ± S.E. *, p < 0.05, 10−7 m 1,25(OH)2D3 (+) versus vehicle (−) within ChIP antibody by Student's t test. #, p < 0.05, POB versus OB by Student's t test.
FIGURE 6.
FIGURE 6.
RUNX2 and C/EBPβ binding are influenced by 1,25(OH)2D3 as are histone modification markers. A, Venn diagram depiction of replicate normalized RUNX2- and C/EBPβ-binding sites assessed using HOMER in undifferentiated (POB) cells treated with Veh or 1,25(OH)2D3 (1,25D3). B, ChIP-seq tag density tracks for the Sesn1 gene locus for VDR, RUNX2, and C/EBPβ in the POB and OB cells (Veh, yellow; 1,25D3, blue; overlap, green). Additional details are the same as in Fig. 2. C, ChIP-seq tag density tracks for the Spp1 gene locus for H4K5Ac, H3K9Ac, H3K4me1, H3K4me3, and H3K36me3 binding (Veh, yellow; 1,25(OH)2D3, blue; overlap, green). Further details as in B. D, ChIP-seq tag density compared near the TSS (±3 kb) of genes up-regulated (red and blue) versus down-regulated (yellow and green) in POB (left) or OB (right) cells by cis-regulatory element annotation system. Solid lines represent the H3K9Ac tag density in the 1,25(OH)2D3 condition, and dashed lines represent the vehicle condition. All TSS of genes in genome are indicated by a black solid line. Specific changes in density are highlighted by vertical black bars. E, ChIP-qPCR analysis of Sesn1 −26-kb peak region. Data displayed as quantitation normalized to ChIP input ± S.E. *, p < 0.05, 10−7 m 1,25(OH)2D3 (+) versus vehicle (−) within ChIP antibody by Student's t test. #, p < 0.05, POB versus OB by Student's t test.
FIGURE 7.
FIGURE 7.
1,25(OH)2D3 blocks POB differentiation and mineralization via direct actions to suppress both Runx2 and Sp7 gene expression. A, RT-qPCR was performed on RNA isolated from the POB and OB cells treated with 24 h of vehicle (−) or 10−7 m 1,25(OH)2D3 (+) for Vdr, Runx2, and Sp7 genes. Values are relative quantitation normalized to β-actin levels with fold change set to 1 for the POB vehicle sample (POB, solid; OB, striped). Samples completed in biological triplicate ± S.E. *, p < 0.05 compared with vehicle (−) sample; a, p < 0.05, vehicle OB compared with vehicle POB. B, POB cells were transfected with siRNA for siControl (white), siLAMIN (green), siVDR (blue), and siRUNX2 (purple). RT-qPCR was performed on RNA isolated from the siRNA cells treated for 24 h with vehicle (−) or 10−7 m 1,25(OH)2D3 (+) for Vdr, Runx2, and Sp7 genes. Values are relative quantitation normalized to β-actin levels with fold change set to 1 for the siControl vehicle sample. Samples completed in biological triplicate ± S.E. *, p < 0.05 compared with vehicle (−) sample; a, p < 0.05 vehicle compared with vehicle siControl. Western blot was performed on whole cell lysates from cells treated with siRNA as indicated and vehicle (−) or 10−7 m 1,25(OH)2D3 (+) for 24 h. C, ChIP-seq tag density tracks for the Runx2 and Sp7 gene loci for VDR, RUNX2, and C/EBPβ binding (Veh, yellow; 1,25(OH)2D3, blue; overlap, green) in the POB and OB cells. Additional details are the same as in Fig. 2. D, cloned pTK-luciferase enhancer reporter constructs transfected into POB cells were treated with siControl (left), siVDR (middle), and siRUNX2 (right) for VDR binding regions in Sp7 and Runx2 genes. Post-transfection, samples were treated with vehicle (−) or 10−7 m 1,25(OH)2D3 (+) for 12–16 h. Results displayed as relative light units normalized with β-galactosidase co-transfection levels. Triplicate set of assays ± S.E. *, p < 0.05, 1,25(OH)2D3 compared with vehicle within each construct.

Similar articles

Cited by

References

    1. Lieben L., Carmeliet G., Masuyama R. (2011) Calcemic actions of vitamin D: effects on the intestine, kidney and bone. Best Pract. Res. Clin. Endocrinol. Metab. 25, 561–572 - PubMed
    1. Bikle D. D. (2012) Vitamin D and bone. Curr. Osteoporos Rep. 10, 151–159 - PMC - PubMed
    1. Eisman J. A., Bouillon R. (2014) Vitamin D: direct effects of vitamin D metabolites on bone: lessons from genetically modified mice. Bonekey Rep. 3, 499. - PMC - PubMed
    1. Plum L. A., DeLuca H. F. (2010) Vitamin D, disease and therapeutic opportunities. Nat. Rev. Drug Discov. 9, 941–955 - PubMed
    1. Lacey D. L., Timms E., Tan H. L., Kelley M. J., Dunstan C. R., Burgess T., Elliott R., Colombero A., Elliott G., Scully S., Hsu H., Sullivan J., Hawkins N., Davy E., Capparelli C., Eli A., Qian Y. X., Kaufman S., Sarosi I., Shalhoub V., Senaldi G., Guo J., Delaney J., Boyle W. J. (1998) Osteoprotegerin ligand is a cytokine that regulates osteoclast differentiation and activation. Cell 93, 165–176 - PubMed

Publication types

MeSH terms