. 2014 Jun 9;205(5):677-92.
doi: 10.1083/jcb.201401138. Epub 2014 Jun 2.

Identification of unique SUN-interacting nuclear envelope proteins with diverse functions in plants

Affiliations

Identification of unique SUN-interacting nuclear envelope proteins with diverse functions in plants

Xiao Zhou et al. J Cell Biol. .

Abstract

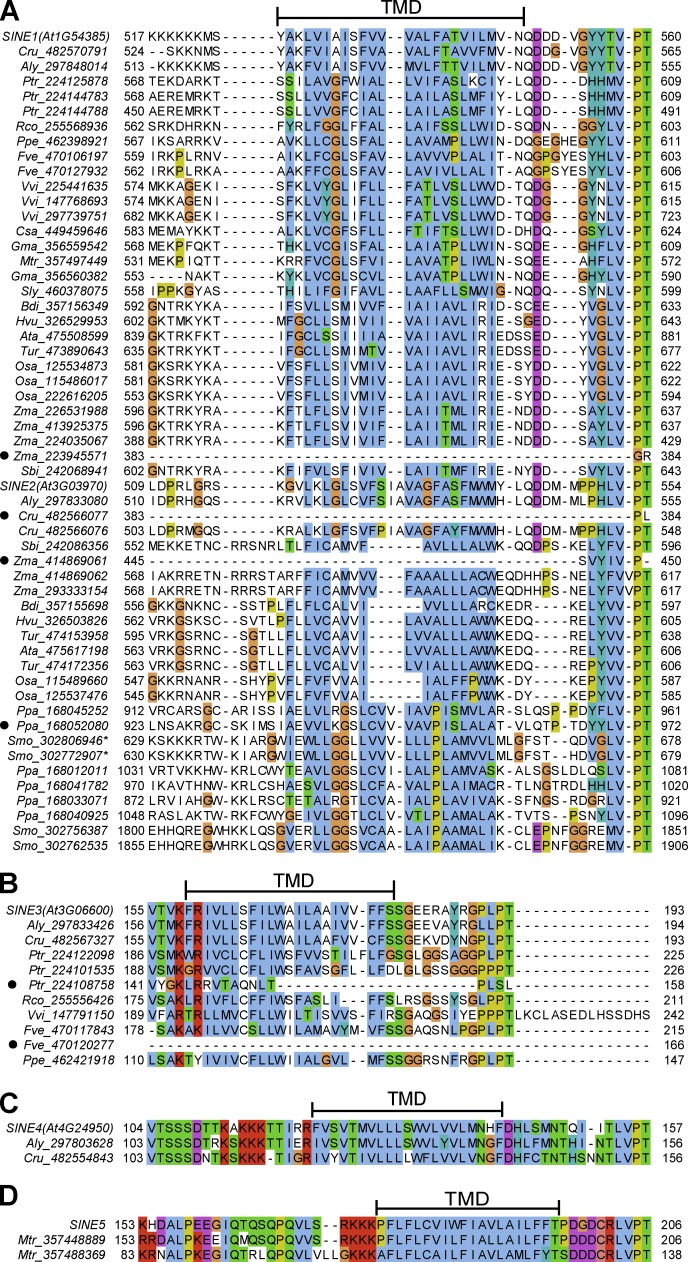
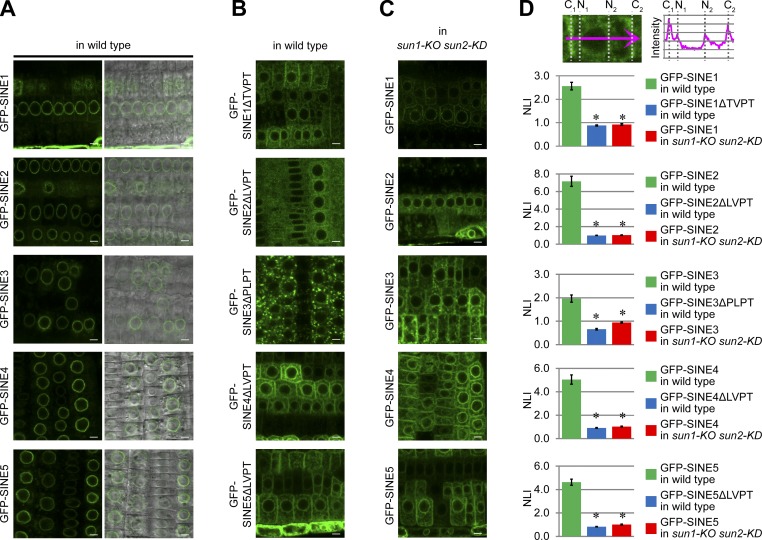
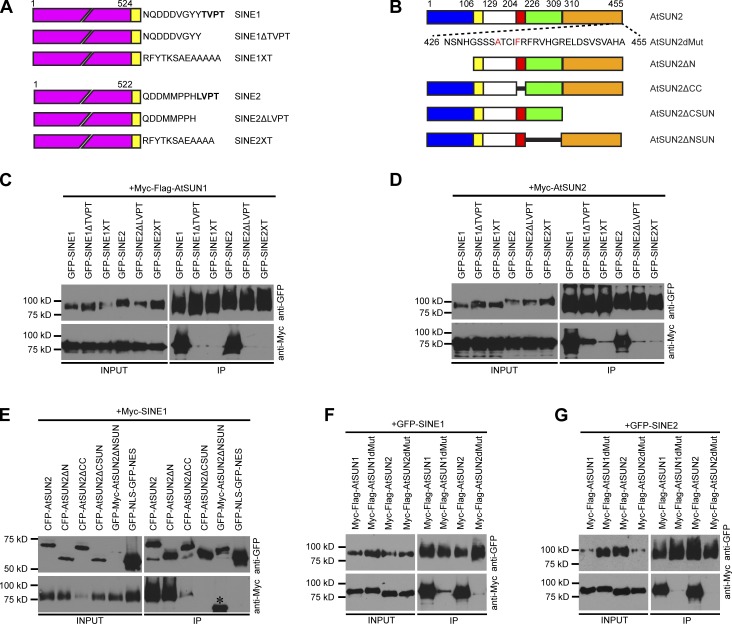
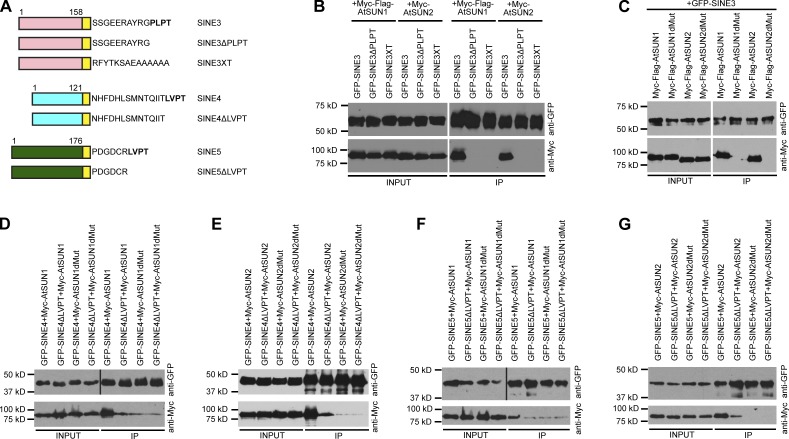
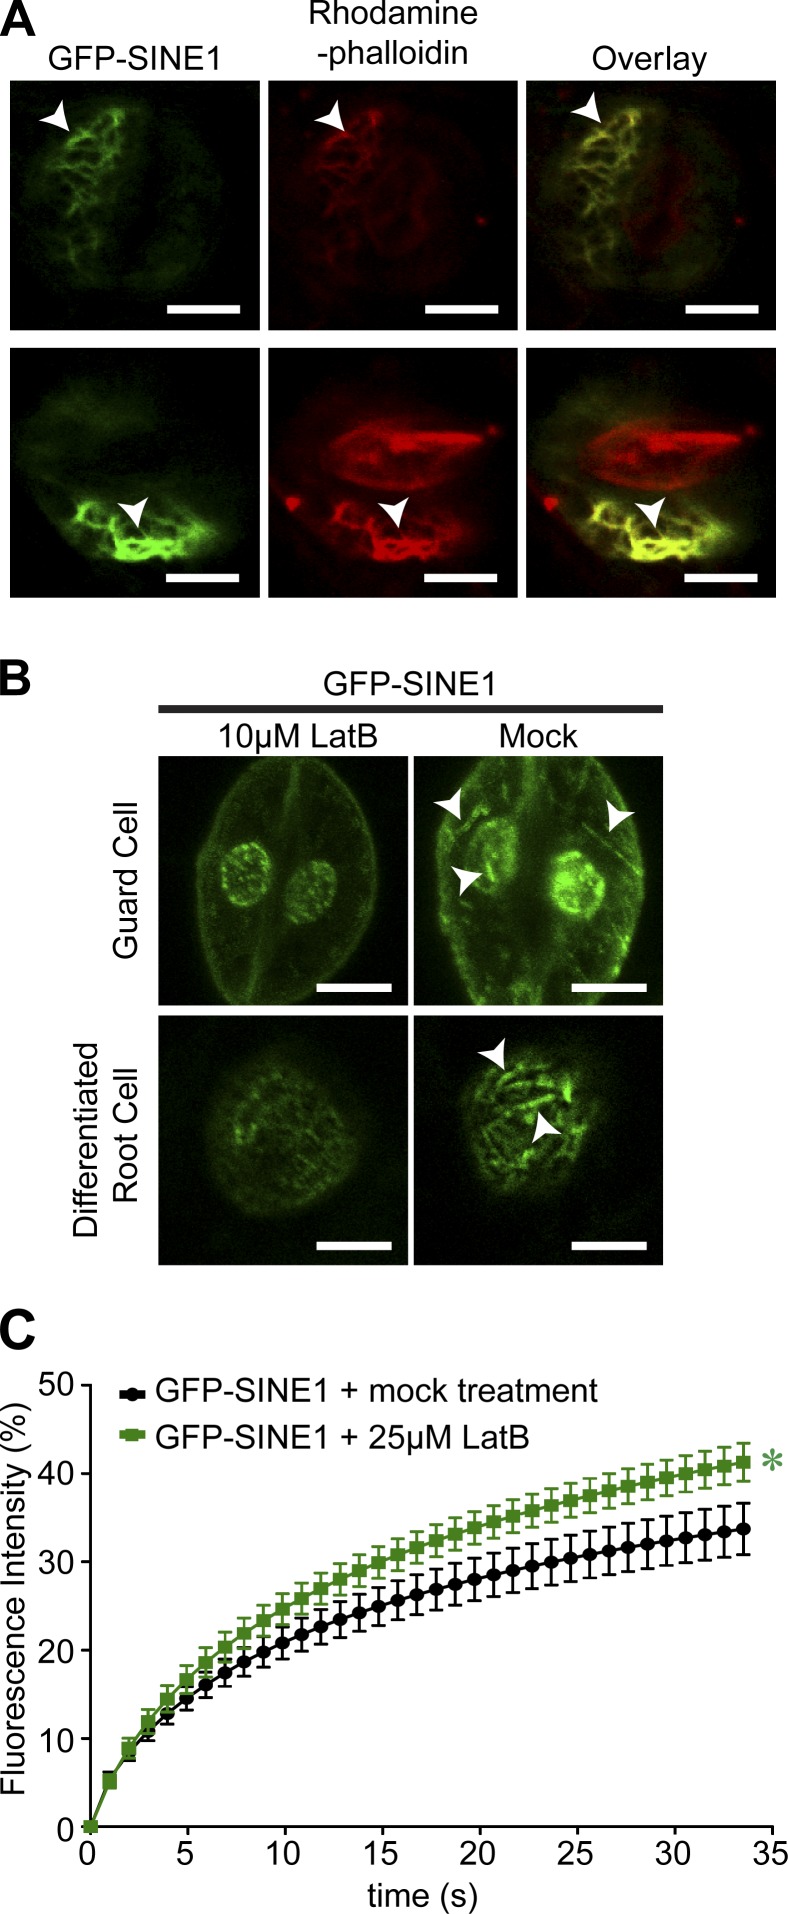
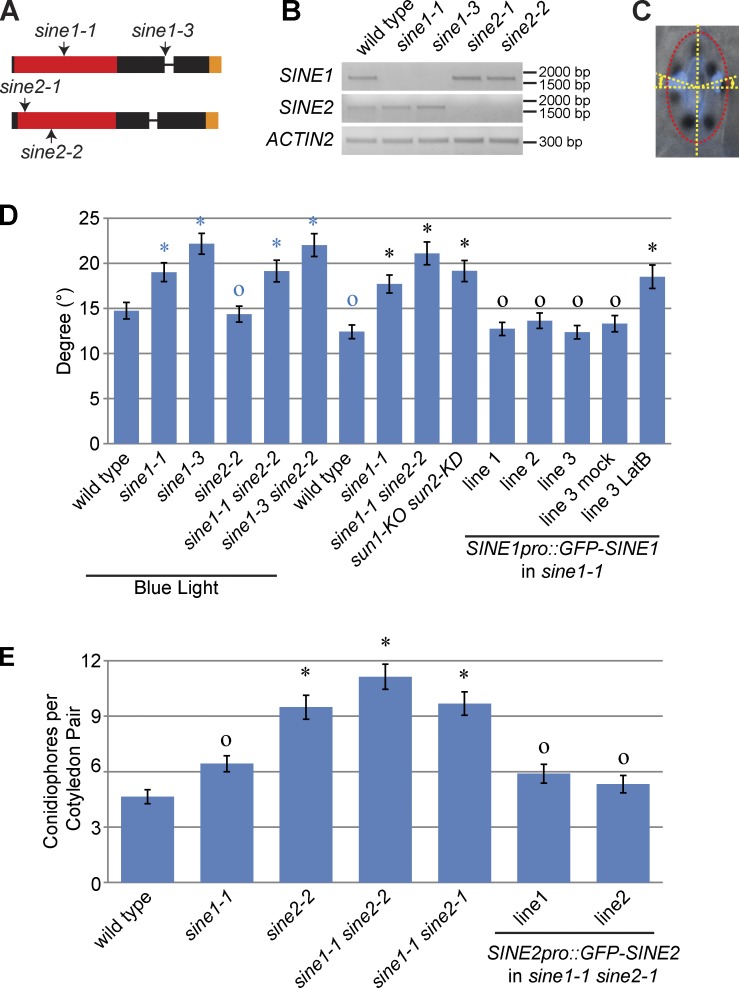
Although a plethora of nuclear envelope (NE) transmembrane proteins (NETs) have been identified in opisthokonts, plant NETs are largely unknown. The only known NET homologues in plants are Sad1/UNC-84 (SUN) proteins, which bind Klarsicht/ANC-1/Syne-1 homology (KASH) proteins. Therefore, de novo identification of plant NETs is necessary. Based on similarities between opisthokont KASH proteins and the only known plant KASH proteins, WPP domain-interacting proteins, we used a computational method to identify the KASH subset of plant NETs. Ten potential plant KASH protein families were identified, and five candidates from four of these families were verified for their NE localization, depending on SUN domain interaction. Of those, Arabidopsis thaliana SINE1 is involved in actin-dependent nuclear positioning in guard cells, whereas its paralogue SINE2 contributes to innate immunity against an oomycete pathogen. This study dramatically expands our knowledge of plant KASH proteins and suggests that plants and opisthokonts have recruited different KASH proteins to perform NE regulatory functions.


Figures

Figure 1.
Figure 1.
Amino acid sequence alignment of the C-terminal domains of predicted plant KASH proteins. (A–D) Amino acid sequence alignment of SINE1/2 homologues (A), SINE3 homologues (B), SINE4 homologues (C), and SINE5 homologues (D). Full-length protein sequences were used for the alignment, and only the C termini are shown. Aly, A. lyrata; Ata, Aegilops tauschii; Bdi, Brachypodium distachyon; Cru, C. rubella; Csa, Cucumis sativus; Fve, Fragaria vesca; Gma, G. max; Hvu, Hordeum vulgare; Mtr, M. truncatula; Osa, Oryza sativa; Ppa, Physcomitrella patens; Ppe, Prunus persica; Ptr, Populus trichocarpa; Rco, Ricinus communis; Sbi, Sorghum bicolor; Sly, Solanum lycopersicum; Smo, S. moellendorffii; Tur, Triticum urartu; Vvi, V. vinifera; Zma, Zea mays. The numbers after the abbreviations are GI numbers. Locus names of A. thaliana proteins are shown in parentheses. Asterisks indicate that the protein models were corrected according to the predicted TMD-putative KASH domain architecture in the ORFs (see Materials and methods for detail). Numbers at the edges of the alignment indicate the first and last (terminal) amino acids of the domains shown. The Phobius-predicted TMD of the first sequence in each alignment is indicated above the sequence. Filled circles indicate proteins predicted not to have a TMD by Phobius. ClustalX color was assigned to the alignments.
Figure 2.
Figure 2.
Subcellular localization of predicted plant KASH proteins. (A and C) GFP-tagged SINE1, SINE2, SINE3, SINE4, and SINE5 under control of the 35S promoter were stably expressed in wild type (A) or sun1-KO sun2-KD (C), respectively. (B) GFP-tagged SINE1ΔTVPT, SINE2ΔLVPT, SINE3ΔPLPT, SINE4ΔLVPT, and SINE5ΔLVPT driven by the 35S promoter were stably expressed in wild-type A. thaliana. Root tip cells were imaged using confocal microscopy. Bars, 5 µm. GFP signal is shown in green. Images in the second column of A are overlays of GFP and transmitted light images. Cell-to-cell variability of GFP fusion protein abundance was seen in all images. (D) The NLI was calculated and compared. As illustrated in the top of D, two maximum NE intensities (N1 and N2) and two maximum cytoplasmic intensities (C1 and C2) along a random line across a cell were chosen to calculate the NLI, which equals (N1 + N2)/(C1 + C2). Asterisks in D represent significant statistic differences when compared with GFP-tagged wild-type SINEs in wild-type A. thaliana (P < 0.01, two-tailed t test, n = 30). Error bars show SEMs.
Figure 3.
Figure 3.
Co-IP analysis of SINE1/2–AtSUN interactions. (A) Domain organization of SINE1, SINE2, and their KASH domain mutants. The C-terminal 4 aa are indicated in bold. (B) Domain organization of AtSUN2 and its mutants. The C-terminal 30 aa of AtSUN2 are shown, and the residues changed in AtSUN2dMut are indicated in red. Diagrams in A and B were drawn to scale, with the gaps in A representing 300 aa. The numbers above each domain indicate the position of the first and the last amino acid of that domain. Magenta, domain N-terminal to the TMD of SINE1 or SINE2; blue, domain N-terminal to the TMD of AtSUN2; yellow, TMD; white, unknown domain; red, coiled-coil domain; green, N-terminal part of the SUN domain; orange, C-terminal part of the SUN domain. (C) SINE1 and SINE2 interact with AtSUN1 through their KASH domain. (D) SINE1 and SINE2 interact with AtSUN2 through their KASH domain. (E–G) AtSUN1 and AtSUN2 interact with SINE1 and SINE2 through their SUN domain. The asterisk in the bottom right of E indicates the codetected GFP-Myc-AtSUN2ΔNSUN band. In C–G, GFP-tagged proteins were immunoprecipitated and detected with anti-GFP antibodies. Myc-tagged proteins were detected with an anti-Myc antibody. The input/IP ratio is 1:9.
Figure 4.
Figure 4.
Co-IP analysis of the SINE3/SINE4/SINE5–AtSUN interactions. (A) Domain organization of SINE3, SINE4, SINE5, and their KASH domain mutants. Diagrams were drawn to scale. Pink, domain N-terminal to the TMD of SINE3; cyan, domain N-terminal to the TMD of SINE4; dark green, domain N-terminal to the TMD of SINE5; yellow, TMD. The numbers above each domain indicate the position of the first and the last amino acid of that domain. The C-terminal 4 aa are indicated in bold. (B) SINE3 interacts with AtSUN1 and AtSUN2 through its KASH domain. (C) AtSUN1 and AtSUN2 interact with SINE3 through their SUN domain. (D) SINE4 interacts with the SUN domain of AtSUN1 through its KASH domain. (E) SINE4 interacts with the SUN domain of AtSUN2 through its KASH domain. (F) SINE5 interacts with the SUN domain of AtSUN1 through its KASH domain. (G) SINE5 interacts with the SUN domain of AtSUN2 through its KASH domain. In B–G, GFP-tagged proteins were immunoprecipitated and detected with anti-GFP antibodies. Myc-tagged proteins were detected with an anti-Myc antibody. The input/IP ratio is 1:9. In D and F, the vertical black lines represent the removal of empty intervening lanes for presentation purposes.
Figure 5.
Figure 5.
FRAP analysis of the interaction between SINE1/2 and AtSUN. Fluorescent protein fusions of SINE1, SINE2, and SUN proteins were transiently expressed in N. benthamiana leaves, and protein mobility was studied by FRAP. (A) Recovery curves of GFP-SINE1 alone or GFP-SINE1 coexpressed with RFP-Flag-AtSUN1 or RFP-Flag-AtSUN1ΔNSUN, respectively. (B) Recovery curves of GFP-SINE1 alone or GFP-SINE1 coexpressed with RFP-Myc-AtSUN2 or RFP-Myc-AtSUN2ΔNSUN, respectively. (C) Recovery curves of GFP-SINE2 alone or GFP-SINE2 coexpressed with RFP-Flag-AtSUN1 or RFP-Flag-AtSUN1ΔNSUN, respectively. (D) Recovery curves of GFP-SINE2 alone or GFP-SINE2 coexpressed with RFP-Myc-AtSUN2 or RFP-Myc-AtSUN2ΔNSUN, respectively. Color-coded asterisks after each curve indicate that the maximum recovery of that curve shows a statistically significant difference when compared with the black curve (P < 0.01, two-tailed t test, n = 35), whereas color-coded circles after each curve indicate no statistical significant difference (P > 0.05, two-tailed t test, n = 35). Error bars represent SEMs.
Figure 6.
Figure 6.
Expression and protein localization pattern of SINE1 and SINE2 in leaves. (A) SINE1 is expressed in guard cells and guard cell mother cells (top, arrowheads), and the protein is localized to fibers in guard cells (bottom, arrows). (B) SINE2 is expressed mainly in epidermal cells and mesophyll cells and weakly in guard cells (circled by a dotted ellipse). The images are maximum intensity projections of a z-stack image. Autofluorescence of chloroplasts are shown in red and overlaid with the GFP signal. Bars, 10 µm. In the overlay images, asterisks indicate the nuclei observed, and P letters indicate stomatal pores enclosed by pairs of guard cells.
Figure 7.
Figure 7.
Expression and protein localization pattern of SINE1 and SINE2 in trichomes and roots. (A) Expression and protein localization pattern of SINE1 in trichomes and roots. (B) Expression and protein localization pattern of SINE2 in trichomes and roots. Both genes are expressed in root cells, but only SINE2 is expressed in trichomes. Both proteins are localized at the NE. The trichome image of GFP-SINE1 was taken with 5× higher laser power (50%) than that used for GFP-SINE2, as indicated by the autofluorescence from the trichome cell wall. For the differentiated root cells, the nuclear surface was imaged to compare the fiber structure of GFP-SINE1 (outlined by dotted magenta lines in the overlay image) and relatively evenly distributed signal of GFP-SINE2. Bars, 10 µm. Diff., differentiated; Undiff., undifferentiated.
Figure 8.
Figure 8.
Association of SINE11–308 with F-actin filaments. (A) GFP-SINE11–308 was transiently coexpressed with RFP-Lifeact (first row) or MAP4-RFP (middle row) in N. benthamiana leaves, showing that GFP-SINE11–308 was colocalized with RFP-Lifeact but not MAP4-RFP. GFP-SINE21–309 was transiently coexpressed with RFP-Lifeact in N. benthamiana leaves (bottom row), but GFP-SINE21–309 was localized to the cytoplasm instead of F-actin fibers labeled by RFP-Lifeact. (B) GFP-SINE11–308 and RFP-Lifeact were colocalized in root cells of stably transformed A. thaliana plants. Bars, 10 µm.
Figure 9.
Figure 9.
Association of SINE1 with F-actin filaments in guard cells. (A) GFP-SINE1 is colocalized with rhodamine-phalloidin–labeled filaments in A. thaliana guard cells (arrowheads). (B) The SINE1 fibers in both guard cells and root cells are sensitive to 1-h treatment of 10 µM LatB, but the fibers (arrowheads) are still visible in the mock treatment. The images of guard cells are maximum intensity projections of a z-stack image. The differentiated root cell nuclei were imaged at the nuclear surface. (C) FRAP recovery curves of GFP-SINE1 with or without LatB-triggered F-actin depolymerization. A. thaliana lines stably transformed with GFP-SINE1 driven by the 35S promoter were used for FRAP. The asterisk indicates a significant statistical difference of the maximum recovery compared with the black curve (two-tailed t test, P < 0.01, n = 35). Error bars represent SEMs. Bars, 5 µm.
Figure 10.
Figure 10.
Biological roles of SINE1 and SINE2. (A) T-DNA insertion sites of sine1-1, sine1-3, sine2-1, and sine2-2. The left borders of T-DNA insertion sites were confirmed by sequencing and indicated by arrows on SINE1 and SINE2 genomic structures (drawn to scale). Exons are depicted as filled bars, and introns are depicted as lines. DNA fragments encoding the ARM repeats and the TMD-KASH domain are shown in red and orange, respectively. (B) RT-PCR determination of the expression levels of SINE1 and SINE2 in their mutants. Primers amplified the full-length coding sequences are listed in Table S2. (C) Example of measuring nuclear position in guard cells. An ellipse was rendered on a pair of guard cells, and the acute angle between the center of the nucleus and the minor axis (indicated by curved double-headed arrows) was measured. (D) Mean guard cell nuclear positions determined by the angle shown in C. Blue asterisks, P < 0.01 when compared with wild type after blue light treatment; blue circles, P > 0.05 when compared with wild type after blue light treatment; black asterisks, P < 0.01 when compared with wild type without blue light treatment; black circles, P > 0.05 when compared with wild type without blue light treatment. Two-tailed t test was used and n = 172. (E) Quantification of conidiophore formation on the cotyledon adaxial side as a measure of Hpa Noco2 growth on the indicated genotypes. Values are means ± SE of three biological replicates, each with n = 40. Asterisks indicate significant differences to wild type, and circles represent no significant differences to wild type. One-way analysis of variance (α < 0.01; n = 120) followed by Tukey’s honest significant difference test (α < 0.01) was used.

Similar articles

Cited by

References

    1. Becker B., Marin B. 2009. Streptophyte algae and the origin of embryophytes. Ann. Bot. (Lond.). 103:999–1004 10.1093/aob/mcp044 - DOI - PMC - PubMed
    1. Caillaud M.-C., Piquerez S.J.M., Fabro G., Steinbrenner J., Ishaque N., Beynon J., Jones J.D.G. 2012. Subcellular localization of the Hpa RxLR effector repertoire identifies a tonoplast-associated protein HaRxL17 that confers enhanced plant susceptibility. Plant J. 69:252–265 10.1111/j.1365-313X.2011.04787.x - DOI - PubMed
    1. Clough S.J., Bent A.F. 1998. Floral dip: a simplified method for Agrobacterium-mediated transformation of Arabidopsis thaliana. Plant J. 16:735–743 10.1046/j.1365-313x.1998.00343.x - DOI - PubMed
    1. Coates M.E., Beynon J.L. 2010. Hyaloperonospora Arabidopsidis as a pathogen model. Annu. Rev. Phytopathol. 48:329–345 10.1146/annurev-phyto-080508-094422 - DOI - PubMed
    1. Crisp M., Liu Q., Roux K., Rattner J.B., Shanahan C., Burke B., Stahl P.D., Hodzic D. 2006. Coupling of the nucleus and cytoplasm: role of the LINC complex. J. Cell Biol. 172:41–53 10.1083/jcb.200509124 - DOI - PMC - PubMed

Publication types