. 2014 Jul;165(3):1285-1301.
doi: 10.1104/pp.114.241844. Epub 2014 Jun 2.

Cotyledon-Generated Auxin Is Required for Shade-Induced Hypocotyl Growth in Brassica rapa

Affiliations

Cotyledon-Generated Auxin Is Required for Shade-Induced Hypocotyl Growth in Brassica rapa

Carl Procko et al. Plant Physiol. 2014 Jul.

Abstract

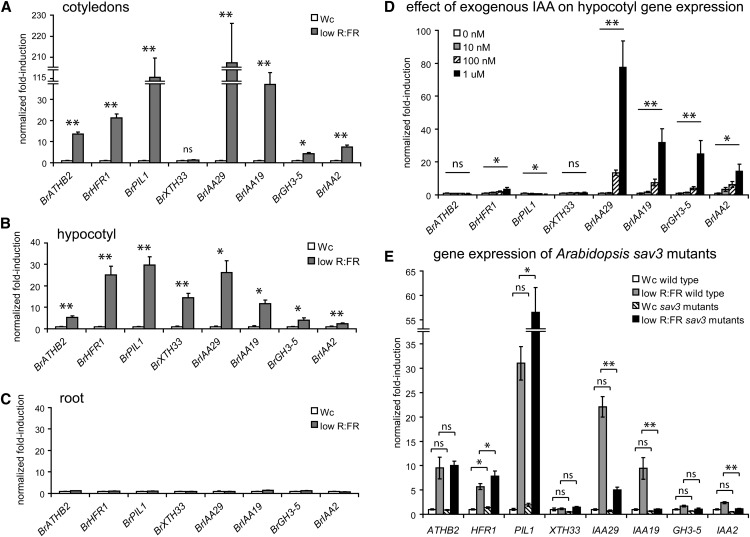
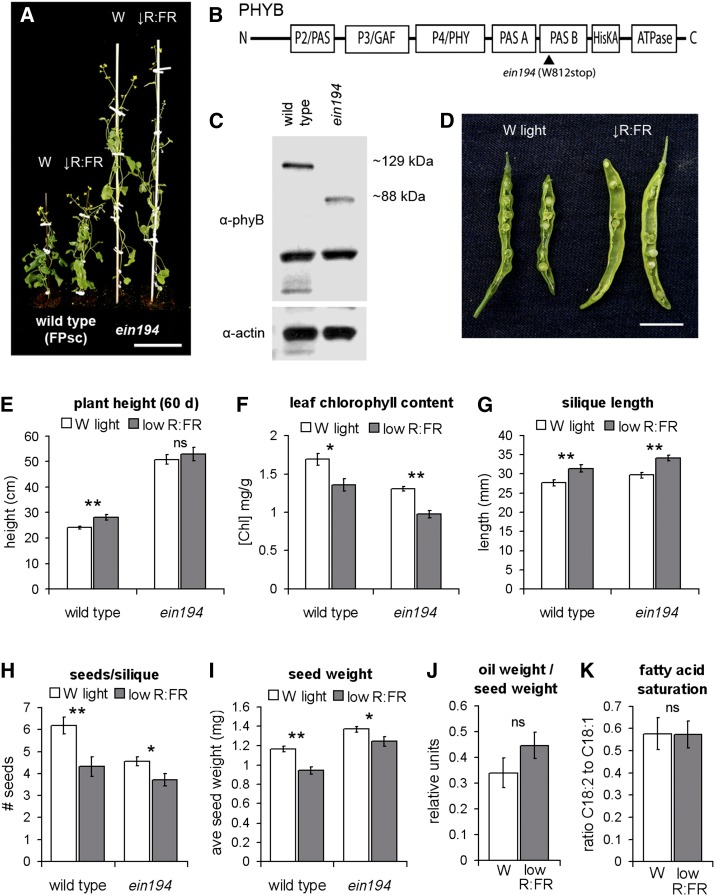
Plant architecture is optimized for the local light environment. In response to foliar shade or neighbor proximity (low red to far-red light), some plant species exhibit shade-avoiding phenotypes, including increased stem and hypocotyl growth, which increases the likelihood of outgrowing competitor plants. If shade persists, early flowering and the reallocation of growth resources to stem elongation ultimately affect the yield of harvestable tissues in crop species. Previous studies have shown that hypocotyl growth in low red to far-red shade is largely dependent on the photoreceptor phytochrome B and the phytohormone auxin. However, where shade is perceived in the plant and how auxin regulates growth spatially are less well understood. Using the oilseed and vegetable crop species Brassica rapa, we show that the perception of low red to far-red shade by the cotyledons triggers hypocotyl cell elongation and auxin target gene expression. Furthermore, we find that following shade perception, elevated auxin levels occur in a basipetal gradient away from the cotyledons and that this is coincident with a gradient of auxin target gene induction. These results show that cotyledon-generated auxin regulates hypocotyl elongation. In addition, we find in mature B. rapa plants that simulated shade does not affect seed oil composition but may affect seed yield. This suggests that in field settings where mutual shading between plants may occur, a balance between plant density and seed yield per plant needs to be achieved for maximum oil yield, while oil composition might remain constant.


Figures

Figure 1.
Figure 1.
B. rapa seedlings display auxin-dependent shade avoidance phenotypes. A, Representative image of 7-d-old B. rapa R-o-18 seedlings grown in constant W light (Wc) or 4 d of constant W light followed by 3 d of low R:FR light (↓R:FR). Bar = 1 cm. B to D, Hypocotyl length (B), cotyledon area (C), and lateral root formation (D) of 7-d-old seedlings treated as in A. E, Hypocotyl length of 7-d-old seedlings grown for 4 d in constant W light then 3 d in liquid culture in constant W light or low R:FR light in the presence of dimethyl sulfoxide (DMSO; vehicle), 10 μm auxinole, or 10 μm NPA. Data show means ± se. Student’s t test: **P < 0.005, *P < 0.05. [See online article for color version of this figure.]
Figure 2.
Figure 2.
qPCR expression analysis of low R:FR shade-induced marker genes. Four-day-old W light-grown wild-type (A; FPsc strain) and phyB mutant (B; ein194) seedlings were treated for 2 h in constant W light (Wc) or 2 h in low R:FR light. For each gene, expression is shown relative to the 2-h constant W light treatment ± se. Student’s t test: **P < 0.005, *P < 0.05, ns = not significant.
Figure 3.
Figure 3.
Shade-induced genes are expressed in distinct organs and can be auxin dependent or independent. A to C, qPCR expression analysis of shade-induced marker genes in the cotyledons (A), hypocotyl (B), and roots (C) of 7-d-old W light-grown B. rapa R-o-18 seedlings treated for 2 h with constant W light (Wc) or low R:FR light. For each gene, expression is shown relative to the 2-h constant W light treatment. D, Gene expression in the hypocotyl of 7-d-old R-o-18 seedlings treated for 150 min in liquid culture with the indicated concentrations of IAA. Normalized fold induction for each gene is shown relative to the vehicle control (0 nm; ethanol). E, Expression of orthologous genes in whole seedlings of the wild type (Columbia-0) and sav3-1 mutants of Arabidopsis. Seven-day-old W light-grown seedlings were treated for 1 h with constant W light or low R:FR light. Expression is shown relative to the constant W light-treated wild-type plants ± se. Asterisks indicate significant differences for Student’s t test (A–C and E) and one-way ANOVA (D): **P < 0.005, *P < 0.05, ns = not significant. In C, all comparisons are not significant. In E, sav3 mutants are compared with wild-type seedlings grown in equivalent conditions.
Figure 4.
Figure 4.
The cotyledons regulate hypocotyl growth and gene expression. A, Experimental setup of B to D. The cotyledons (C) of W light-grown R-o-18 B. rapa seedlings were removed immediately prior to light treatment. Light treatments consisted of continued constant W light (Wc) or simulated shade (low R:FR). The cotyledons of operated seedlings were removed at the base of the petioles, while the hypocotyl (H) and root (R) were left intact. B, Hypocotyl lengths of 6-d-old seedlings grown for 4 d in constant W light and then an additional 2 d in constant W light or low R:FR light. In operated seedlings, the cotyledons of 4-d-old seedlings were removed as described in A. Data show means ± se. C and D, Gene expression in the hypocotyls of 7-d-old W light-grown R-o-18 seedlings treated with either 2 h in constant W light or low R:FR light, in intact seedlings (C) or seedlings where the cotyledons were removed immediately prior to the 2-h light treatment (D). For each gene, expression is shown relative to the 2-h constant W light treatment, as measured by qPCR analysis, ± se. Student’s t test in B to D: **P < 0.005, *P < 0.05, ns = not significant.
Figure 5.
Figure 5.
The cotyledons regulate hypocotyl growth and gene expression in intact seedlings. A, Experimental setup of B to D. W light-grown R-o-18 B. rapa seedlings were positioned in a split-light chamber. The cotyledons (C) or the hypocotyl (H) and root (R) were exposed to either high R:FR light (W light; R:FR > 15) or low R:FR light (W light supplemented with FR light; R:FR < 0.8). The cotyledons were fixed in position, while the roots were suspended in liquid growth medium to allow vertical growth of the hypocotyl down. For a complete description of the light conditions used, see Supplemental Figure S9. B, Hypocotyl lengths of R-o-18 seedlings grown as described in A. Four-day-old seedlings were transferred to the split-light chamber and grown for an additional 3 d. Data show means ± se. C and D, Gene expression in the cotyledons (C) and hypocotyls (D) of seedlings grown in the split-light chamber. W light-grown plants were transferred to the split-light chamber at 4 d and allowed to equilibrate to W light conditions (high R:FR). At 6.5 d, the ratio of R:FR light was adjusted as described in B, and gene expression levels were measured by qPCR 12 h later. The light treatments of each column (white, gray, striped, and black) are as indicated in B. For each gene, expression is shown relative to seedlings where both the cotyledons and hypocotyl plus root were exposed to high R:FR light ± se. Asterisks indicate significant differences for Student’s t test (B) and one-way ANOVA (C and D). **P < 0.005, *P < 0.05, ns = not significant.
Figure 6.
Figure 6.
Low R:FR shade induces a basipetal gradient of auxin-dependent gene expression. A, Experimental setup of C to E. The hypocotyl of 7-d-old W light-grown seedlings (R-o-18) was sectioned after the indicated light treatments into apical, middle, and basal fragments. C, Cotyledons; H, hypocotyl; R, root. B, Free IAA levels in the cotyledons following 6 h of W or low R:FR light treatment. C, Free IAA levels in apical, middle, and basal segments of the hypocotyl following 6 h of W or low R:FR light treatment. In B and C, data show means ± se (n = 5). Student’s t test: **P < 0.005, *P < 0.05, ns = not significant. D and E, qPCR expression analysis of auxin-dependent genes in the hypocotyl following 2 h (D) or 6 h (E) of low R:FR light treatment. Expression is shown for low R:FR-treated hypocotyl segments relative to the W light-treated control segments ± se. In D, asterisks indicate a significant interaction between light treatment and the hypocotyl segment using a two-factor ANOVA with repeated measures on one factor (hypocotyl segment): **P < 0.005, ns = not significant. By 6 h, no significant interaction is observed for any of the genes.
Figure 7.
Figure 7.
B. rapa hypocotyl growth occurs in a basipetal gradient. A, R-o-18 seedlings were grown for 4 d in constant W light (Wc) and the hypocotyl was marked into three divisions of equal size (apex, middle, and base). After a further 3 d of growth in either constant W light or low R:FR shade, the length of each segment was measured. B, Length of hypocotyl epidermal cells of 4- and 7-d-old W light-grown plants, as determined by scanning electron microscopy. The hypocotyls of imaged plants were divided into five equal segments (1–5) for analysis. C, Epidermal cell lengths at the hypocotyl apex (0–2 mm below the hypocotyl-petiole junction) and base (1–3 mm from hypocotyl-root junction). Four-day-old W light-grown seedlings were treated with W or low R:FR light for 3 d. In A to C, data show means ± se. Student’s t test: **P < 0.005, *P < 0.05, ns = not significant. D and I, Overlaid scanning electron microscopy images of full-length hypocotyls of constant W light (D) and low R:FR (I) seedlings grown under the conditions described in C. Boxes mark equivalent positions of the images shown in E to H. E to H, Representative scanning electron microscopy images of epidermal cells from the apex (E and G) and base (F and H) of the hypocotyl of constant W light-grown (E and F) and low R:FR light-grown (G and H) seedlings. White outlines show examples of the large, bulbous epidermal cells measured in B and C. In all images, the apex is up. Bars = 0.5 cm (D and I) and 500 μm (E–H).
Figure 8.
Figure 8.
Mature B. rapa plants show defects in seed number and weight in low R:FR light but not in oil content. A, Representative image of 60-d-old wild-type (FPsc) and phyB mutant (ein194) plants grown in long days (16 h of light and 8 h of dark) in W light (W) or W light supplemented with FR (↓R:FR). Bar = 10 cm. B and C, Schematic of PHYB apoprotein, showing the position of the ein194 mutation (B). Domains are represented by boxes. ein194 codes for a truncated form of the protein, seen by western blot (C). D, Representative image of dissected siliques 14 d after pollination from wild-type plants grown in W light or low R:FR shade. Bar = 1 cm. E to K, Plant height at 60 d (E), leaf chlorophyll content (F), silique length (G), number of seeds per silique (H), seed weight (I), oil weight per seed weight (J), and ratio of C18:2 to C18:1 fatty acids (K) of wild-type and ein194 plants grown under W or low R:FR light. Data show means ± se. Student’s t test: **P < 0.005, *P < 0.05, ns = not significant.

Similar articles

Cited by

References

    1. Al-Sady B, Ni W, Kircher S, Schäfer E, Quail PH. (2006) Photoactivated phytochrome induces rapid PIF3 phosphorylation prior to proteasome-mediated degradation. Mol Cell 23: 439–446 - PubMed
    1. Andersen SU, Buechel S, Zhao Z, Ljung K, Novák O, Busch W, Schuster C, Lohmann JU. (2008) Requirement of B2-type cyclin-dependent kinases for meristem integrity in Arabidopsis thaliana. Plant Cell 20: 88–100 - PMC - PubMed
    1. Ballaré CL. (2009) Illuminated behaviour: phytochrome as a key regulator of light foraging and plant anti-herbivore defence. Plant Cell Environ 32: 713–725 - PubMed
    1. Ballare CL, Scopel AL, Sanchez RA. (1997) Foraging for light: photosensory ecology and agricultural implications. Plant Cell Environ 20: 820–825
    1. Black M, Shuttleworth JE. (1974) The role of the cotyledons in the photocontrol of hypocotyl extension in Cucumis sativus L. Planta 117: 57–66 - PubMed

LinkOut - more resources