

Endocrine cells in the oxyntic mucosa of the stomach in patients with irritable bowel syndrome
- PMID: 24891930
- PMCID: PMC4024490
- DOI: 10.4253/wjge.v6.i5.176
Endocrine cells in the oxyntic mucosa of the stomach in patients with irritable bowel syndrome
Abstract
Aim: To study the different endocrine cell types in the oxyntic mucosa of patients with irritable bowel syndrome (IBS).
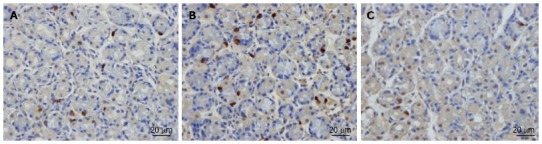
Methods: Seventy-six patients with IBS were included in the study (62 females and 14 males; mean age 32 years, range 18-55 years), of which 40 also fulfilled the Rome III criteria for functional dyspepsia (FDP). Of the entire IBS cohort, 26 had diarrhea as the predominant symptom (IBS-D), 21 had a mixture of diarrhea and constipation (IBS-M), and 29 had constipation as the predominant symptom (IBS-C). Forty-three age and sex-matched healthy volunteers without any gastrointestinal complaints served as controls. The patients were asked to complete the Birmingham IBS symptom questionnaire. Both the patients and controls underwent a standard gastroscopy, during which three biopsy samples were taken from the corpus. Sections from these biopsy samples were immunostained using the avidin-biotin complex (ABC) method, for ghrelin, serotonin, somatostatin and histamine. The densities of these cell types and immunoreactivity intensities were quantified using computerized image analysis with Olympus cellSens imaging software (version 1.7).
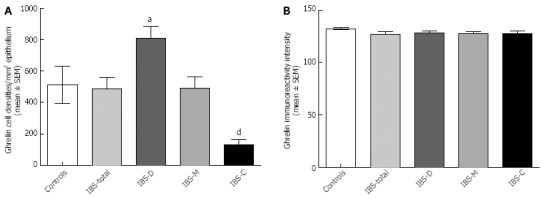
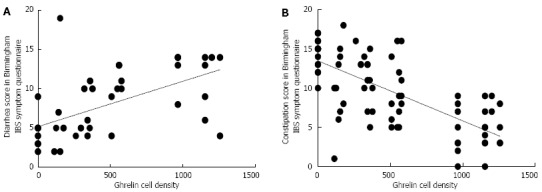
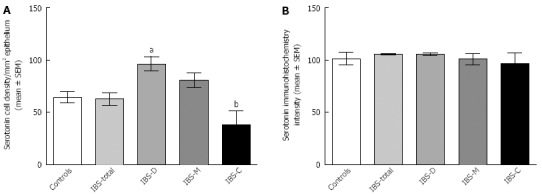
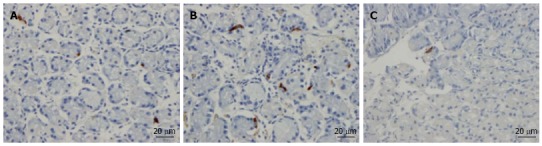
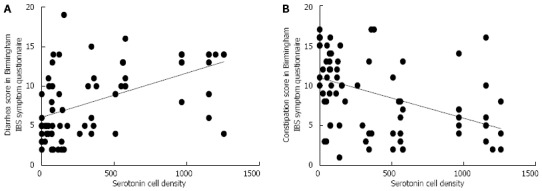
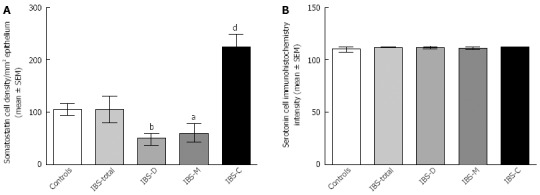
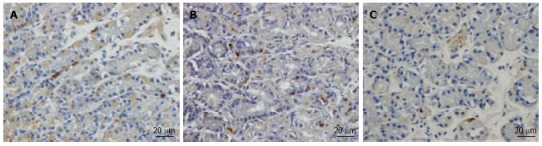
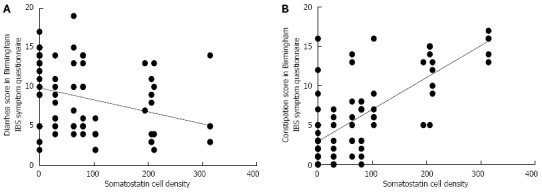
Results: The densities of the ghrelin cells in the control, IBS-total, IBS-D, IBS-M and IBS-C groups were 389 (320, 771), 359 (130, 966), 966 (529, 1154), 358 (120, 966) and 126 (0, 262) cells/mm(2), respectively. There was a significant difference between the tested groups (P < 0.0001). Dunn's multiple comparison test showed that the ghrelin cell density was significantly higher in IBS-D and lower in IBS-C than in the controls (P = 0.03 and 0.0008, respectively). The ghrelin cell density in patients with both IBS and FDP was 489 (130, 966), and in those with IBS only 490 (130, 956). There was no statistical significant difference between these 2 groups of patients (P = 0.9). The immunoreactivity intensity did not differ between any of the groups (P = 0.6). The diarrhea score of the Birmingham IBS symptom questionnaire was significantly positively correlated with ghrelin cell density (r = 0.65; P < 0.0001) and significantly inversely correlated with that of constipation (r = 90.69; P < 0.0001). The densities of the serotonin cells were 63 (51, 82), 51 (25, 115), 120 (69, 128), 74 (46, 123) and 40 (0, 46) cells/mm(2) in the control, IBS-total, IBS-D, IBS-M and IBS-C groups, respectively. A statistically significant difference was found between the tested groups (P < 0.0001). Posttest revealed that serotonin cell density was significantly higher in IBS-D and lower in IBS-C than in controls (P = 0.02 and 0.004, respectively), but did not differ in the IBS-total and IBS-M groups from that in controls (P = 0.5 and 0.4, respectively). The serotonin cell density in patients with both IBS and FDP was 62 (25, 115) and in those with IBS only 65 (25, 123). There was no statistically significant difference between these 2 groups of patients (P = 1). The immunoreactivity intensity of serotonin did not differ significantly between any of the groups (P = 0.0.9). The serotonin cell density was significantly positively correlated with the diarrhea score of the Birmingham IBS symptom questionnaire (r = 0.56; P < 0.0001) and significantly inversely correlated with that of constipation (r = 0.51; P < 0.0001). The densities of the somatostatin cells were 97 (72, 126), 72 (0, 206), 29 (0, 80), 46 (0, 103) and 206 (194, 314) cells/mm(2) in the control, IBS-total, IBS-D, IBS-M and IBS-C groups, respectively (Figures 7 and 8). There was a statistically significant difference between the controls and the IBS subgroups (P < 0.0001). The density of somatostatin cells was significantly lower in the IBS-D and IBS-M groups but higher in IBS-C patients than in the controls (P < 0.01, P = 0.02, and P = 0.0008, respectively). The somatostatin cell density in patients with both IBS and FDP was 86 (0-194), and in those with IBS only 110 (0-206). There was no statistically significant difference between these 2 groups of patients (P = 0.6). There was no significant difference in somatostatin immunoreactivity intensity between the controls. The diarrhea score of the Birmingham IBS symptom questionnaire was inversely correlated with somatostatin cell density (r = 0.38; P = 0.0007) and was positively correlated with that of constipation (r = 0.64; P < 0.0001).
Conclusion: The finding of abnormal endocrine cells in the oxyntic mucosa shows that the endocrine cell disturbances in IBS are not restricted to the intestine. Furthermore, it appears that ghrelin, serotonin and somatostatin in the oxyntic mucosa of the stomach may play an important role in the changing stool habits in IBS through their effects on intestinal motility.
Keywords: Birmingham irritable bowel syndrome symptom questionnaire; Ghrelin; Immunohistochemistry; Serotonin; Somatostatin.
Figures
Similar articles
-
Endocrine cells in the ileum of patients with irritable bowel syndrome.World J Gastroenterol. 2014 Mar 7;20(9):2383-91. doi: 10.3748/wjg.v20.i9.2383. World J Gastroenterol. 2014. PMID: 24605036 Free PMC article.
-
Reduction in duodenal endocrine cells in irritable bowel syndrome is associated with stem cell abnormalities.World J Gastroenterol. 2015 Aug 28;21(32):9577-87. doi: 10.3748/wjg.v21.i32.9577. World J Gastroenterol. 2015. PMID: 26327765 Free PMC article.
-
Stomach antral endocrine cells in patients with irritable bowel syndrome.Int J Mol Med. 2014 Oct;34(4):967-74. doi: 10.3892/ijmm.2014.1887. Epub 2014 Aug 8. Int J Mol Med. 2014. PMID: 25110039 Free PMC article.
-
Abnormal small-intestinal endocrine cells in patients with irritable bowel syndrome.Dig Dis Sci. 2010 Dec;55(12):3508-13. doi: 10.1007/s10620-010-1169-6. Epub 2010 Mar 19. Dig Dis Sci. 2010. PMID: 20300845
-
Abnormal rectal endocrine cells in patients with irritable bowel syndrome.Regul Pept. 2014 Jan 10;188:60-5. doi: 10.1016/j.regpep.2013.11.005. Epub 2013 Dec 6. Regul Pept. 2014. PMID: 24316398
Cited by
-
Effect of dietary management on the gastric endocrine cells in patients with irritable bowel syndrome.Eur J Clin Nutr. 2015 Apr;69(4):519-24. doi: 10.1038/ejcn.2014.151. Epub 2014 Aug 6. Eur J Clin Nutr. 2015. PMID: 25097003 Free PMC article.
-
A Starch- and Sucrose-Reduced Diet in Irritable Bowel Syndrome Leads to Lower Circulating Levels of PAI-1 and Visfatin: A Randomized Controlled Study.Nutrients. 2022 Apr 19;14(9):1688. doi: 10.3390/nu14091688. Nutrients. 2022. PMID: 35565656 Free PMC article. Clinical Trial.
-
Density of Musashi‑1‑positive stem cells in the stomach of patients with irritable bowel syndrome.Mol Med Rep. 2020 Oct;22(4):3135-3140. doi: 10.3892/mmr.2020.11412. Epub 2020 Aug 4. Mol Med Rep. 2020. PMID: 32945509 Free PMC article.
-
Diet in irritable bowel syndrome.Nutr J. 2015 Apr 14;14:36. doi: 10.1186/s12937-015-0022-3. Nutr J. 2015. PMID: 25880820 Free PMC article. Review.
-
Increased gastric chromogranin A cell density following changes to diets of patients with irritable bowel syndrome.Mol Med Rep. 2014 Nov;10(5):2322-6. doi: 10.3892/mmr.2014.2498. Epub 2014 Aug 18. Mol Med Rep. 2014. PMID: 25174455 Free PMC article.
References
-
- El-Salhy M, Seim I, Chopin L, Gundersen D, Hatlebakk JG, Hausken T. Irritable bowel syndrome: the role of gut neuroendocrine peptides. Front Biosci (Elite Ed) 2012;4:2783–2800. - PubMed
-
- El-Salhy M, Ostgaard H, Gundersen D, Hatlebakk JG, Hausken T. The role of diet in the pathogenesis and management of irritable bowel syndrome (Review) Int J Mol Med. 2012;29:723–731. - PubMed
-
- El-Salhy M, Gundersen D, Hatlebakk JG, Hausken T. Irritable bowel syndrome: diagnosis, pathogenesis and treatment options. New York: Nova Science Publishers Inc; 2012.
-
- Sternini C. Taste receptors in the gastrointestinal tract. IV. Functional implications of bitter taste receptors in gastrointestinal chemosensing. Am J Physiol Gastrointest Liver Physiol. 2007;292:G457–G461. - PubMed
LinkOut - more resources
Full Text Sources
Other Literature Sources
