. 2014 Dec 20;21(18):2498-514.
doi: 10.1089/ars.2014.5843. Epub 2014 Jul 31.

The PTEN/NRF2 axis promotes human carcinogenesis

Affiliations

The PTEN/NRF2 axis promotes human carcinogenesis

Ana I Rojo et al. Antioxid Redox Signal. .

Abstract

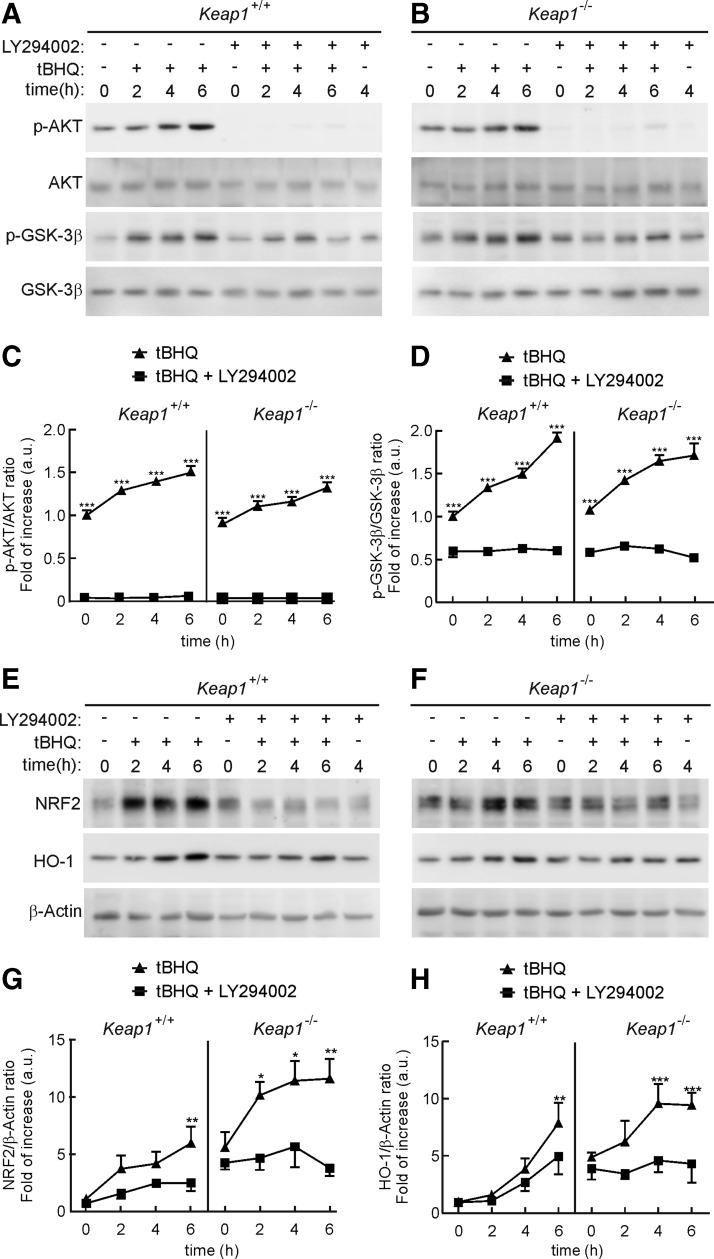
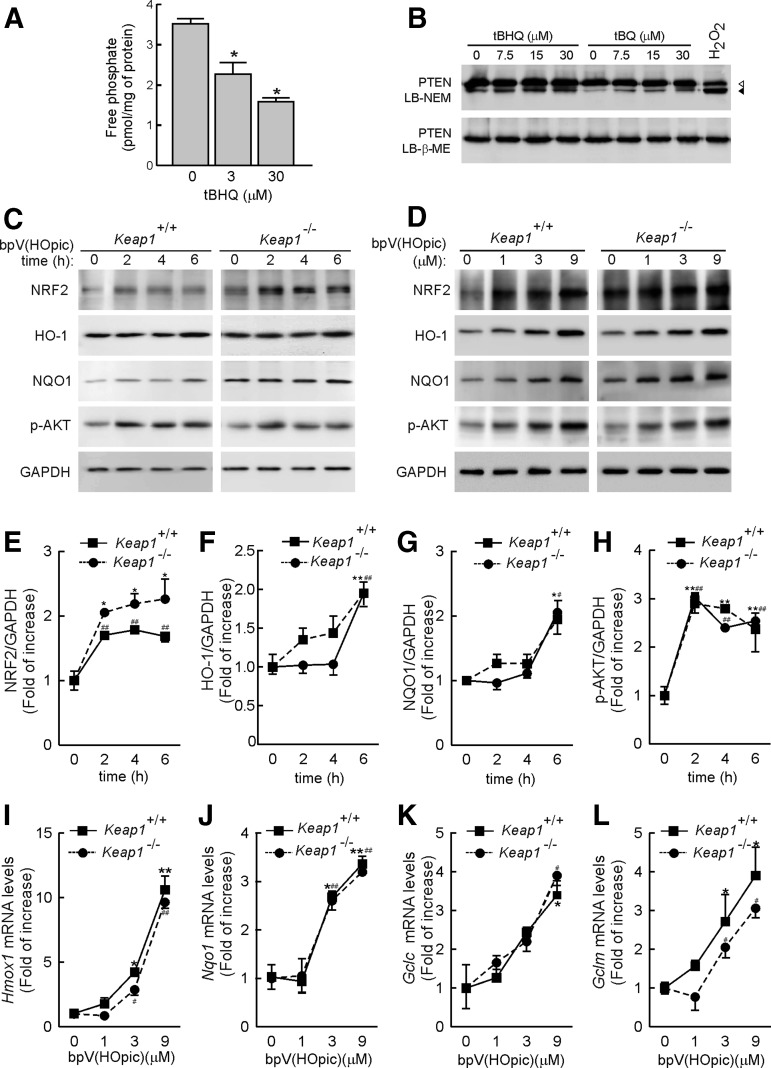
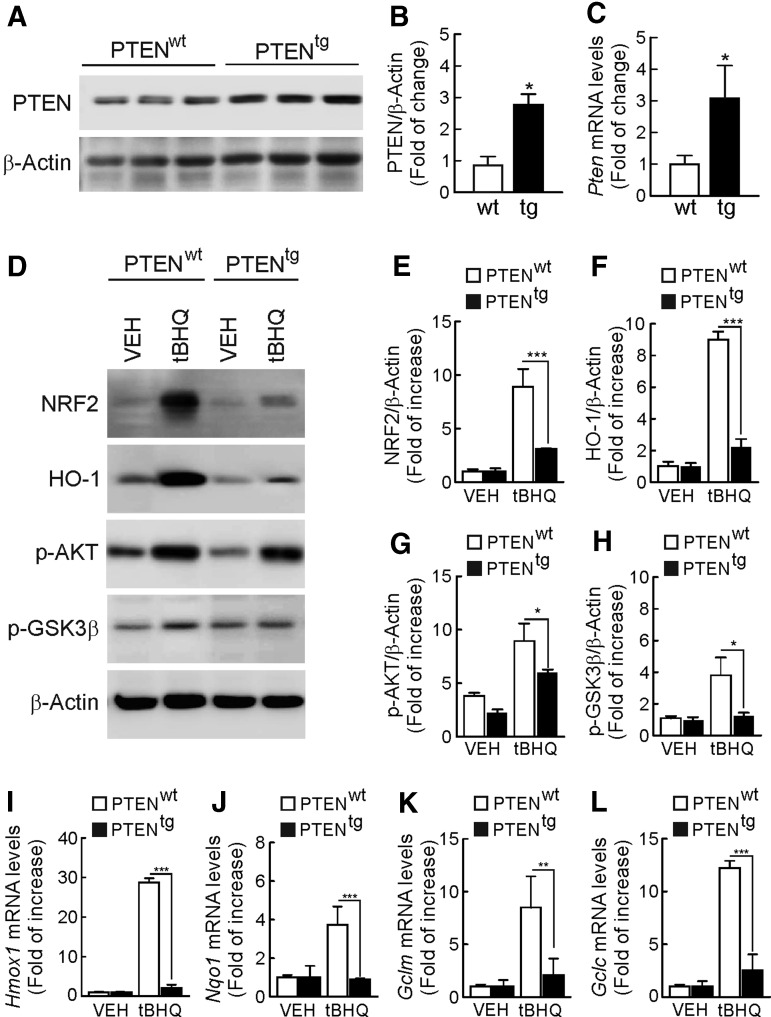
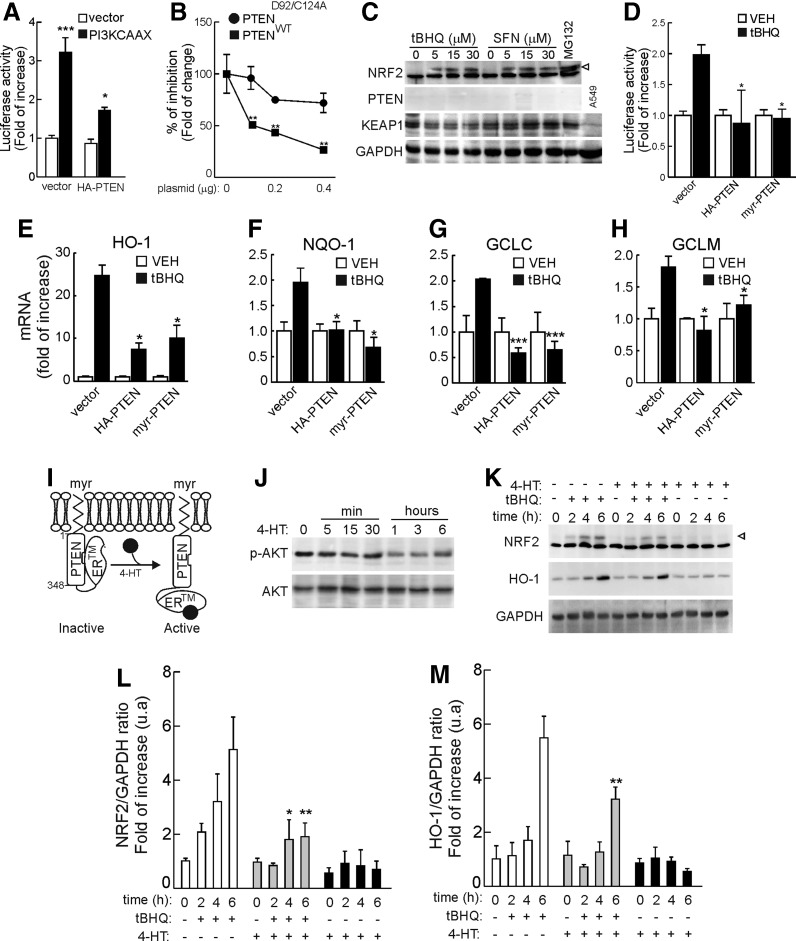
Aims: A recent study conducted in mice reported that liver-specific knockout of tumor suppressor Pten augments nuclear factor (erythroid-derived 2)-like 2 (NRF2) transcriptional activity. Here, we further investigated how phosphatase and tensin homolog deleted on chromosome 10 (PTEN) controls NRF2 and the relevance of this pathway in human carcin ogenesis.

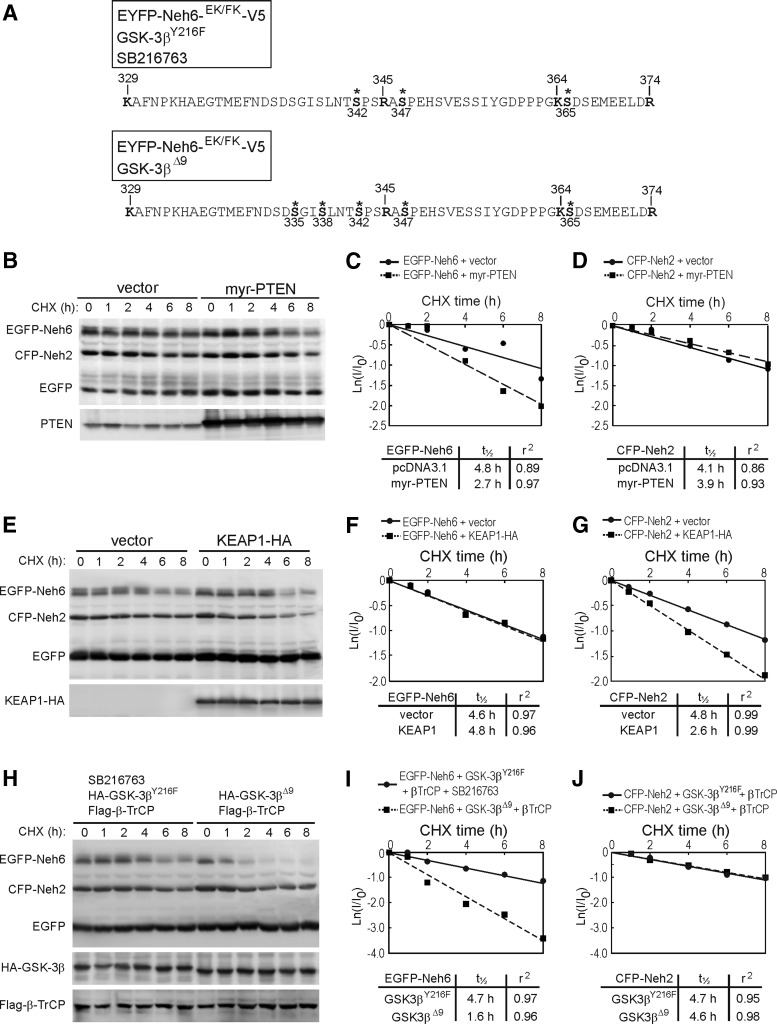
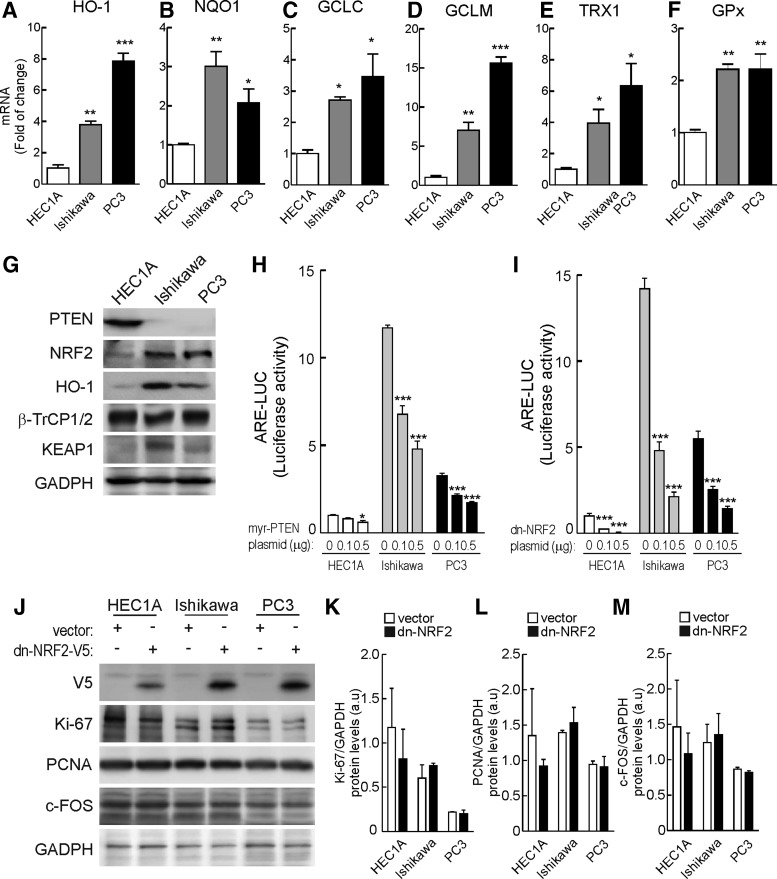
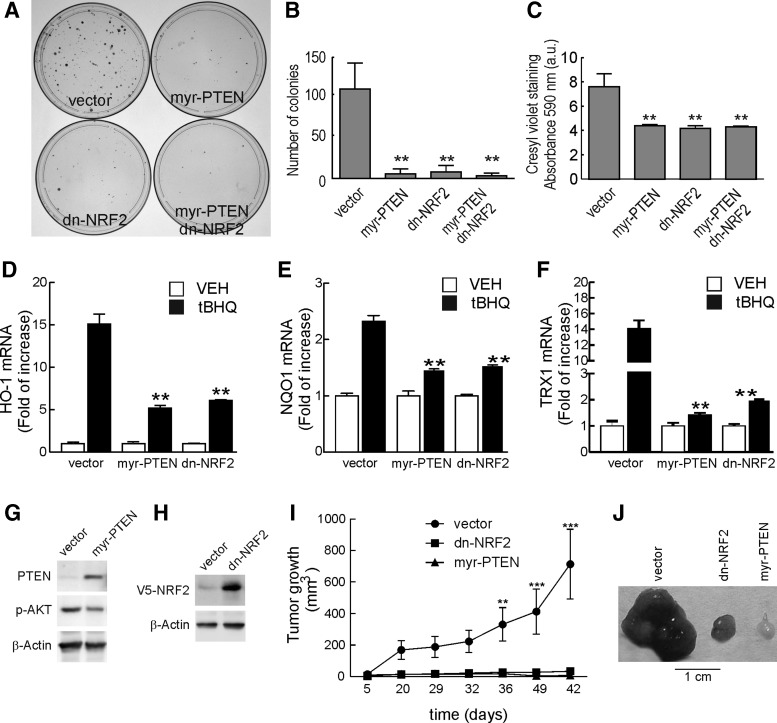
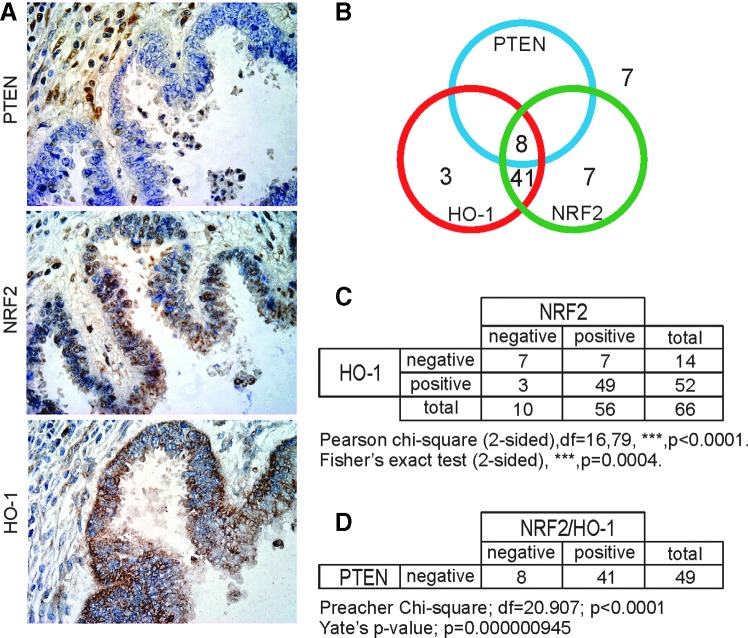
Results: Drug and genetic targeting to PTEN and phosphoproteomics approaches indicated that PTEN leads to glycogen synthase kinase-3 (GSK-3)-mediated phosphorylation of NRF2 at residues Ser(335) and Ser(338) and subsequent beta-transducin repeat containing protein (β-TrCP)-dependent but Kelch-like ECH-associated protein 1 (KEAP1)-independent degradation. Rescue experiments in PTEN-deficient cells and xerographs in athymic mice indicated that loss of PTEN leads to increased NRF2 signature which provides a proliferating and tumorigenic advantage. Tissue microarrays from endometrioid carcinomas showed that 80% of PTEN-negative tumors expressed high levels of NRF2 or its target heme oxygenase-1 (HO-1).

Innovation: These results uncover a new mechanism of oncogenic activation of NRF2 by loss of its negative regulation by PTEN/GSK-3/β-TrCP that may be relevant to a large number of tumors, including endometrioid carcinomas.

Conclusion: Increased activity of NRF2 due to loss of PTEN is instrumental in human carcinogenesis and represents a novel therapeutic target.


Figures

<b>FIG. 1.</b>
FIG. 1.
tBHQ regulates AKT/GSK-3β activity and increases NRF2 and HO-1 in a KEAP1-independent manner. MEFs from wild-type (Keap1+/+) or KEAP1-deficient (Keap1/) littermates were maintained in low-serum for 16 h, and then treated with LY294002 (30 μM) or DMSO as vehicle for 15 min before the tBHQ treatment (10 μM). (A, B) Immunoblots with specific antibodies as indicated in the panels. (C, D) Densitometric analysis of p-AKT and p-GSK-3β protein levels of representative blots from (A, B). (E, F) Immunoblots with specific antibodies as indicated in the panels. (G, H) Densitometric analysis of NRF2 and HO-1 protein levels from representative blots from (E, F). For (C, D) and (G, H), data are mean±SEM (n=3). Statistical analysis was performed with two-way ANOVA followed by Bonferroni post-hoc test. *p<0.05, **p<0.01, and ***p<0.001 versus the group at 0 min. ANOVA, analysis of variance; GSK-3, glycogen synthase kinase-3; KEAP1, Kelch-like ECH-associated protein 1; MEFs, mouse embryonic fibroblasts; NRF2, nuclear factor (erythroid-derived 2)-like 2; tBHQ, tert-buthylhydroquinone.
<b>FIG. 2.</b>
FIG. 2.
Pharmacological inhibition of PTEN induces the NRF2 signature. (A) In vitro phosphatase assay with immunocomplexes from HEK293T cells transfected with HA-tagged PTEN. After 24 h from transfection, HA-PTEN was immunoprecipitated using anti-HA antibody. Inmunocomplexes were treated in vitro with the indicated concentrations of tBHQ or vehicle (DMSO, 0.01%) and then submitted to an in vitro phosphatase assay. Graph depicts PTEN activity as free phosphate measured by malachite green assay. Data indicate mean±SEM (n=3). Statistical analysis was performed with one-way ANOVA followed by Newman–Keuls multiple-comparison test. *p<0.05 versus the vehicle-treated group. (B) tBHQ and tBQ induce oxidant modification of PTEN. HEK293T cells were treated for 2 h with the indicated concentrations of tBHQ, tBQ, or 2 mM hydrogen peroxide as control. Cell extracts were prepared in lysis buffer containing 50 mM N-ethylmaleimide (LB-NEM) or 2 mM β-mecaptoethanol (LB-β-ME) and resolved in 10% SDS-PAGE. Empty and filled arrowheads point the respective reduced and the oxidized forms of PTEN after treatments. (C) Time-dependent effect of PTEN inhibition on the NRF2 signature. Keap1+/+ and Keap1/ MEFs were treated with 3 μM bpV(HOpic) for the indicated time points. Whole-protein lysates were then immunoblotted with specific antibodies as indicated in the panels. (D) Dose-dependent effect of PTEN inhibition on NRF2 signature. Keap1+/+ and Keap1/ MEFs were treated with the indicated concentrations of bpV(HOpic) for 6 h. (E–H) Densitometric analysis of NRF2, HO-1, NQO1, and p-AKT protein levels of representative blots from (C). (I–L), Keap1+/+ and Keap1/ MEFs were treated for 6 h with the indicated doses of bpV(HOpic). The mRNA levels of Hmox1, Nqo1, Gclc, and Gclm were determined by qRT-PCR and normalized by β-Actin levels. Data are mean±SEM (n=3). Statistical analysis was performed with one-way ANOVA followed by Newman–Keuls multiple-comparison test. *p<0.05; **p<0.01 points Keap1+/+ MEFs versus groups at 0 min. #p<0.05; ##p<0.01 points Keap1/ MEFs versus groups at 0 min. bpV(HOpic), dipotassium bisperoxo (5-hydroxypyridine-2-carboxyl) oxovanadate; NQO1, NAD(P)H quinone oxidoreductase 1; PTEN, phosphatase and tensin homolog deleted on chromosome 10; qRT-PCR, quantitative reverse transcriptase-polymerase chain reaction; SDS-PAGE, sodium dodecyl sulfate polyacrylamide gel electrophoresis; tBQ, tert-butylbenzoquinone.
<b>FIG. 3.</b>
FIG. 3.
MEFs from PTENtg mice exhibit impaired activation of NRF2 in response to tBHQ. (A) PTEN protein levels in MEFs from PTENwt and PTENtg transgenic mice. Each lane corresponds to MEFs prepared from different mice. (B) Densitometric quantification of representative blots from (A). (C) Determination of PTEN mRNA levels by qRT-PCR. Data are mean±SEM (n=3). Statistical analysis was performed with a Student's t-test. *p<0.05 versus PTENwt MEFs. (D) Immunoblots of PTENwt and PTENtg MEFs treated with 10 μM of tBHQ for 6 h. (E–H) densitometric quantification of NRF2, HO-1, p-AKT, and p-GSK-3β protein levels of representative blots from (D). (I–L) mRNA levels of Hmox1, Nqo1, Gclc, and Gclm were determined by qRT-PCR and normalized by β-Actin levels. Data are mean±SEM (n=3). Statistical analysis was performed with two-way ANOVA followed by Bonferroni post-hoc test. *p<0.05; **p<0.01; and ***p<0.001 versus PTENwt MEFs.
<b>FIG. 4.</b>
FIG. 4.
Rescue of PTEN expression restrains NRF2 activation. (A) The KEAP1/NRF2 axis is functional in prostate carcinoma PC-3 cells. PC-3 cells were maintained in low-serum medium for 16 h and then submitted to tBHQ, sulforaphane (SFN), or MG132 (30 μM) as control, for 6 h. Whole-protein lysates were then immunoblotted with specific antibodies as indicated in the panels. As a negative control for KEAP1 expression, we introduced one lane from human A549 cells that are deficient in KEAP1. The anti-human NRF2 antibody recognizes a strong unspecific band just below NRF2. The arrowhead points to the NRF2 band (apparent MW of 110 kDa). (B) PC-3 cells were co-transfected with ARE-LUC, pTK-Renilla as control vector, and PI3K-CAAX plus either empty vector or expression vector for wild-type HA-PTEN. (C) PC-3 cells were transfected as in (B) but with increasing amounts of HA-PTEND92A/C124A or wild-type HA-PTEN, as indicated. For (B, C), after 24 h, luciferase activity was determined. Data are mean±SEM (n=3). Statistical analysis was performed with one-way ANOVA followed by Newman–Keuls multiple-comparison test. **p<0.01 versus groups at the same concentration points. (D) PC-3 cells were co-transfected with ARE-LUC, pTK-Renilla as control vector, and either wild-type HA-PTEN or active myr-PTEN. After transfection, cells were maintained in low-serum conditions supplemented with 3 μM tBHQ. After 16 h, luciferase activity was determined. Data are mean±SEM (n=6). Statistical analysis was performed with one-way ANOVA followed by Newman–Keuls multiple-comparison test. *p<0.05 versus PC-3-pcDNA3.1 treated with tBHQ. (E–H) PC-3 cells were transiently transfected with empty vector (pcDNA3.1), wild-type HA-PTEN, or myr-PTEN. After 16 h in low-serum medium, mRNA levels of HMOX1, NQO1, GCLC, and GCLM were determined by qRT-PCR. Data are mean±SEM (n=3). Statistical analysis was performed with one-way ANOVA followed by Newman–Keuls multiple-comparison test. *p<0.05; ***p<0.001 versus PC-3-pcDNA3.1 treated with tBHQ. (I) scheme showing the regulation of myr-PTEN-ER* by 4-HT. (J) induction of myr-PTEN-ER* activity by 1 μM 4-HT as determined by time-dependent reduction of p-AKT levels. (K) PC-3 cells were transiently transfected with myr-PTEN-ER*. After 16 h, cells were preincubated with 4-HT for 1 h and then submitted to tBHQ (15 μM) for the indicated time points. Arrowhead points to the NRF2 band (apparent MW of 110 kDa). (L, M) Densitometric quantification of NRF2 and HO-1 protein levels in representative blots from (K). Data are mean±SEM. Statistical analysis was performed with two-way ANOVA followed by Bonferroni post-hoc test. *p<0.05; **p<0.01 versus tBHQ-treated PC3 cells. 4-HT, 4-hydroxytamoxifen; ARE, antioxidant response element; PI3K, phosphatidylinositol 3 kinase; MW, molecular weight.
<b>FIG. 5.</b>
FIG. 5.
PTEN targets the Neh6 degradation domain of NRF2. (A) GSK-3β phosphorylates NRF2 at Ser335 and Ser338. HEK293T were transfected with fusion protein EYFP-Neh6EK/FK-V5 under conditions of GSK-3 inhibition (co-transfection of hypomorphic GSK-3βY216 mutant plus incubation with 10 μM SB216763) and activation (co-transfection of active GSK-3βΔ9). MG132 (30 μM) was added to prevent protein degradation. Mass spectrometry analysis identified five phosphorylated Ser residues at positions 335, 338, 342, 347, and 365 (indicated by *) but phosphorylation of Ser335 and Ser338 was found only under conditions of GSK-3 stimulation. Annotated mass spectra of the identified phosphorylated peptides are provided in Supplementary Tables S3–S12. (B) PTEN induces the degradation of NRF2 at the level of its Neh6 phosphodegron. HEK293T cells were co-transfected with expression vectors for CFP-Neh2, EGFP-Neh6, EGFP, and either empty vector or myr-PTEN. Then, cells were maintained in low-serum for 16 h and pulse-chased with 100 μg/ml CHX. Whole-protein lysates were immunoblotted with anti-GFP antibody (upper blot) or anti-PTEN antibody (lower blot) showing over-expression of myr-PTEN. (C, D) Determination of half lives. Graphs depict the natural logarithm of the relative protein levels of the indicated proteins as a function of CHX chase time. Protein half life was determined using the linear part of the degradation curves. (E) CFP-Neh2 but not EGFP-Neh6 is modulated by KEAP1. HEK293T cells were co-transfected with expression vectors for CFP-Neh2, EGFP-Neh6, and EGFP and either vector or HA-tagged KEAP-1. Then, the cells were maintained in low-serum medium for 16 h and pulse-chased with 100 μg/ml CHX at the indicated time points. (F, G) Determination of half lives. (H) EGFP-Neh6 but not CFP-Neh2 is modulated by GSK-3β/β-TrCP. HEK293T cells were co-transfected with expression vectors for CFP-Neh2, EGFP-Neh6, EGFP, Flag-β-TrCP, and either HA-tagged GSK-3βY216F (hypomorphic version of GSK-3β that retains only residual activity, plus incubation in 10 μM SB216763) or GSK-3βΔ9 (constitutively active version) and pulse-chased with CHX. (I, J) Determination of half lives. β-TrCP, beta-transducin repeat containing protein; CFP, cyan fluorescent protein; CHX, cycloheximide; EGFP, enhanced green fluorescent protein; EYFP, enhanced yellow fluorescent protein.
<b>FIG. 6.</b>
FIG. 6.
PTEN deficiency increases the NRF2-signature. (A) After 16 h in low-serum medium, whole-cell lysates from HEC1A (endometrial tumor cell line expressing wild-type PTEN), Ishikawa (endometrial tumor cell line null for PTEN expression), or PC-3 (prostate tumor cell line null for PTEN expression) were immunoblotted with the indicated antibodies. (B–G) mRNA levels of HMOX1, NQO1, GCLC, GCLM, TRX1, and GPX were determined by qRT-PCR. Data are mean±SEM (n=3). Statistical analysis was performed with one-way ANOVA followed by Newman–Keuls multiple-comparison test. *p<0.05; **p<0.01; and ***p<0.001 versus HEC1A cells. (H, I) HEC1A, Ishikawa, and PC-3 cells were co-transfected with ARE-LUC, pTK-Renilla as control vector, and increasing amounts of myr-PTEN or dn-NRF2 as indicated. After 24 h, luciferase activity was determined. Data are mean±SEM (n=3). Statistical analyses were performed with two-way ANOVA followed by Bonferroni post-hoc test. *p<0.05; **p<0.01; ***and p<0.001 versus control cells. (J) HEC1A, Ishikawa, and PC-3 were transfected with dn-NRF2-V5 plasmid. After 24 h, whole-cell lysates were immunoblotted with specific antibodies as indicated in the panels. (K–M) Densitometric quantification of Ki-67, PCNA, and c-FOS protein levels, respectively, of representative blots from (J). Data are mean±SEM. TRX1, thioredoxin reductase 1.
<b>FIG. 7.</b>
FIG. 7.
NRF2 inhibition or restoration of PTEN expression reduces the tumorigenic capacity of PC-3 cells. (A) PC-3 cells were transfected with pcDNA3.1 (vector), myr-PTEN, or dn-NRF2-V5, as indicated. After 24 h from transfection, cells were treated for 4 weeks with 0.5 mg/ml of G418. Then, plates were fixed and stained with cresyl violet solution. The plates shown are representative of three different experiments. (B) Number of stained colonies. (C) Densitometric quantification of crystal violet staining at λ=590 nm. Data are mean±SEM (n=3). Statistical analysis was performed with one-way ANOVA followed by Newman–Keuls multiple-comparison test. **p<0.01 versus PC-3-pcDNA3.1. (D–F) Characterization of NRF2 signature in PC-3 stably transfected cell lines. PC-3-pcDNA3.1, PC-3-myr-PTEN, and PC-3-dn-NRF2 were maintained in low-serum medium. After 16 h, cells were treated with tBHQ (10 μM) for 6 h and mRNA levels of HMOX1, NQO1, and TRX1 were determined by qRT-PCR and normalized by β-Actin. Data are mean±SEM (n=3). Statistical analysis was performed with one-way ANOVA followed by Newman–Keuls multiple-comparison test. **p<0.01 versus PC-3-pcDNA3.1 treated with tBHQ. (G) Whole-protein lysates from PC-3 stably transfected with pcDNA3.1 (vector) or myr-PTEN were immunoblotted with specific antibodies as indicated in the panels. (H) Whole-protein lysates from PC-3 stably transfected with pcDNA3.1 (vector) or dn-NRF2-V5 were immunoblotted with specific antibodies as indicated in the panels. (I) 3x10⁶ of PC-3 pcDNA3.1, PC-3-myr-PTEN, or PC-3-dnNRF2 cells were resuspended in 100 μl of PBS and transplanted subcutaneously into the left flank of the mouse. Tumor volume was measured twice at week. Data are mean±SEM (n=8). Statistical analysis was performed with two-way ANOVA followed by Bonferroni post-hoc test. **p<0.01; ***p<0.001 versus PC-3-pcDNA3.1. (J) Representative tumors from PC-3 pcDNA3.1, PC-3-myr-PTEN, and PC-3-dnNRF2 removed after 42 days from injection. PBS, phosphate-buffered saline.
<b>FIG. 8.</b>
FIG. 8.
PTEN deficiency correlates with elevated NRF2 and HO-1 protein levels in human endometrioid tumors. (A) Immunohistochemistry performed in 4-μm-thick sections of human endometrial tumor. (B) Venn diagram showing evaluation and quantification of PTEN, NRF2, and HO-1 expression in tissue microarrays from 66 tumors of a cohort of patients with endometrioid cancer. (C) Contingency analysis of NRF2 and HO-1 expression in the 66 tumors using Pearson chi-square test followed by Fisher exact test in 66 patients. Pearson chi-square analysis indicates a statistical difference between observed distribution of NRF2 and HO-1 with a Fisher's p-value of 0.0004. (D) Analysis of PTEN expression in the 49 tumors that were positive for NRF2 and HO-1 determined in (C). Preacher's chi-square analysis indicates a statistical difference between observed distribution of NRF2 and HO-1 in the PTEN-negative tumors and the expected fair distribution with a Yate's, p-value of 9.4e-7. To see this illustration in color, the reader is referred to the web version of this article at www.liebertpub.com/ars

Similar articles

Cited by

References

    1. Almazari I, Park JM, Park SA, Suh JY, Na HK, Cha YN, Surh YJ. Guggulsterone induces heme oxygenase-1 expression through activation of Nrf2 in human mammary epithelial cells: PTEN as a putative target. Carcinogenesis 33: 368–376, 2012 - PubMed
    1. Cancer Genome Atlas Research Network. Comprehensive genomic characterization of squamous cell lung cancers. Nature 489: 519–525, 2012 - PMC - PubMed
    1. Chorley BN, Campbell MR, Wang X, Karaca M, Sambandan D, Bangura F, Xue P, Pi J, Kleeberger SR, and Bell DA. Identification of novel NRF2-regulated genes by ChIP-Seq: influence on retinoid X receptor alpha. Nucleic Acids Res 40: 7416–7429, 2012 - PMC - PubMed
    1. DeNicola GM, Karreth FA, Humpton TJ, Gopinathan A, Wei C, Frese K, Mangal D, Yu KH, Yeo CJ, Calhoun ES, Scrimieri F, Winter JM, Hruban RH, Iacobuzio-Donahue C, Kern SE, Blair IA, and Tuveson DA. Oncogene-induced Nrf2 transcription promotes ROS detoxification and tumorigenesis. Nature 475: 106–109, 2011 - PMC - PubMed
    1. Dinkova-Kostova AT, and Wang XJ. Induction of the Keap1/Nrf2/ARE pathway by oxidizable diphenols. Chem Biol Interact 192: 101–106, 2011 - PubMed

Publication types

LinkOut - more resources