

Four-and-one-half years' experience in monitoring of reproducibility of an MR spectroscopy system--application of in vitro results to interpretation of in vivo data
- PMID: 24892353
- PMCID: PMC5711050
- DOI: 10.1120/jacmp.v15i3.4754
Four-and-one-half years' experience in monitoring of reproducibility of an MR spectroscopy system--application of in vitro results to interpretation of in vivo data
Abstract
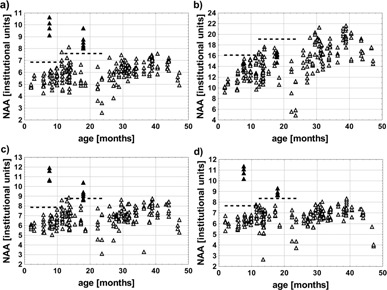
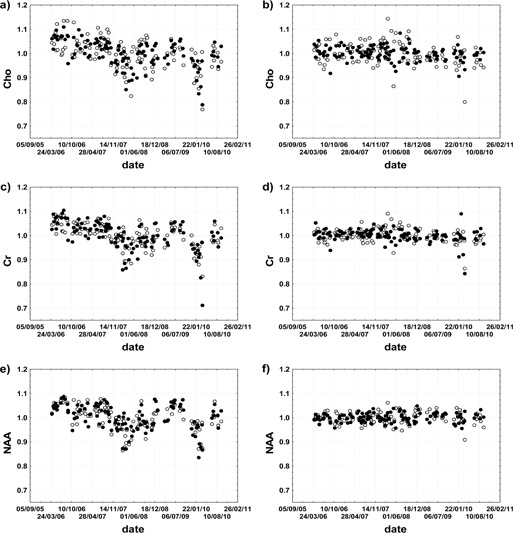
The primary purpose of this work was to assess long-term in vitro reproducibility of metabolite levels measured using 1H MRS (proton magnetic resonance spectroscopy). The secondary purpose was to use the in vitro results for interpretation of 1H MRS in vivo spectra acquired from patients diagnosed with Canavan disease. 1H MRS measurements were performed in the period from April 2006 to September 2010. 118 short and 116 long echo spectra were acquired from a stable phantom during this period. Change-point analysis of the in vitro N-acetylaspartate levels was exploited in the computation of fT factor (ratio of the actual to the reference N-acetylaspartate level normalized by the reciprocity principle). This coefficient was utilized in the interpretation of in vivo spectra analyzed using absolute reference technique. The monitored time period was divided into six time intervals based on short echo in vitro data (seven time intervals based on long echo in vitro data) characterized by fT coefficient ranging from 0.97 to 1.09 (based on short echo data) and from 1.0 to 1.11 (based on long echo data). Application of this coefficient to interpretation of in vivo spectra confirmed increased N-acetylaspartate level in Canavan disease. Long-term monitoring of an MRS system reproducibility, allowing for absolute referencing of metabolite levels, facilitates interpretation of metabolic changes in white matter disorders.
Figures
Similar articles
-
Correlation of fractional anisotropy and metabolite concentrations measured using 1H-MRS of cerebral white matter in healthy adults.Biomed Mater Eng. 2014;24(6):3017-24. doi: 10.3233/BME-141122. Biomed Mater Eng. 2014. PMID: 25227009
-
In vivo quantitation of cerebral metabolite concentrations using natural abundance 13C MRS at 1.5 T.J Magn Reson. 1999 Feb;136(2):219-25. doi: 10.1006/jmre.1998.1618. J Magn Reson. 1999. PMID: 9986765
-
Magnetic resonance imaging in juvenile Canavan disease.Eur J Pediatr. 1993 Sep;152(9):750-3. doi: 10.1007/BF01953994. Eur J Pediatr. 1993. PMID: 8223809
-
Natural history of Canavan disease revealed by proton magnetic resonance spectroscopy (1H-MRS) and diffusion-weighted MRI.Neuropediatrics. 2006 Aug;37(4):209-21. doi: 10.1055/s-2006-924734. Neuropediatrics. 2006. PMID: 17177147
-
Canavan disease: a review of recent developments.Eur J Paediatr Neurol. 2001;5(2):65-9. doi: 10.1053/ejpn.2001.0467. Eur J Paediatr Neurol. 2001. PMID: 11589315 Review.
Cited by
-
NMR Spectroscopy in Diagnosis and Monitoring of Methylmalonic and Propionic Acidemias.Biomolecules. 2024 Apr 28;14(5):528. doi: 10.3390/biom14050528. Biomolecules. 2024. PMID: 38785935 Free PMC article. Review.
-
Whole Brain and Cranial Size Adjustments in Volumetric Brain Analyses of Sex- and Age-Related Trends.Front Neurosci. 2020 Apr 3;14:278. doi: 10.3389/fnins.2020.00278. eCollection 2020. Front Neurosci. 2020. PMID: 32317915 Free PMC article.
-
The Value of 1H-MRS and MRI in Combined Methylmalonic Aciduria and Homocystinuria.J Comput Assist Tomogr. 2019 Jul/Aug;43(4):559-562. doi: 10.1097/RCT.0000000000000854. J Comput Assist Tomogr. 2019. PMID: 30839328 Free PMC article.
-
Quality Control Procedure Based on Partitioning of NMR Time Series.Sensors (Basel). 2018 Mar 6;18(3):792. doi: 10.3390/s18030792. Sensors (Basel). 2018. PMID: 29509681 Free PMC article.
References
-
- Skorupa A, Jamroz E, Paprocka J, Sokól M, Wicher M, Kieltyka A. Bridging the gap between metabolic profile determination and visualization in neurometabolic disorders: a multivariate analysis of proton magnetic resonance in vivo spectra. J Chemometrics. 2013;27(3‐4):76–90.
-
- Keevil SF, Barbiroli B, Brooks JC, et al. Absolute metabolite quantification by in vivo NMR spectroscopy: II. A multicentre trial of protocols for in vivo localised proton studies of human brain. Magn Reson Imaging. 1998;16(9):1093–106. - PubMed
-
- Christiansen P, Henriksen O, Stubgaard M, Gideon P, Larsson HB. In vivo quantification of brain metabolites by 1H‐MRS using water as an internal standard. Magn Reson Imaging. 1993;11(1):107–18. - PubMed
-
- Brooks WM, Wesley MH, Kodituwakku PW, Garry PJ, Rosenberg GA. 1H‐MRS differentiates white matter hyperintensities in subcortical arteriosclerotic encephalopathy from those in normal elderly. Stroke. 1997;28(10):1940–43. - PubMed
Publication types
MeSH terms
Substances
LinkOut - more resources
Full Text Sources
Other Literature Sources
Medical
Miscellaneous
