

Optimization of SERS tag intensity, binding footprint, and emittance
- PMID: 24892497
- PMCID: PMC4215889
- DOI: 10.1021/bc5000252
Optimization of SERS tag intensity, binding footprint, and emittance
Abstract
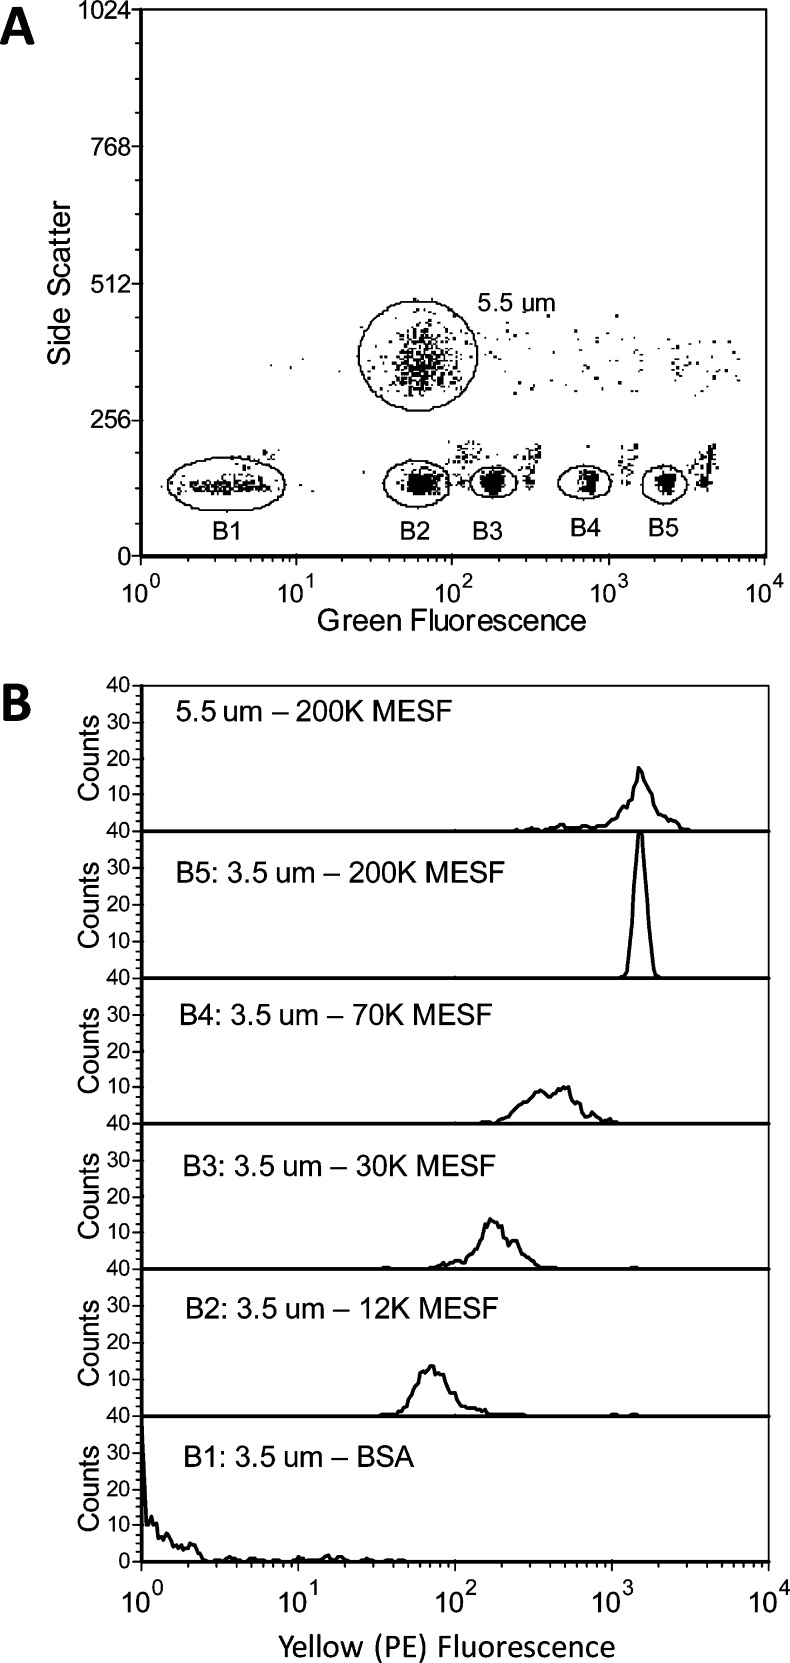
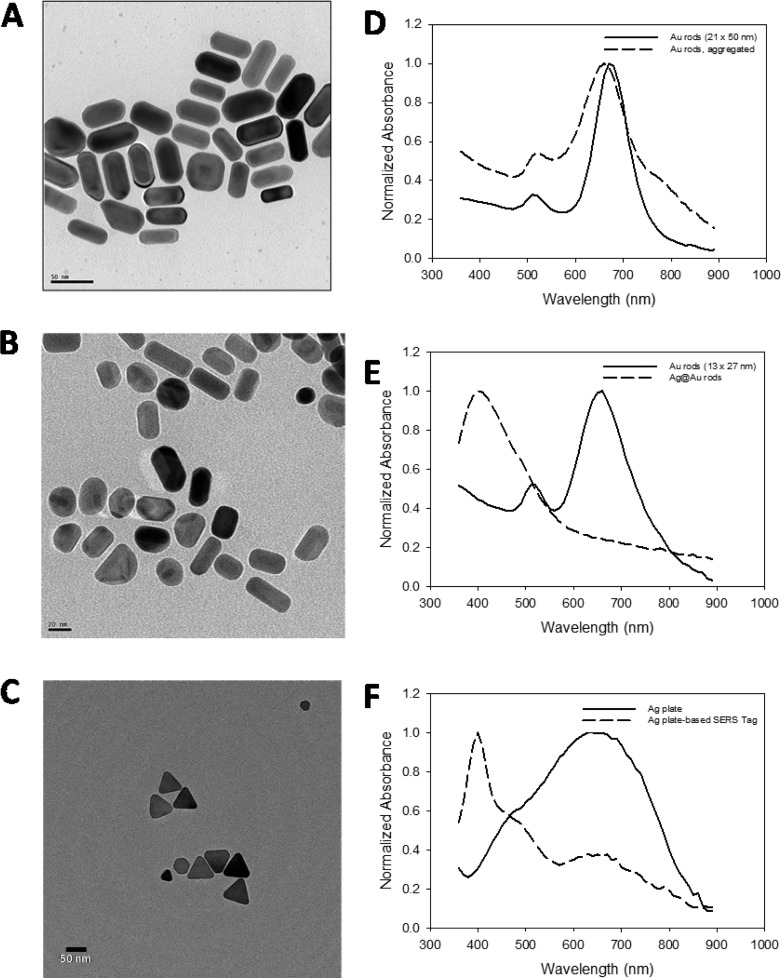
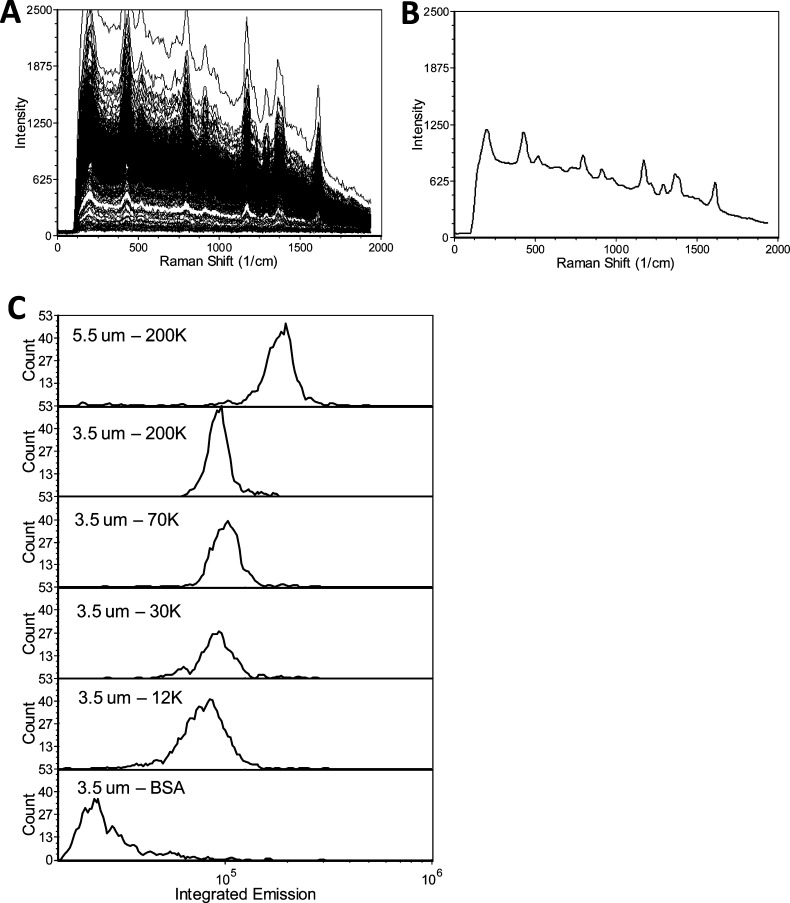
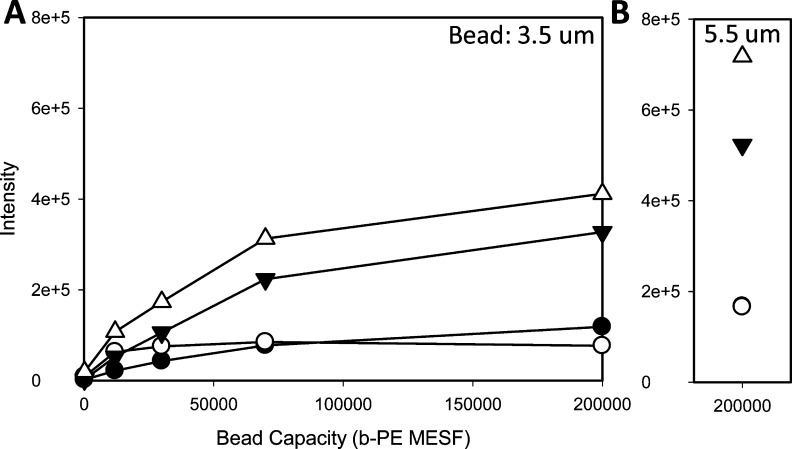
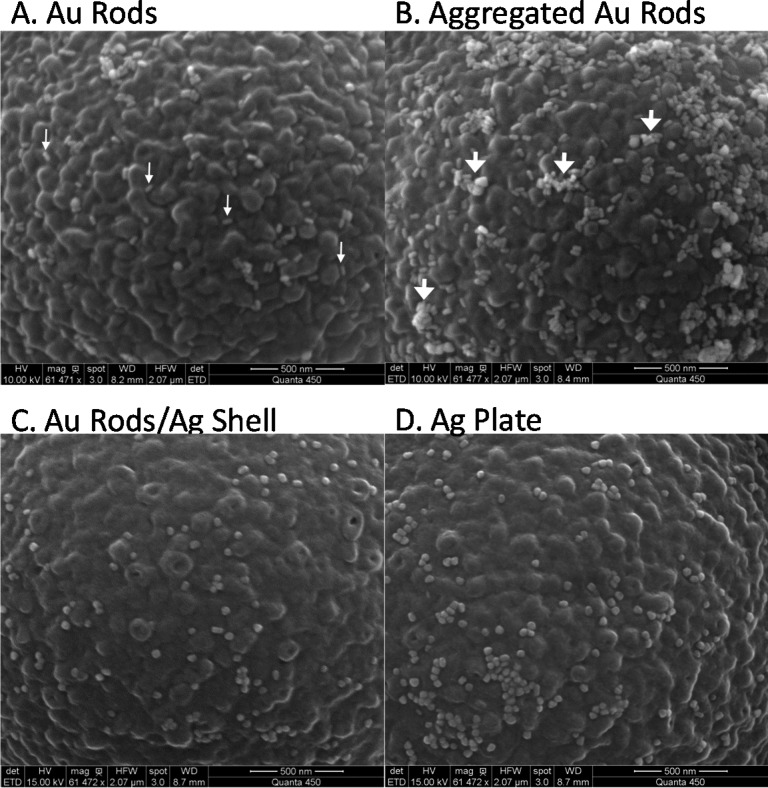
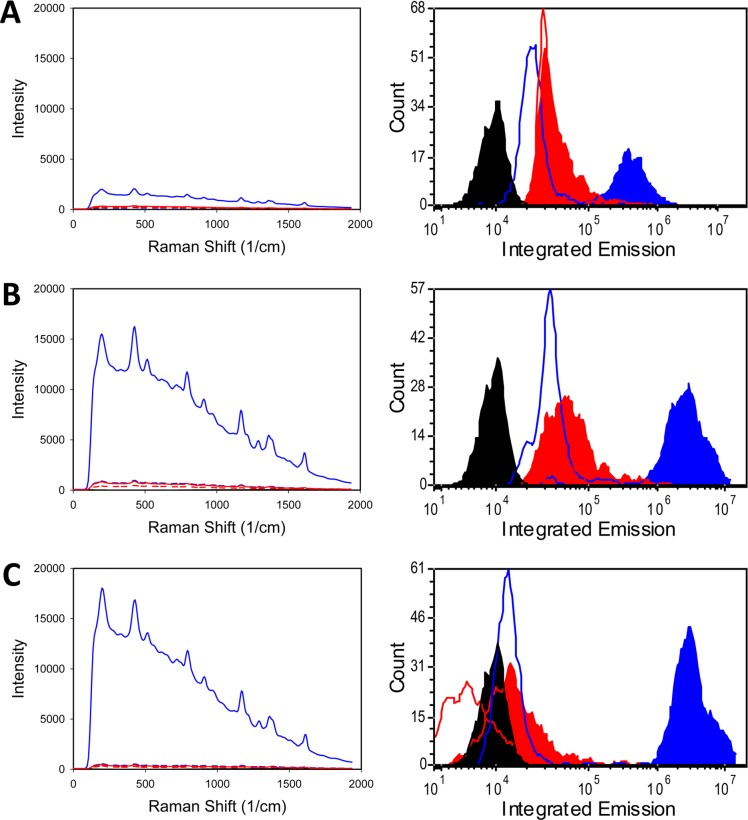
Nanoparticle surface enhanced Raman scattering (SERS) tags have attracted interest as labels for use in a variety of applications, including biomolecular assays. An obstacle to progress in this area is a lack of standardized approaches to compare the brightness of different SERS tags within and between laboratories. Here we present an approach based on binding of SERS tags to beads with known binding capacities that allows evaluation of the average intensity, the relative binding footprint of particles in a SERS tag preparation, and the size-normalized intensity or emittance. We tested this on four different SERS tag compositions and show that aggregated gold nanorods produce SERS tags that are 2-4 times brighter than relatively more monodisperse nanorods, but that the aggregated nanorods are also correspondingly larger, which may negate the intensity if steric hindrance limits the number of tags bound to a target. By contrast, SERS tags prepared from smaller gold nanorods coated with a silver shell produce SERS tags that are 2-3 times brighter, on a size-normalized basis, than the Au nanorod-based tags, resulting in labels with improved performance in SERS-based image and flow cytometry assays. SERS tags based on red-resonant Ag plates showed similarly bright signals and small footprint. This approach to evaluating SERS tag brightness is general, uses readily available reagents and instruments, and should be suitable for interlab comparisons of SERS tag brightness.
Figures
Similar articles
-
Single cell analysis using surface enhanced Raman scattering (SERS) tags.Methods. 2012 Jul;57(3):272-9. doi: 10.1016/j.ymeth.2012.03.024. Epub 2012 Apr 4. Methods. 2012. PMID: 22498143 Free PMC article. Review.
-
Localized surface plasmon resonance and surface enhanced Raman scattering responses of Au@Ag core-shell nanorods with different thickness of Ag shell.J Nanosci Nanotechnol. 2014 Jun;14(6):4245-50. doi: 10.1166/jnn.2014.8202. J Nanosci Nanotechnol. 2014. PMID: 24738378
-
Bull serum albumin coated Au@Agnanorods as SERS probes for ultrasensitive osteosarcoma cell detection.Talanta. 2016 Apr 1;150:503-9. doi: 10.1016/j.talanta.2015.12.065. Epub 2015 Dec 25. Talanta. 2016. PMID: 26838436
-
Double Detection of Mycotoxins Based on SERS Labels Embedded Ag@Au Core-Shell Nanoparticles.ACS Appl Mater Interfaces. 2015 Oct 7;7(39):21780-6. doi: 10.1021/acsami.5b07804. Epub 2015 Sep 28. ACS Appl Mater Interfaces. 2015. PMID: 26381109
-
Gap-enhanced Raman tags: fabrication, optical properties, and theranostic applications.Theranostics. 2020 Jan 12;10(5):2067-2094. doi: 10.7150/thno.39968. eCollection 2020. Theranostics. 2020. PMID: 32089735 Free PMC article. Review.
Cited by
-
Multiplexed TEM Specimen Preparation and Analysis of Plasmonic Nanoparticles.Microsc Microanal. 2015 Aug;21(4):1017-1025. doi: 10.1017/S1431927615014324. Microsc Microanal. 2015. PMID: 26223550 Free PMC article.
-
Diagnostic prospects and preclinical development of optical technologies using gold nanostructure contrast agents to boost endogenous tissue contrast.Chem Sci. 2020 Jul 14;11(33):8671-8685. doi: 10.1039/d0sc01926g. Chem Sci. 2020. PMID: 34123125 Free PMC article. Review.
-
Design and Simple Assembly of Gold Nanostar Bioconjugates for Surface-Enhanced Raman Spectroscopy Immunoassays.Nanomaterials (Basel). 2019 Nov 4;9(11):1561. doi: 10.3390/nano9111561. Nanomaterials (Basel). 2019. PMID: 31689919 Free PMC article.
References
-
- Jeanmaire D. L.; Van Duyne R. P. (1977) Surface raman spectroelectrochemistry:: Part I. Heterocyclic, aromatic, and aliphatic amines adsorbed on the anodized silver electrode. J. Electroanal. Chem. Interfacial Electrochem. 84, 1–20.
-
- Moskovits M. (1985) Surface-enhanced spectroscopy. Rev. Mod. Phys. 57, 783–826.
-
- Nie S.; Emory S. R. (1997) Probing single molecules and single nanoparticles by surface-enhanced raman scattering. Science 275, 1102–1106. - PubMed
-
- Alvarez-Puebla R. A.; Liz-Marzán L. M. (2010) SERS-based diagnosis and biodetection. Small 6, 604–610. - PubMed
-
- Porter M. D.; Lipert R. J.; Siperko L. M.; Wang G.; Narayanan R. (2008) SERS as a bioassay platform: fundamentals, design, and applications. Chem. Soc. Rev. 37, 1001–1011. - PubMed
Publication types
MeSH terms
Substances
Grants and funding
LinkOut - more resources
Full Text Sources
Other Literature Sources
Medical
Molecular Biology Databases
Miscellaneous
