. 2014 Jul;124(7):3200-14.
doi: 10.1172/JCI68901. Epub 2014 Jun 2.

NOTCH inhibits osteoblast formation in inflammatory arthritis via noncanonical NF-κB

NOTCH inhibits osteoblast formation in inflammatory arthritis via noncanonical NF-κB

Hengwei Zhang et al. J Clin Invest. 2014 Jul.

Abstract

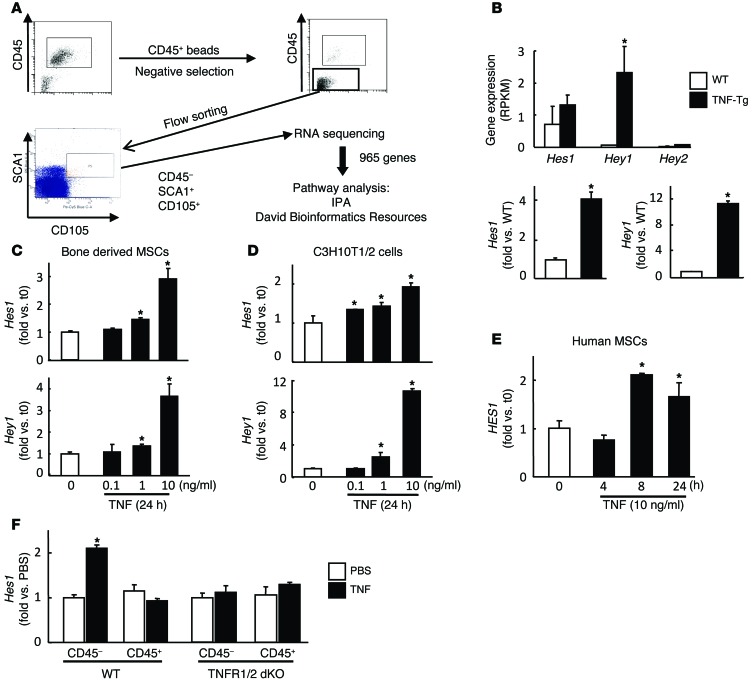
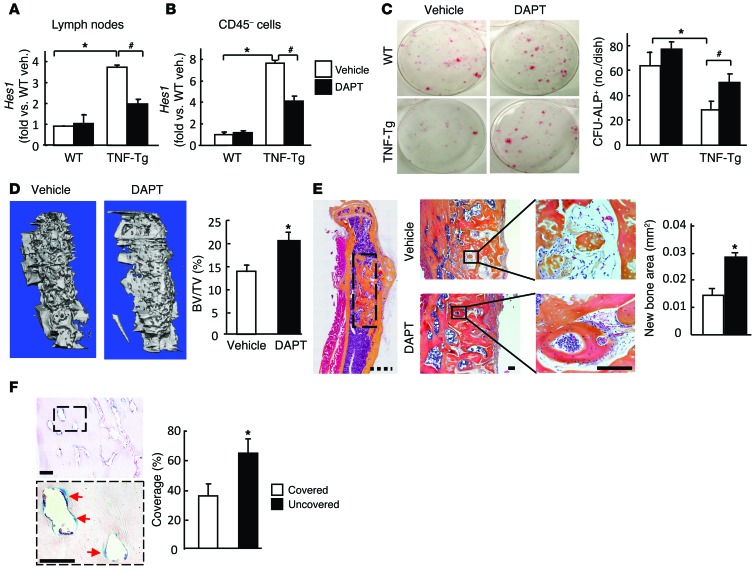
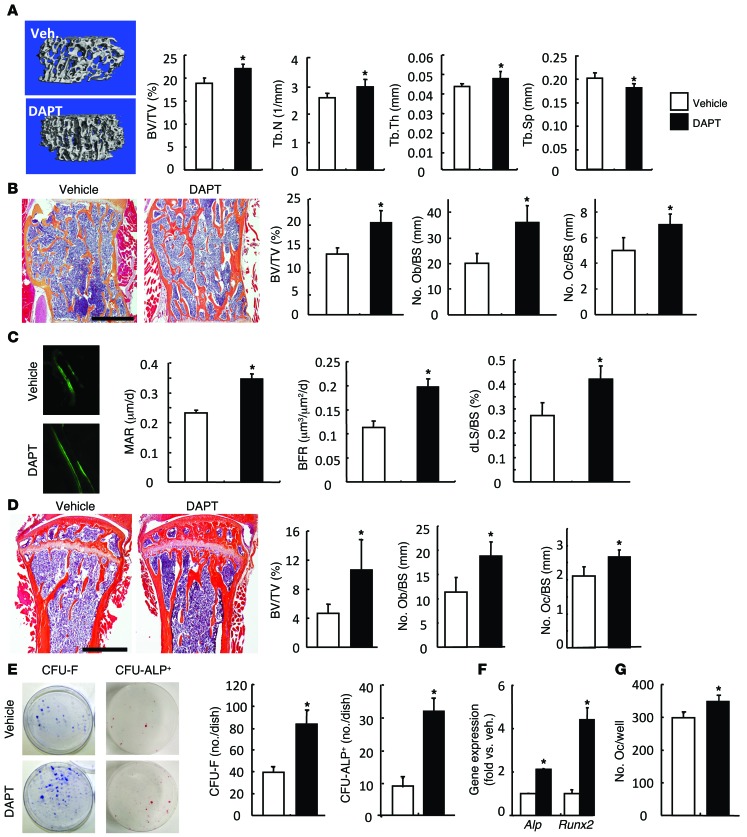
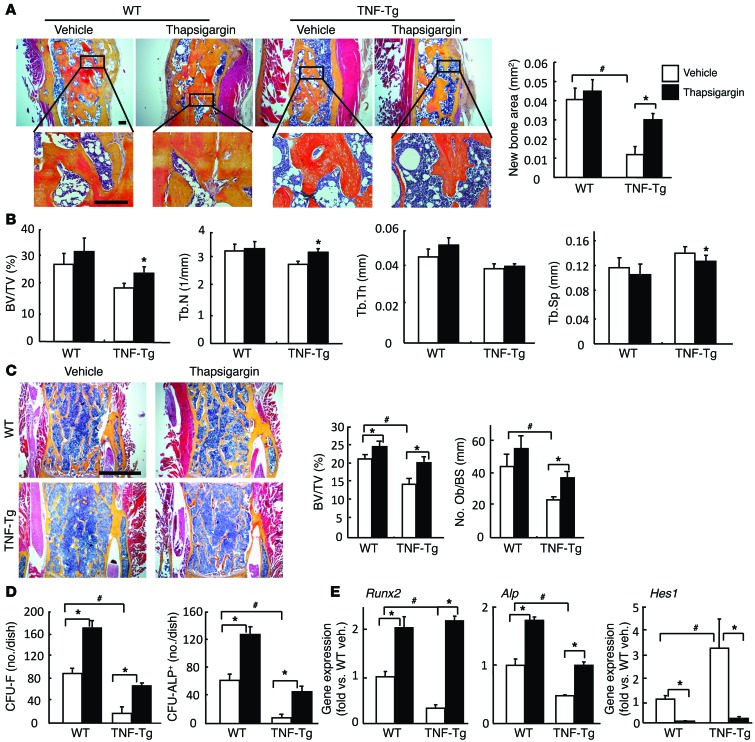
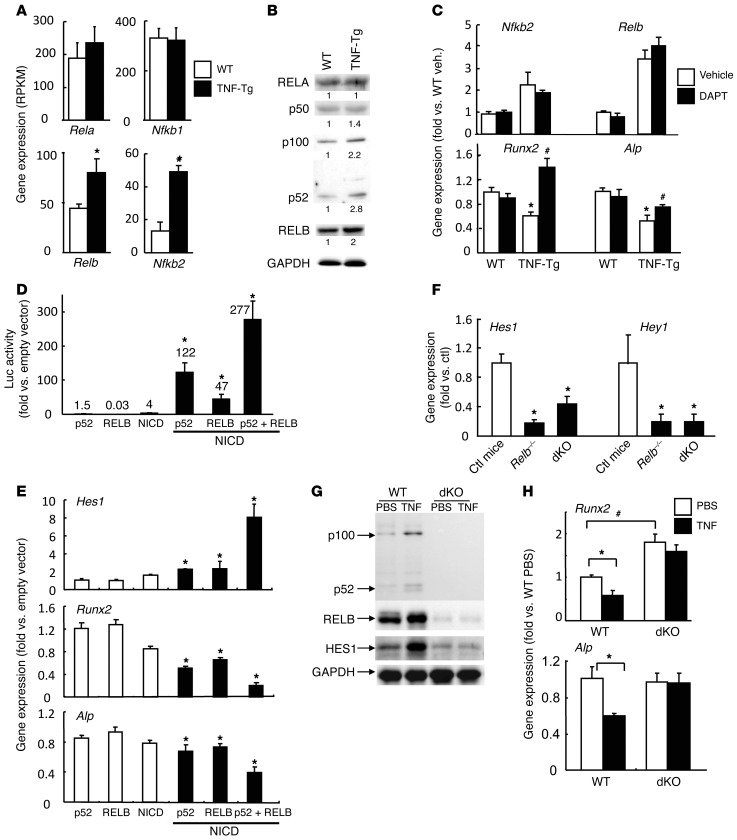
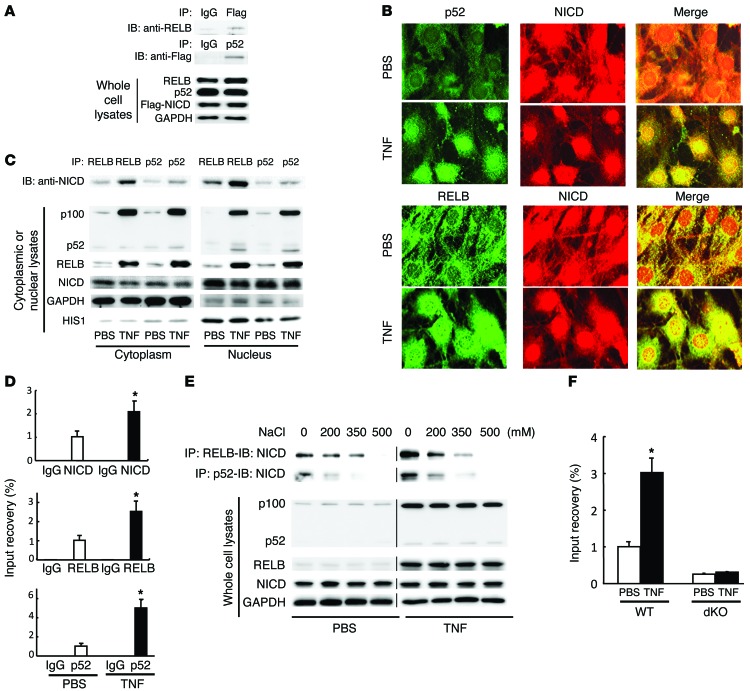
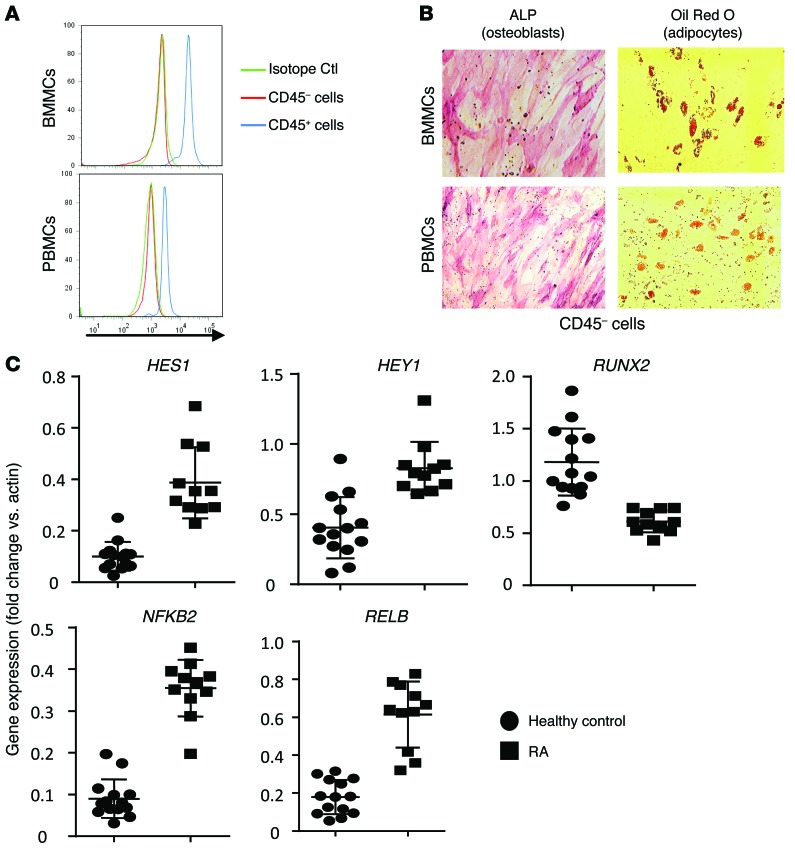
NOTCH-dependent signaling pathways are critical for normal bone remodeling; however, it is unclear if dysfunctional NOTCH activation contributes to inflammation-mediated bone loss, as observed in rheumatoid arthritis (RA) patients. We performed RNA sequencing and pathway analyses in mesenchymal stem cells (MSCs) isolated from transgenic TNF-expressing mice, a model of RA, to identify pathways responsible for decreased osteoblast differentiation. 53 pathways were dysregulated in MSCs from RA mice, among which expression of genes encoding NOTCH pathway members and members of the noncanonical NF-κB pathway were markedly elevated. Administration of NOTCH inhibitors to RA mice prevented bone loss and osteoblast inhibition, and CFU-fibroblasts from RA mice treated with NOTCH inhibitors formed more new bone in recipient mice with tibial defects. Overexpression of the noncanonical NF-κB subunit p52 and RELB in a murine pluripotent stem cell line increased NOTCH intracellular domain-dependent (NICD-dependent) activation of an RBPjκ reporter and levels of the transcription factor HES1. TNF promoted p52/RELB binding to NICD, which enhanced binding at the RBPjκ site within the Hes1 promoter. Furthermore, MSC-enriched cells from RA patients exhibited elevated levels of HES1, p52, and RELB. Together, these data indicate that persistent NOTCH activation in MSCs contributes to decreased osteoblast differentiation associated with RA and suggest that NOTCH inhibitors could prevent inflammation-mediated bone loss.


Figures

Figure 1
Figure 1. Increased expression of NOTCH target genes in MSCs from TNF-Tg mice and TNF-treated MSCs.
(A) BM cells were isolated from 6-month-old TNF-Tg mice and WT littermates (n = 3 per genotype). CD45SCA1+CD105+ MSCs were subjected to RNA-Seq using a single-cell protocol. Differentially expressed genes between TNF-Tg and WT cells were subjected to pathway analysis. (B) RNA-Seq reads (top) and qPCR data (bottom) from CD45SCA1+CD105+ MSCs of TNF-Tg and WT mice. RPKM, reads per kilobase per million. (C and D) Expression of Hes1 and Hey1 in TNF-treated (24 hours) 3rd passage of bone-derived WT MSCs (C) and in the C3H10T1/2 murine MSC line (D) by qPCR. (E) Expression of HES1 in TNF-treated (24 hours) human MSCs by qPCR. (F) 2-month-old TNFR1/2 dKO mice and WT littermates received TNF (0.5 μg/injection/d i.p.) or PBS for 5 days. BM cells were subjected to CD45 or CD45+ cell isolation for Hes1 expression by qPCR. *P < 0.05 vs. respective control.
Figure 2
Figure 2. Short-term DAPT treatment revised decreased osteoblast differentiation of MSCs in TNF-Tg mice.
(AC) TNF-Tg mice and WT littermates were gavaged with DAPT (5 mg/kg each time) or vehicle daily for 4 days. The inhibitory effect of short-term DAPT treatment on NOTCH activation (Hes1 mRNA) was confirmed in the popliteal lymph nodes (A; positive control) and in CD45 MSC-enriched cells (B) by qPCR. (C) Representative images and number of CFU-ALP+ colonies in BM stromal cells. (D and E) CFU colony cells from vehicle- or DAPT-treated TNF-Tg mice were implanted to bone matrix in tibial cortical defects of SCID mice. Mice were sacrificed 6 weeks after surgery, and volume of new bone formed in the defects, relative to total defect volume (BV/TV), was measured by μCT (D), followed by histomorphometric analysis of the area of newly formed trabecular bone observed in decalcified H&E-stained bone sections (E). n = 8 per group. Scale bars: 1 mm (broken); 100 mm (solid). (F) CFU cells generated from BM stromal cells of Rosa26-LacZ mice were implanted to tibial cortical defects for 6 weeks as in D. Frozen sections were stained for LacZ enzymatic activity (blue) and counterstained with nuclear fast red (pink). Percent bone surface area covered by donor cells (LacZ+; red arrows) over total bone surface within the area of bone defect (green line) was assessed. n = 5 per group. Scale bars: 1 μm (broken); 100 μm (solid). *P < 0.05 vs. WT; #P < 0.05 vs. vehicle.
Figure 3
Figure 3. Long-term of DAPT treatment prevented bone loss in TNF-Tg mice.
TNF-Tg mice were given with DAPT or vehicle as in Figure 2 for 3 months. (A) Representative μCT scans and morphometric data of BV/TV, trabecular number (Tb.N), trabecular thickness (Tb.Th), and trabecular separation (Tb.Sp) in L1 vertebrae. (B) Histology and histomorphometric analysis of BV/TV and number of osteoblasts (Ob) and osteoclasts (Oc) per bone surface (BS) in L1 vertebrae. (C) Calcein double-labeling in L1 vertebrae and analysis of dynamic parameters of bone formation: double labeled surface per bone surface (dLS/BS), mineral apposition rate (MAR), and bone formation rate (BFR). Original magnification, ×40. (D) Histology and histomorphometric analysis in the tibial metaphysis. Values are mean ± SD of 7–8 mice per group. (E) BM cells were cultured in the basal or osteoblast-inducing medium for 21 days in CFU colony formation assays. The number of CFU-F and CFU-ALP+ colonies was evaluated. (F) Expression of Alp and Runx2 in CFU-ALP+ colonies, assessed by qPCR. (G) BM cells were cultured with RANKL and M-CSF for 5 days in osteoclastogenic assays. The number of TRAP+ osteoclasts was counted. Values are mean ± SD of 4 dishes. Scale bars: 1 mm. *P < 0.05 vs. vehicle.
Figure 4
Figure 4. Effects of thapsigargin on osteoblast differentiation and bone volume.
(A) 2.5-month-old TNF-Tg mice and WT littermates were given thapsigargin (0.4 mg/kg/injection i.p.) or vehicle daily for 4 days. CFU colony cells were derived from the mice and implanted to bone matrix in tibial cortical defects of SCID mice as in Figure 2. Mice were sacrificed 6 weeks after surgery. Shown are histomorphometric analyses and the calculated area of newly formed trabecular bone in decalcified H&E-stained bone sections. n = 6 per group. (BE) 2.5-month-old TNF-Tg mice and WT littermates were given thapsigargin (0.4 mg/kg/injection i.p.) or vehicle 3 times per week for 2 months. The lumbar vertebrae were subjected to μCT and histological analyses as in Figure 3, and BM cells from long bones were used for biological analyses. n = 6 per group. (B) Morphometric data from μCT. (C) Histology and histomorphometric analysis. (D) BM cells were cultured in basal or osteoblast-inducing medium for 21 days in CFU colony formation assays. The number of CFU-F and CFU-ALP+ colonies was evaluated. Values are mean ± SD of 4 dishes. (E) Expression of osteoblast-related and NOTCH target genes in CFU-F colony cells, determined by qPCR. Scale bars: 100 μm (A); 1 mm (C). *P < 0.05 vs. vehicle; #P < 0.05 vs. WT.
Figure 5
Figure 5. Noncanonical NF-κB proteins p52 and RELB mediate TNF-induced NOTCH activation.
(A) Nfkb mRNA expression in CD45SCA1+CD105+ MSCs from TNF-Tg mice and WT littermates by RNA-Seq. (B) NF-κB protein expression in CD45 MSC-enriched cells from TNF-Tg mice and WT littermates by Western blot. Fold change in protein level (below) was determined by measuring band intensity. (C) Nfkb2, Relb, Runx2, and Alp mRNA expression in CD45 MSC-enriched cells from DAPT- or vehicle-treated TNF-Tg mice by qPCR. (D) Reporter activity in C3H10T1/2 cells cotransfected with RBPjκ-Luc and with NOTCH2-NICD–, p52-, and/or RELB-expressing vectors. Fold increase versus empty vector was calculated. (E) Expression of Hes1, Runx2, and Alp in cells as in D. (F) Expression of Hes1 and Hey1 in CD45Ter119 MSCs from p52/RELB dKO mice, Relb–/– mice, and control littermates. Values are mean ± SD of 3 pairs of mice. (G and H) Bone-derived MSCs of p52/RELB dKO and control littermates were treated with TNF. (G) Expression of p52, RELB, and HES1 protein by Western blot. (H) Expression of Runx2 and Alp by qPCR. *P < 0.05, #P < 0.05 vs. control.
Figure 6
Figure 6. p52 and RELB bind to NICD and are recruited to the Hes1 promoter.
(AE) C3H10T1/2 cells were treated with TNF for 24 hours in some experiments. (A) Cells were cotransfected with Flag-tagged NOTCH2-NICD, p52, and RELB expression vectors. Whole-cell lysates were subjected to IP with anti-Flag or anti-p52 antibodies and blotted with anti-RELB or anti-Flag antibodies. Experiments were repeated independently 4 times. (B) Colocalization of p52 or RELB with NICD was determined by immunofluorescent staining using anti-p52, -RELB, and –NOTCH2-NICD antibodies under confocal microscopy. (C) Nuclear and cytoplasm proteins were isolated. Protein lysates were subjected to IP with anti-p52 or anti-RELB antibodies. Immunocomplexes were blotted with anti–NOTCH2-NICD. Expression of p52, RELB and NICD proteins were examined in cytoplasmic and nuclear fractions. Experiments were repeated independently 4 times. (D) The ChIP assay was performed on immunocomplex subjected to IP with anti–NOTCH2-NICD, anti-RELB or anti-p52 antibodies. Rat IgG was used as control. Precipitated DNA was measured by qPCR using sequence-specific primers. (E) Total protein lysates were subjected to IP with anti-p52 or anti-RELB antibodies. Immunocomplexes were washed with concentration gradient of NaCl, then blotted with anti–NOTCH2-NICD. Experiments were repeated independently 3 times. Lanes were run on the same gel but were noncontiguous. (F) Bone-derived MSCs from p52/RELB dKO and WT mice were treated with TNF or PBS and subjected to ChIP as in E. Values are mean ± SD of triplicate determinants. *P < 0.05 vs. respective control.
Figure 7
Figure 7. Increased NOTCH activation in CD45 MSC/osteogenic precursors from RA patients.
(A) CD45 and CD45+ cells isolated from human BMMCs and PBMCs were stained with anti-CD45 antibody for FACS analysis. (B) CD45 cells isolated from BMMCs and PBMCs were subjected to osteoblast (ALP) and adipocyte (Oil Red O) differentiation assays. Original magnification, ×10. (C) Expression levels of NOTCH target genes, RUNX2, and noncanonical NF-κB members were measured by qPCR in CD45 cells isolated from PBMCs from healthy control subjects (n = 14) and patients with RA (n = 11). Values were calculated as Ctgene of interest/2 – Ctactin × 100.

Similar articles

Cited by

References

    1. Zhao L, et al. Tumor necrosis factor inhibits mesenchymal stem cell differentiation into osteoblasts via the ubiquitin E3 ligase Wwp1. Stem Cells. 2011;29(10):1601–1610. doi: 10.1002/stem.703. - DOI - PMC - PubMed
    1. Kaneki H, et al. Tumor necrosis factor promotes Runx2 degradation through up-regulation of Smurf1 and Smurf2 in osteoblasts. J Biol Chem. 2006;281(7):4326–4333. doi: 10.1074/jbc.M509430200. - DOI - PMC - PubMed
    1. Guo R, et al. Ubiquitin ligase Smurf1 mediates tumor necrosis factor-induced systemic bone loss by promoting proteasomal degradation of bone morphogenetic signaling proteins. J Biol Chem. 2008;283(34):23084–23092. doi: 10.1074/jbc.M709848200. - DOI - PMC - PubMed
    1. Li P, et al. Systemic tumor necrosis factor alpha mediates an increase in peripheral CD11bhigh osteoclast precursors in tumor necrosis factor alpha-transgenic mice. Arthritis Rheum. 2004;50(1):265–276. doi: 10.1002/art.11419. - DOI - PubMed
    1. Diarra D, et al. Dickkopf-1 is a master regulator of joint remodeling. Nat Med. 2007;13(2):156–163. doi: 10.1038/nm1538. - DOI - PubMed

Publication types

MeSH terms