. 2014 Jul;124(7):2947-62.
doi: 10.1172/JCI71651. Epub 2014 Jun 2.

Myosin Vb uncoupling from RAB8A and RAB11A elicits microvillus inclusion disease

Myosin Vb uncoupling from RAB8A and RAB11A elicits microvillus inclusion disease

Byron C Knowles et al. J Clin Invest. 2014 Jul.

Abstract

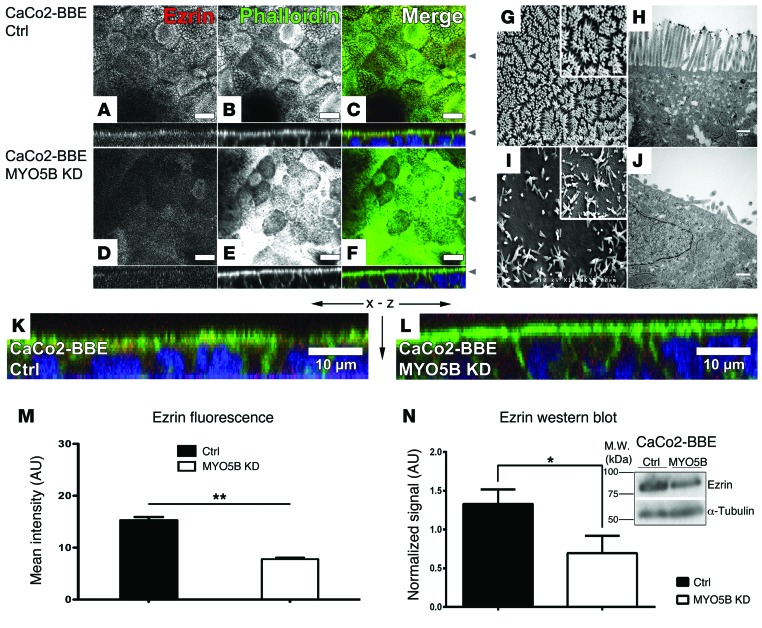
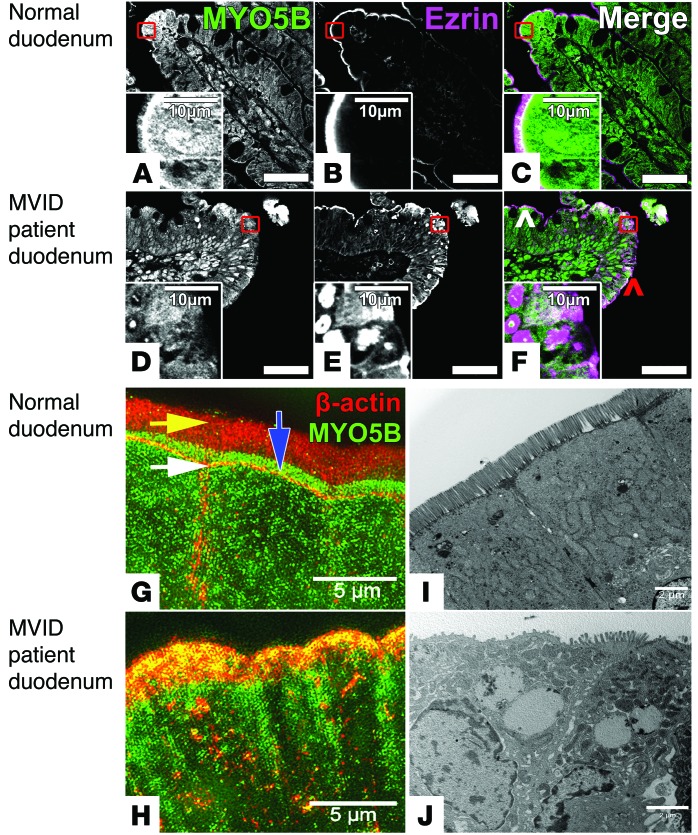
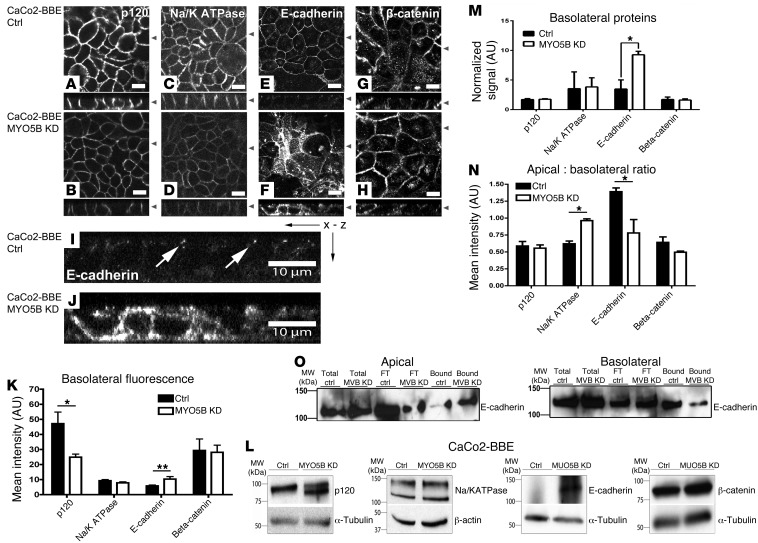
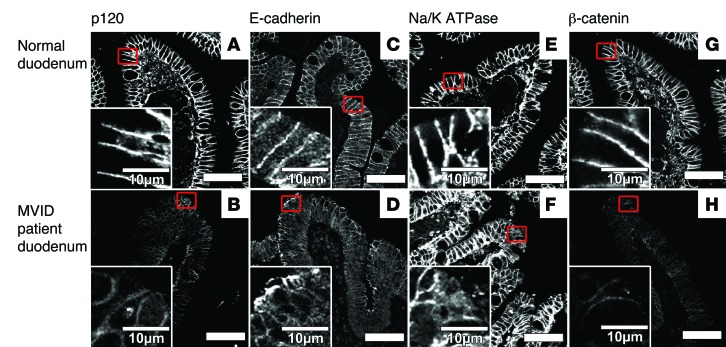
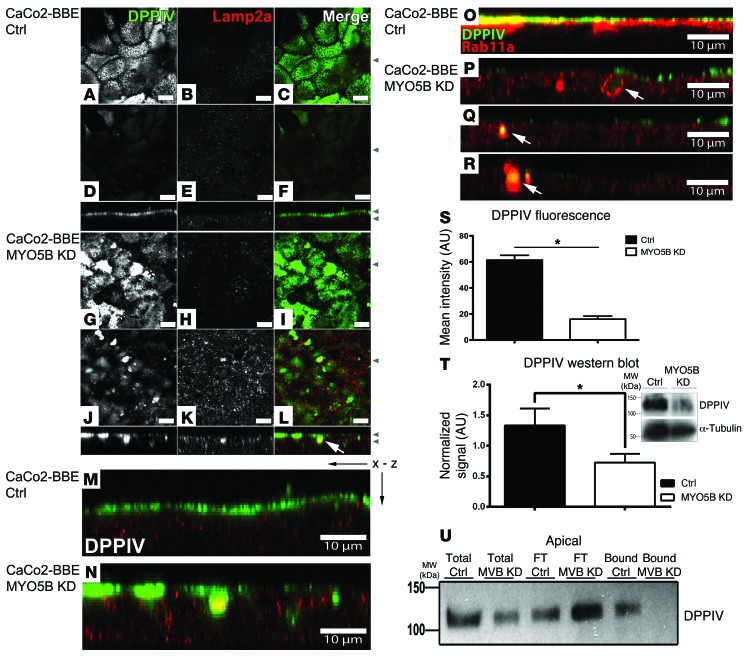
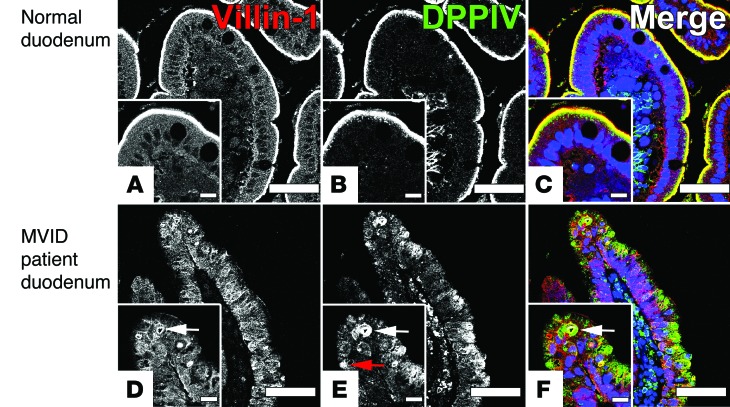
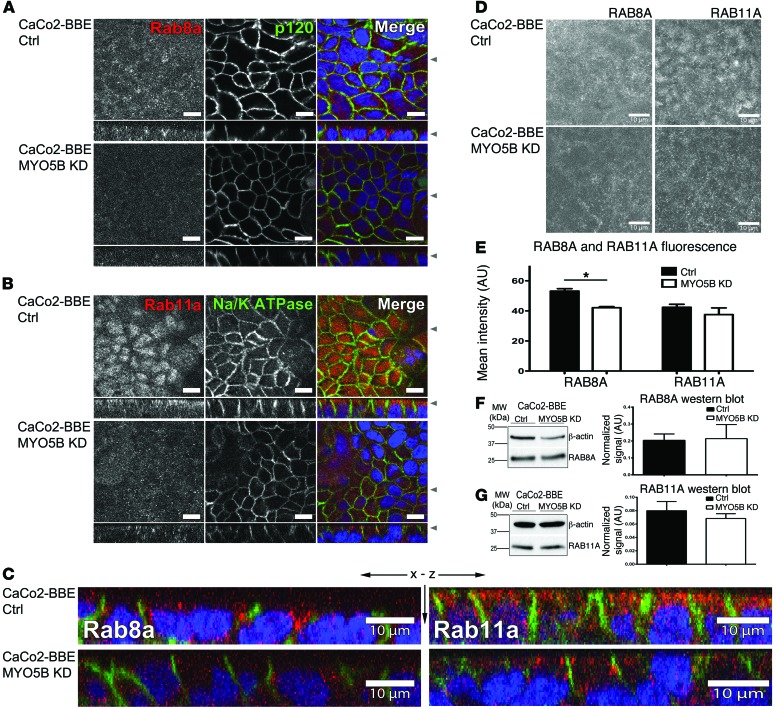
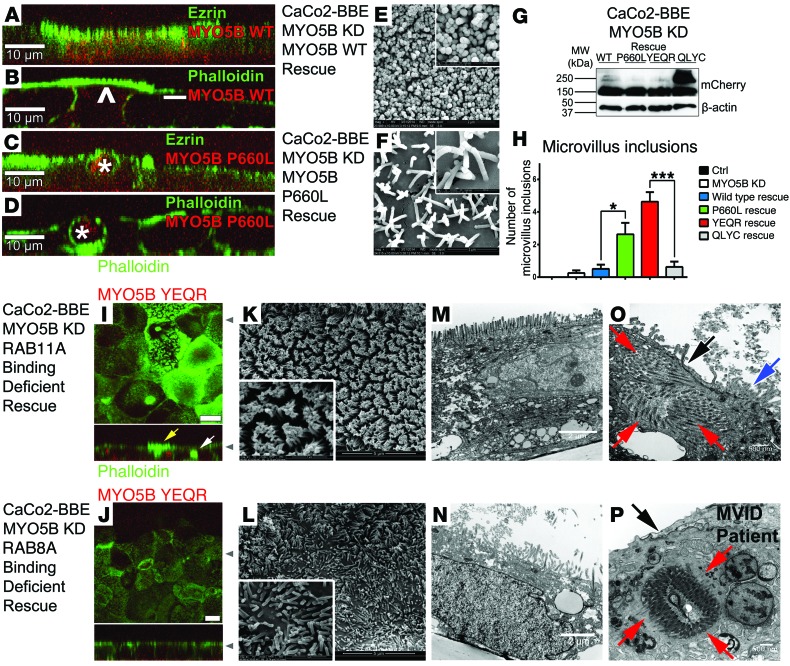
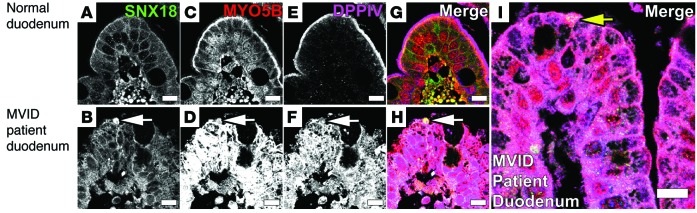
Microvillus inclusion disease (MVID) is a severe form of congenital diarrhea that arises from inactivating mutations in the gene encoding myosin Vb (MYO5B). We have examined the association of mutations in MYO5B and disruption of microvillar assembly and polarity in enterocytes. Stable MYO5B knockdown (MYO5B-KD) in CaCo2-BBE cells elicited loss of microvilli, alterations in junctional claudins, and disruption of apical and basolateral trafficking; however, no microvillus inclusions were observed in MYO5B-KD cells. Expression of WT MYO5B in MYO5B-KD cells restored microvilli; however, expression of MYO5B-P660L, a MVID-associated mutation found within Navajo populations, did not rescue the MYO5B-KD phenotype but induced formation of microvillus inclusions. Microvilli establishment required interaction between RAB8A and MYO5B, while loss of the interaction between RAB11A and MYO5B induced microvillus inclusions. Using surface biotinylation and dual immunofluorescence staining in MYO5B-KD cells expressing mutant forms of MYO5B, we observed that early microvillus inclusions were positive for the sorting marker SNX18 and derived from apical membrane internalization. In patients with MVID, MYO5B-P660L results in global changes in polarity at the villus tips that could account for deficits in apical absorption, loss of microvilli, aberrant junctions, and losses in transcellular ion transport pathways, likely leading to the MVID clinical phenotype of neonatal secretory diarrhea.


Figures

Figure 1
Figure 1. Confocal fluorescence imaging, scanning electron microscopy, and TEM of CaCo2-BBE cells demonstrating loss of microvilli with MYO5B-KD.
(AF) x-y images are shown in the top panels with x-z images below each. (A and B) Immunostaining for ezrin (red) and phalloidin F-actin (green) in control cells showed prominent staining of microvilli. Triple overlay with DAPI nuclear staining (blue) is shown in C. (D and E) Immunostaining for ezrin (red) and phalloidin F-actin (green) in MYO5B-KD cells showed reduced apical ezrin and an accumulation of F-actin in the subapical region. Triple overlay with DAPI nuclear staining (blue) is shown in F. (G and H) Scanning electron microscopy and TEM of control cells showing normal densely packed microvilli. (I and J) Scanning electron microscopy and TEM of MYO5B-KD cells showing immature sparse microvilli. (K) Control cells x-z images from C magnified showing microvilli stained for both ezrin and F-actin. (L) CaCo2-BBE MYO5B-KD cells x-z images from F magnified showing loss of apical microvilli stained for both ezrin and F-actin and their accumulation in the terminal web. (M) Quantitation of ezrin mean fluorescence in maximum-intensity Z-stack projections showing a reduction in CaCo2-BBE MYO5B-KD cells. (N) Ezrin Western blot with quantitation showing a decrease in total ezrin in the MYO5B-KD cells. Scale bar: 10 μm (AF, K, and L); 3 μm (G and I); 1 μm (G and I, insets); 500 nm (H and J). *P ≤ 0.05, **P ≤ 0.01, Mann-Whitney test. Error bars denote mean ± SEM.
Figure 2
Figure 2. Immunostaining of duodenum samples from Navajo patients with MVID reveals that mutation of MYO5B causes loss of apical microvilli, microvillus inclusion formation, and accumulation of F-actin into the terminal web.
(AC) Normal duodenum immunostaining for MYO5B (green) and ezrin (magenta) showed subapical MYO5B with increased staining at the tips of villi and ezrin localization to the brush border. (DF) MVID patient duodenum immunostaining for MYO5B and ezrin showed dispersal of MYO5B from the subapical region of enterocytes and ezrin localization to microvillus inclusions in cells at the villus tips. Note that cells near the crypts (white arrowhead) showed a normal apical ezrin distribution when compared with cells at the villus tips (red arrowhead). (G) SIM imaging of β-actin (red) and MYO5B (green) in normal duodenum showed actin staining in the apical brush border (yellow arrow), discrete staining of the terminal web (white arrow), and MYO5B localization above the terminal web and below the apical surface (blue arrow). (H) SIM imaging of the samples from patients with MVID revealed an accumulation of β-actin (red) in the terminal web and dispersal of MYO5B (green) from its normal subapical position above the terminal web. (I) TEM in normal duodenum showed normal apical microvilli. (J) TEM of the MVID patient duodenum revealed a decrease in microvilli and enlarged subapical vesicular structures. Scale bar: 50 μm (AF); 10 μm (AF, insets); 5 μm (G and H); 2 μm (I and J).
Figure 3
Figure 3. Loss of MYO5B in CaCo2-BBE cells causes the redistribution of basolateral markers.
(AH) x-y confocal images are shown above z-axis reconstructions. (A) p120 staining in controls showed a lateral distribution, (B) while MYO5B-KD cells showed decreased p120 at the lateral membranes. (C) Na/K-ATPase staining in controls showed a lateral distribution, (D) while MYO5B-KD cells showed reduction in lateral membranes. (E) E-cadherin staining in controls showed a junctional distribution, (I) with the x-z image magnified in junctional E-cadherin (white arrows). (F) MYO5B-KD showed redistribution of E-cadherin along the apical and lateral membranes and with internal pools of E-cadherin distributed throughout the cells; x-z image magnified in J. (G and H) In control and MYO5B-KD cells, β-catenin stained lateral membranes. (K) Quantitation of basolateral mean fluorescence. MYO5B-KD cells showed a reduction of p120 and an increase in E-cadherin. (L and M) Western blot with quantitation of basolateral markers in MYO5B-KD showed an isoform switch of p120, with no decrease and an increase E-cadherin total protein. (N) Quantitation of apical-to-basolateral ratio in MYO5B-KD cells showed a redistribution of Na/K-ATPase to the apical surface, while E-cadherin was localized over both the apical and basolateral surfaces. (O) Surface biotinylation of either the apical or basolateral surfaces in control and MYO5B-KD cells with total protein, flow through from streptavidin beads (FT), and biotinylated-streptavidin-bound protein from control (Bound-Ctrl) or MYO5B-KD (Bound-MVBKD) cells showed an increase in apical and a decrease in basolateral E-cadherin in the MYO5B-KD cells. Scale bar: 10 μm. *P ≤ 0.05, **P ≤ 0.01, Mann-Whitney test. Error bars denote mean ± SEM.
Figure 4
Figure 4. Immunostaining of MVID patient duodenum samples demonstrated alteration of the basolateral compartment.
(A) In normal duodenum, p120 staining showed a lateral distribution. (B) In MVID patient duodenum, p120 staining was reduced but maintained its lateral membrane localization. (C) In normal duodenum, E-cadherin staining demonstrated a lateral distribution. (D) In MVID patient duodenum, E-cadherin staining was present on both apical and lateral membranes. (E) In normal duodenum, Na/K-ATPase antibodies stained the lateral membranes. (F) In the MVID patient samples, Na/K-ATPase stained the lateral membranes with dispersal of staining in enterocytes at the villus tips. (G) In normal duodenum, β-catenin staining was present in the lateral membranes. (H) In MVID patient duodenum, β-catenin staining was decreased in the lateral membranes. Scale bar: 50 μm; 10 μm (insets).
Figure 5
Figure 5. Coimmunostaining of DPPIV and LAMP2a in CaCo2-BBE cells with redistribution of DPPIV to large vesicles in MYO5B-KD cells.
(AL) x-y confocal images are shown above z-axis reconstructions. Control and MYO5B-KD cells were immunostained for DPPIV (green) and LAMP2a (red). (AF) Control cells showed a normal apical distribution of DPPIV and diffusely cytoplasmic LAMP2a. (GL) In MYO5B-KD cells, DPPIV was seen in internal vesicles, some of which also stained for LAMP2a (white arrow). (M) Magnified x-z image from control cells in F. (N) Magnified x-z image from MYO5B-KD cells in L showing cytoplasmic distribution of DPPIV. (O) Control cells immunostained for DPPIV (green) and RAB11A (red) showed apical DPPIV and subapical RAB11A. (PR) MYO5B-KD cells, immunostained for DPPIV (green) and RAB11A (red), showed dispersal of RAB11A from the subapical surface and localization in large DPPIV positive vesicles (white arrows). (S) DPPIV reduction in MYO5B-KD cells shown via mean fluorescence in maximum-intensity Z-stack projections. (T) Western blot comparing control and MYO5B-KD cell lines probed for DPPIV and α-tubulin demonstrating reduction of DPPIV expression. (U) Apical surface biotinylation in control and MYO5B-KD cells showing DPPIV immunoreactivity in total protein, flow through from streptavidin beads, and biotinylated streptavidin-bound protein, demonstrating an increase in the nonbiotinylated cytoplasmic pool and a decrease in DPPIV on the apical surface in the MYO5B-KD (Bound-MVBKD) versus control (Bound-Ctrl) cells. Scale bar: 10 μm. *P ≤ 0.05, Mann-Whitney test. Error bars denote mean ± SEM.
Figure 6
Figure 6. DPPIV is mistrafficked to intracellular vesicles and to microvillus inclusions in samples from patients with MVID.
(AC) Normal duodenum villin-1 (red) and DPPIV (green) immunostaining showed localization of DPPIV and villin-1 to the brush border. Merged overlay images with DAPI nuclear staining (blue) are shown at right. (DF) MVID patient duodenum villin-1 and DPPIV immunostaining showed mislocalization of DPPIV to microvillus inclusions (white arrows) and to large intracellular vesicles (red arrow). Merged overlay images with DAPI nuclear staining (blue) are shown at right. Scale bar: 50 μm; 10 μm (insets).
Figure 7
Figure 7. RAB8A and RAB11A immunofluorescence staining in MYO5B-KD cells was dispersed from the apical surface.
(A and B) x-y confocal images are shown above z-axis reconstructions. (A) RAB8A (red) and p120 (green) costaining in CaCo2-BBE cells. Control cells showed apical-lateral RAB8A distribution. MYO5B-KD cells showed RAB8A dispersal throughout the cytoplasm. (B) RAB11A (red) and Na/K-ATPase (green) staining in CaCo2-BBE cells. In control cells, RAB11A showed a subapical distribution. In MYO5B-KD cells, RAB11A was dispersed throughout the cytoplasm. (C) Magnified RAB8A staining x-z images from control and MYO5B-KD cells in A, and magnified RAB11A staining x-z images from control and MYO5B-KD cells in B. (D) In control cells, z-axis projection showed the normal distribution of RAB8A-positive vesicles and RAB11A-positive vesicles. In MYO5B-KD cells, z-axis projection showed dispersal of RAB8A-positive vesicles and RAB11A-positive vesicles. (E) Quantitation of RAB8A and RAB11A mean fluorescence in maximum-intensity Z-stack projections showed a reduction in RAB8A but no change of RAB11A in MYO5B-KD cells. (F) Western blot with quantitation of RAB8A showed no change in RAB8A in MYO5B-KD cells. (G) Western blot with quantitation of RAB11A showed no change in RAB11A in MYO5B-KD cells. Scale bar: 10 μm. *P ≤ 0.05, Mann-Whitney test. Error bars denote mean ± SEM.
Figure 8
Figure 8. MYO5B-WT and MYO5B-YE/QR rescue the MYO5B-KD phenotype, while MYO5B-P660L and MYO5B-YE/QR promote microvillus inclusions.
(A) Ezrin and (B) phalloidin staining in microvilli was rescued in MYO5B-KD–expressing MYO5B-WT. Arrowhead, high expressers; –, low expressers. (C and D) Ezrin and phalloidin staining in microvilli was not rescued in MYO5B-KD–expressing MYO5B-P660L and induced microvillus inclusions (asterisks). (E and F) Scanning electron microscopy of (E) MYO5B-KD–expressing MYO5B-WT showed reestablished mature microvilli and (F) MYO5B-KD–expressing MYO5B-P660L showed immature microvilli in the tepee-like stage. (G) Western blot of rescue cell lines showed similar expression levels of mCherry. (H) Microvillus inclusions in MYO5B-KD reexpressing MYO5B-P660L and MYO5B-YE/QR were significantly higher compared with other cell lines. (I) Expression of MYO5B-YE/QR reestablished phalloidin staining of microvilli (yellow arrow) but also induced the formation of microvillus inclusions (white arrow). (J) Expression of MYO5B-QL/YC partially recovered microvilli. (K and M) Scanning electron microscopy and TEM of MYO5B-KD cells expressing MYO5B-YE/QR showed reestablished mature microvilli. (L and N) Scanning electron microscopy and TEM of MYO5B-KD cells expressing MYO5B-QL/YC showed partial rescue of nonuniform microvilli. (O) MYO5B-KD cells expressing MYO5B-YE/QR showed subapical microvillus inclusions (red arrows), with corresponding denuded microvilli (black arrow) and surrounding brush border (blue arrow). (P) MVID patient duodenum with pathognomonic microvillus inclusion (red arrows) and denuded microvilli (black arrow). Scale bar: 10 μm (AD, I, and J); 2 μm (E and F); 500 nm (E and F, insets); 5 μm (K and L); 1 μm (K and L, insets), 2 μm (M and N); 500 nm (O and P). *P ≤ 0.05, ***P ≤ 0.001, Mann-Whitney test. Error bars denote mean ± SEM.
Figure 9
Figure 9. Microvillus inclusions in CaCo2-BBE cells arise from internalization of the apical surface.
x-y confocal images of MYO5B-YE/QR–expressing MYO5B-KD cells are shown above z-axis reconstructions. (AC) CaCo2-BBE cells were stained with phalloidin (green). Images in A and B use corresponding x-y and different z-axis reconstructions from the same field of view. The z-axis reconstruction in A shows the development of an apical invagination, whereas that in B shows a nearly completed microvillus inclusion. (C) A separate field of view in which the z-axis reconstruction demonstrates a completely internalized microvillus inclusion. (DF) The apical surface of CaCo2-BBE cells was biotinylated and fixed after 24 hours. These cells were then stained with phalloidin (green) and fluorescent streptavidin (red). Single asterisks indicate the position for the first z-axis reconstruction directly below the x-y confocal image. Double asterisks indicate the position for the second z-axis reconstruction directly below the first z-axis reconstruction. Fluorescent streptavidin was observed in microvillus inclusions inside the cells. (GI) CaCo2-BBE cells from A and B double labeled with both phalloidin and SNX18 showed SNX18 localization at the bottom of a forming microvillus inclusion (white arrows), while more mature microvillus inclusions showed dispersal of SNX18 (red arrows). Scale bar: 10 μm.
Figure 10
Figure 10. Immunostaining of MVID patient duodenum shows early microvillus inclusions labeled with SNX18, MYO5B, and DPPIV.
(A) Normal duodenum section stained for SNX18 showed subapical and lateral localization of SNX18. (B) Staining of MVID patient duodenum for SNX18 showed localization of SNX18 to early microvillus inclusion (white arrow). (C) Normal duodenum stained for MYO5B showed subapical localization of MYO5B. (D) Staining of MVID patient duodenum for MYO5B showed dispersal from the subapical region and accumulation and increase of MYO5B staining throughout the cytoplasm and localization of MYO5B to an early microvillus inclusion (white arrow). (E) Normal duodenum stained for DPPIV showed apical localization of DPPIV. (F) Staining of MVID patient duodenum for DPPIV showed localization of DPPIV to an early microvillus inclusion (white arrow). (G and H) Merged images of normal duodenum and samples from patients with MVID stained with SNX18, MYO5B, and DPPIV from AF. (I) Merged image of MVID patient duodenum showed an early microvillus inclusion formation (yellow arrow) staining for SNX18, MYO5B, and DPPIV. Scale bar: 10 μm.

Similar articles

Cited by

References

    1. Muller T, et al. MYO5B mutations cause microvillus inclusion disease and disrupt epithelial cell polarity. Nat Genet. 2008;40(10):1163–1165. doi: 10.1038/ng.225. - DOI - PubMed
    1. Erickson RP, Larson-Thome K, Valenzuela RK, Whitaker SE, Shub MD. Navajo microvillous inclusion disease is due to a mutation in MYO5B. Am J Med Genet A. 2008;146A(24):3117–3119. doi: 10.1002/ajmg.a.32605. - DOI - PubMed
    1. Pohl JF, et al. A cluster of microvillous inclusion disease in the Navajo population. J Pediatr. 1999;134(1):103–106. doi: 10.1016/S0022-3476(99)70380-X. - DOI - PubMed
    1. Ruemmele FM, et al. Loss-of-function of MYO5B is the main cause of microvillus inclusion disease: 15 novel mutations and a CaCo-2 RNAi cell model. Hum Mutat. 2010;31(5):544–551. doi: 10.1002/humu.21224. - DOI - PubMed
    1. Chen CP, et al. Microvillus inclusion disease: prenatal ultrasound findings, molecular diagnosis and genetic counseling of congenital diarrhea. Taiwan J Obstet Gynecol. 2010;49(4):487–494. doi: 10.1016/S1028-4559(10)60102-7. - DOI - PubMed

Publication types

MeSH terms

Supplementary concepts