. 2014 Jul;124(7):3047-60.
doi: 10.1172/JCI73469. Epub 2014 Jun 2.

Cystic fibrosis airway secretions exhibit mucin hyperconcentration and increased osmotic pressure

Cystic fibrosis airway secretions exhibit mucin hyperconcentration and increased osmotic pressure

Ashley G Henderson et al. J Clin Invest. 2014 Jul.

Abstract

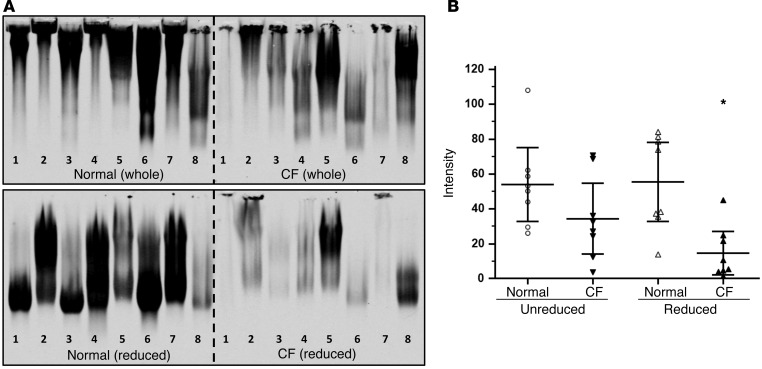
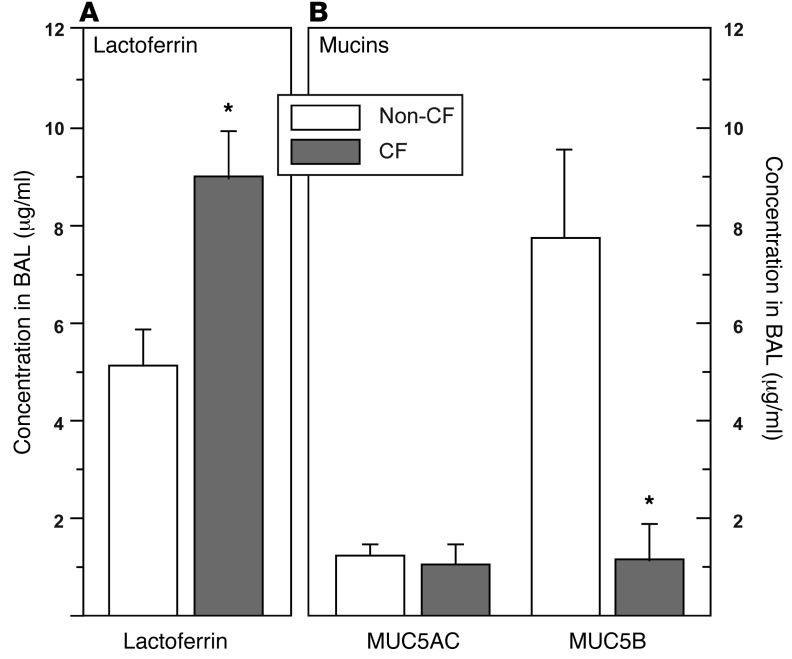
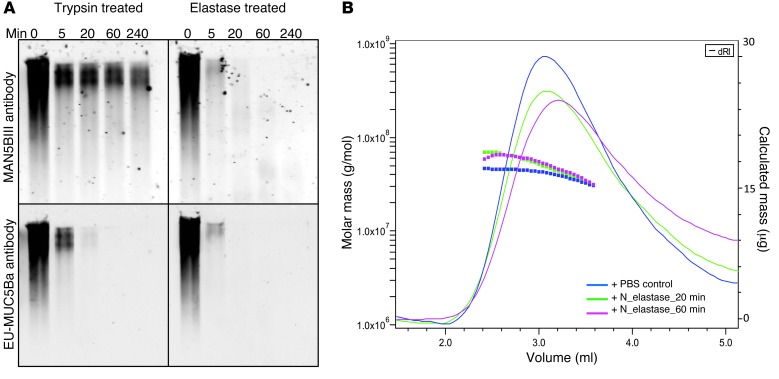
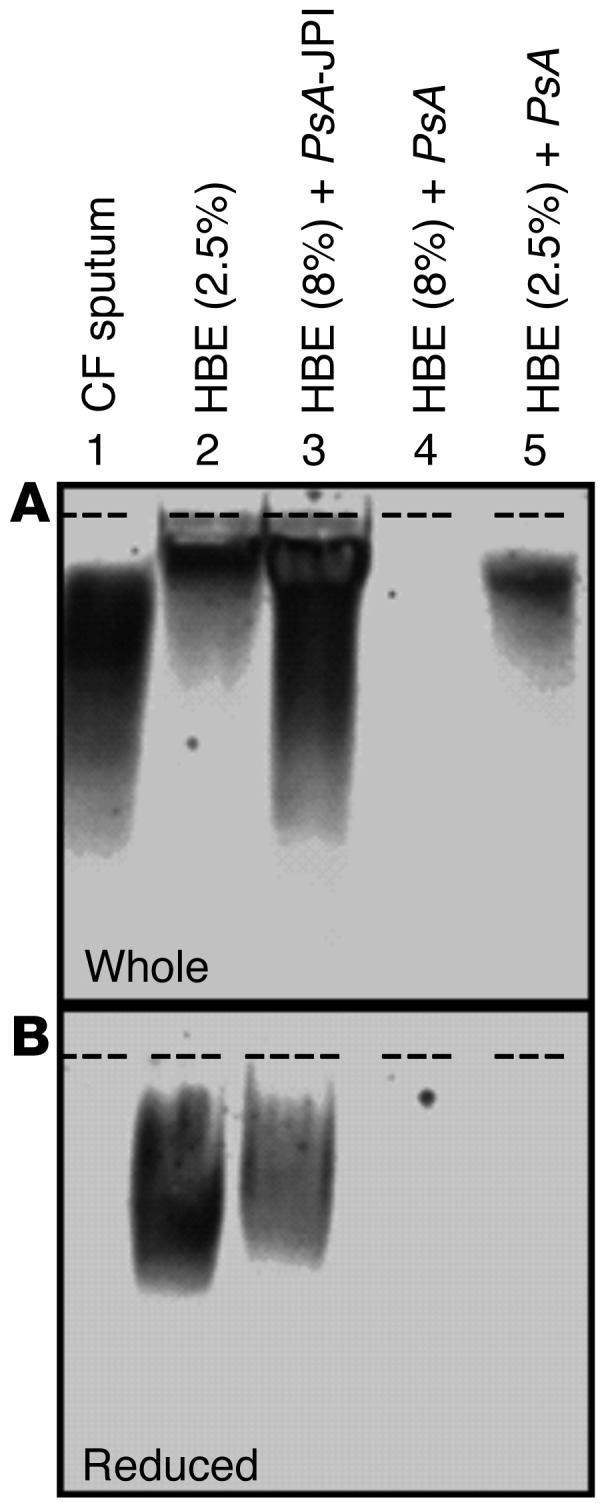
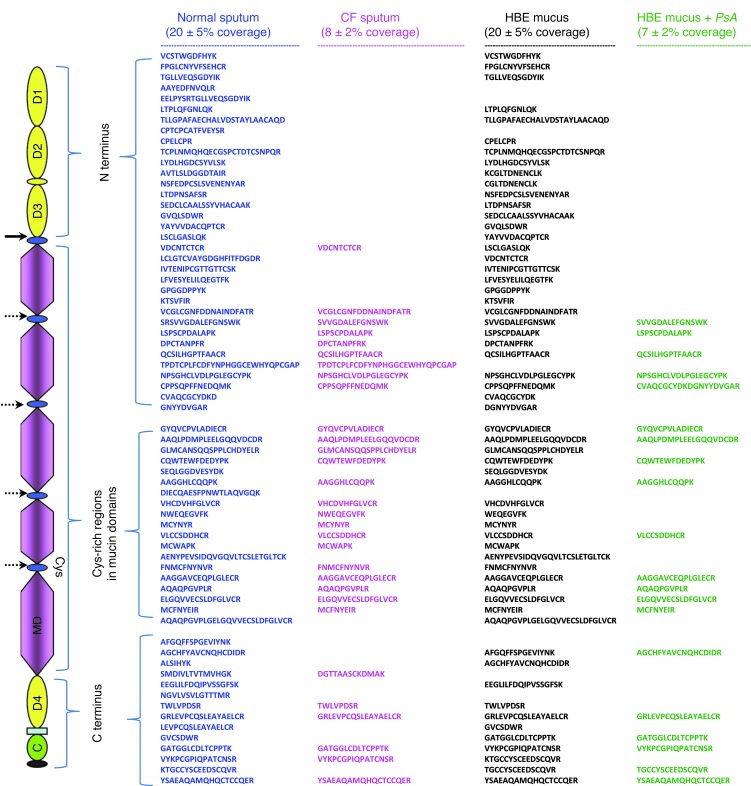
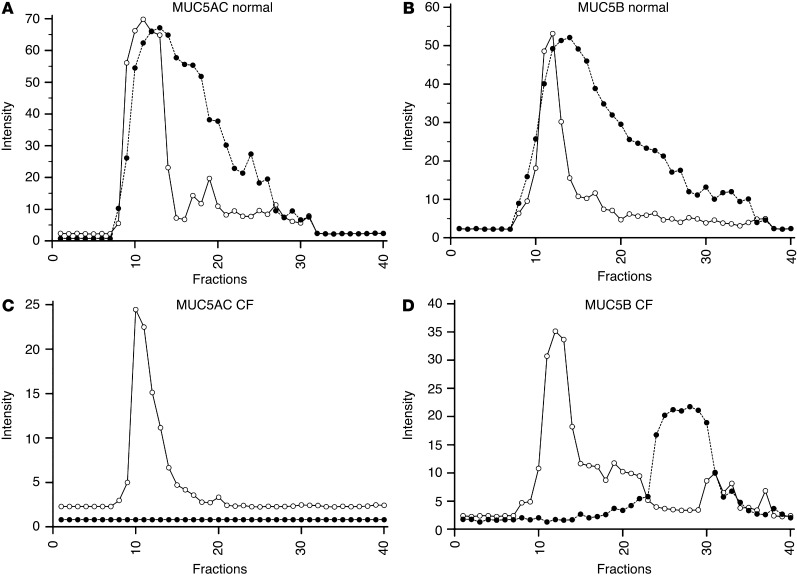
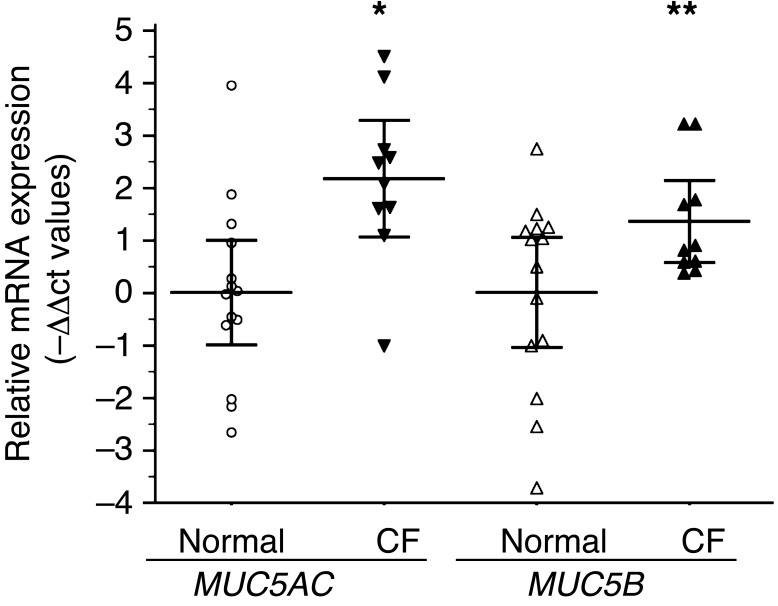
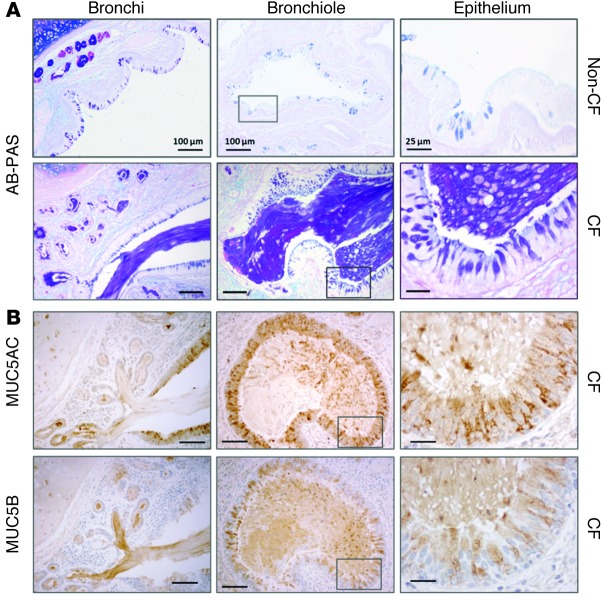
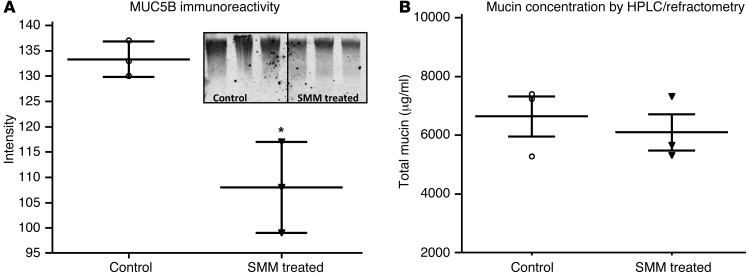
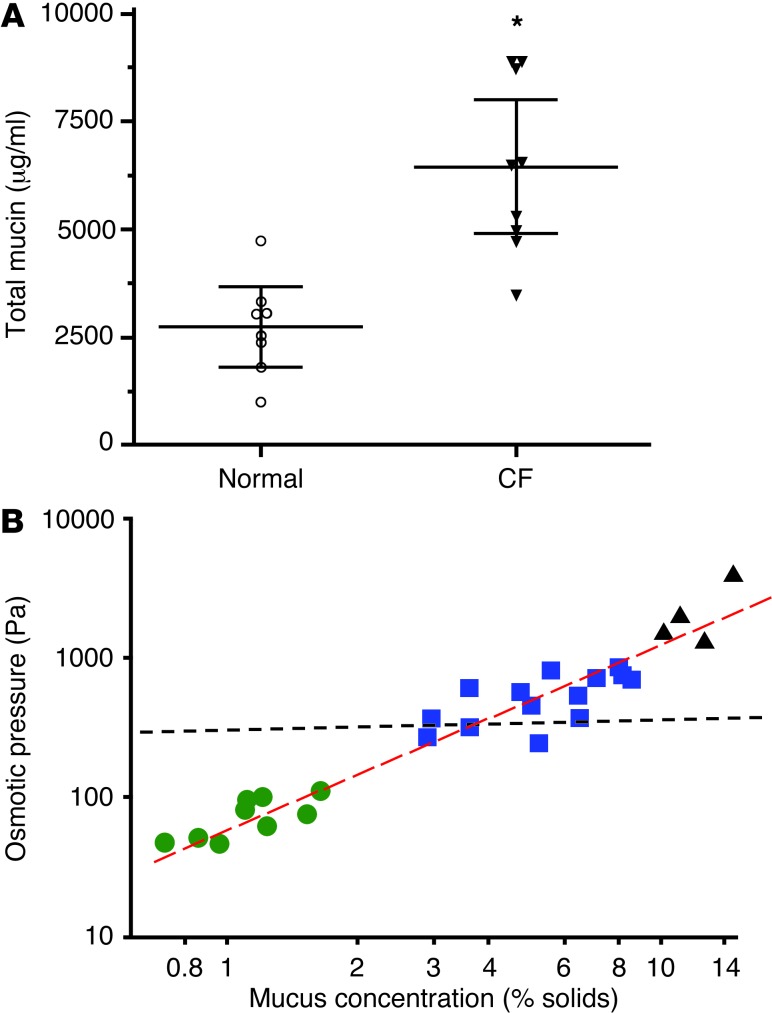
The pathogenesis of mucoinfective lung disease in cystic fibrosis (CF) patients likely involves poor mucus clearance. A recent model of mucus clearance predicts that mucus flow depends on the relative mucin concentration of the mucus layer compared with that of the periciliary layer; however, mucin concentrations have been difficult to measure in CF secretions. Here, we have shown that the concentration of mucin in CF sputum is low when measured by immunologically based techniques, and mass spectrometric analyses of CF mucins revealed mucin cleavage at antibody recognition sites. Using physical size exclusion chromatography/differential refractometry (SEC/dRI) techniques, we determined that mucin concentrations in CF secretions were higher than those in normal secretions. Measurements of partial osmotic pressures revealed that the partial osmotic pressure of CF sputum and the retained mucus in excised CF lungs were substantially greater than the partial osmotic pressure of normal secretions. Our data reveal that mucin concentration cannot be accurately measured immunologically in proteolytically active CF secretions; mucins are hyperconcentrated in CF secretions; and CF secretion osmotic pressures predict mucus layer-dependent osmotic compression of the periciliary liquid layer in CF lungs. Consequently, mucin hypersecretion likely produces mucus stasis, which contributes to key infectious and inflammatory components of CF lung disease.


Figures

Figure 1
Figure 1. Mucin (MUC5B) levels in CF sputum as monitored by immunoblotting.
(A) Agarose gel electrophoresis of sputum from 8 normal and CF patients; whole or reduced samples were probed with a monoclonal MUC5B antibody (EU-MUC5Ba) prior to loading. The integrated intensities of the each lane were quantitated and scatter plotted for comparison (B). Mean and standard error values are indicated by major (mean) and minor (SEM) horizontal bars. The independent samples t test was used to determine changes between normal and CF sputum in values for whole (P = 0.13) and reduced (*P = 0.0023) conditions, indicating significant loss of MUC5B reactivity after reduction.
Figure 2
Figure 2. Lactoferrin (A) and polymeric mucin (B) levels in BAL fluid samples from children with CF or other disorders (non-CF disease controls).
(A) Lactoferrin concentrations were increased in CF BAL samples as compared with those in disease control samples. In the non-CF disease controls, MUC5B was the dominant secreted mucin. MUC5B levels were reduced in CF versus normal samples when mucin quantitation was determined by immunodetection. MUC5AC levels were not significantly lower in CF samples. Data represent the mean ± SEM (*P < 0.01).
Figure 3
Figure 3. The effect of proteases on mucin epitopes and polymeric structure.
(A) Isolated MUC5B (100 μg) was incubated with either trypsin (1 μg) or elastase (1 μg) for increasing periods of time (5 minutes to 4 hours). Unreduced aliquots of the samples were subjected to agarose gel electrophoresis and probed with MAN5BIII or EU-MUC5Ba antibodies. MAN5BIII immunoreactivity was completely abolished by the NE within 5 minutes, while trypsin treatment substantially reduced the antibody reactivity. EU-MUC5Ba immunoreactivity was lost within 20 minutes of exposure to both trypsin and elastase. (B) An aliquot from the NE-treated samples was subjected to SEC/MALS/dRI measurements using a Sepharose CL-2B (2 × 5 ml) column to determine molecular weight (dotted lines) and sample concentrations (solid lines), respectively. The total mucin mass under the curve was slightly decreased from 28.4 μg (blue line, PBS control) to 25.6 μg after a 20-minute elastase incubation (green line) and to 24.2 μg after a 60-minute elastase incubation (magenta line). Molecular mass measurements were plotted across the mucin peak: control mucins had an average molecular mass of approximately 38 MDa (blue dotted line) and had an average molecular mass of approximately 44 MDa after 20 (green dotted line) and 60 (magenta dotted line) minutes of elastase incubation, indicating a slight increase in molecular weight.
Figure 4
Figure 4. Mucin (MUC5B) immunoblotting of samples with variable mucus concentration, with and without the presence of P. aeruginosa.
(A) Unreduced (whole) samples. Lane 1 contains sputum collected from a representative CF patient infected with P. aeruginosa. Lane 2 contains normal 2.5% mucus cell culture as a control. Lane 3 contains 8% mucus cell culture with P. aeruginosa-JP1 (P. aeruginosa lacking biofilm-forming capacity and lower elastase production). Lane 4 contains 8% cell culture, 8% mucus, and P. aeruginosa. Lane 5 contains 2.5% mucus cell culture with P. aeruginosa added to the culture. All samples in lanes 1–5 were not reduced prior to loading (whole samples). (B) Samples were reduced prior to loading, leading to a loss of antibody reactivity in P. aeruginosa–exposed samples. P. aeruginosa-JP1 samples (lanes 3 in A and B) maintained some antibody reactivity, as this P. aeruginosa mutant exhibited much lower elastase production, suggesting that the P. aeruginosa proteolysis caused the absence of antibody staining in these gels. Origins of the loaded samples are indicated by the dashed lines. Gels shown are representative of at least 3 independent experiments. PsA, P. aeruginosa.
Figure 5
Figure 5. Peptide coverage comparison of MUC5B isolated from normal and CF sputum and HBE secretions with and without P. aeruginosa.
Mucins were isolated from normal and CF sputum and PaO-treated and nontreated HBE cell culture mucus samples using density gradient centrifugation. Mucins were then digested with trypsin, and peptides were identified by LC-MS/MS analysis. The coverage map indicates that most of the peptides from the N terminus region, including vWF domains, were not readily detectable in CF sputum and PaO-treated HBE mucus, suggesting that the integrity of these regions was affected by the proteolytic activity. Mucin domains are shown as (von Willebrand) D1, D2, D3, D4, C domains, cystein-rich (Cys), and O-glycosylated tandem repeat mucin domains (MD). Dotted arrows illustrate repeating positions of the epitope (RNREQVGKFKMC) for one of the MUC5B antibodies used (and the antibody used in the study by Henke et al.; ref. 17). The solid arrow illustrates the positions of the epitope (CSWYNGHRPEPGLG) for the other MUC5B antibody used. See Table 1 for antibody details.
Figure 6
Figure 6. Distribution of mucin macromolecules in normal and CF sputum as assessed by gel filtration chromatography.
Sputum samples were subjected to Sepharose CL-2B chromatography. Fractions collected were analyzed via slot blot and probed with MUC5AC (A and C) or MUC5B (B and D) antisera. Solid line with white circles and dotted lines with black circles represent unreduced and reduced samples, respectively. Chromatograms are representative of at least 3 independent experiments.
Figure 7
Figure 7. Changes in mucin mRNA expression in CF lungs as monitored by relative quantitative real-time PCR.
mRNA was collected from non-CF (n = 14) and CF (n = 11) lungs at the time of death or transplantation. Sampling occurred in cartilaginous airways (~0.8 mm in diameter) and consisted of epithelial cells devoid of submucosal glands. The comparative Ct (ΔΔCt) method was used to determine changes in cross-point values for MUC5AC (*P = 0.003) and MUC5B (**P = 0.024) using 18S. Mean and standard error values are indicated by major (mean) and minor (SEM) horizontal bars.
Figure 8
Figure 8. Histopathological analysis demonstrates the presence of mucus plugs and intracellular mucins in CF lungs.
(A) AB-PAS staining of proximal (bronchi) and distal (bronchiole) airways from non-CF and CF lungs show increased AB-PAS–positive material in CF airway surfaces and lumen. (B) MUC5AC and MUC5B immunolabeling of consecutive CF sections revealed that both mucins were expressed by airway goblet cells and participated in mucus plugs. Scale bars: 100 μm (Bronchi and Bronchiole columns); 25 μm (Epithelium column).
Figure 9
Figure 9. The effect of CF SMM on mucin immunoreactivity and concentration.
HBE cultures, preconditioned by a 72-hour luminal incubation with SMM, were stimulated to secrete mucins and formed mucus with ATPγS. Cultures were then incubated in situ with PBS or with fractionated SMM (100-kDa cutoff) and analyzed for MUC5B by agarose Western blotting (A) or SEC/dRI (B). Note the apparent decrease in MUC5B content in the sample incubated with fractionated SMM, as measured by immunoreactivity (*P = 0.01; n = 6) and the lack of a difference by refractometry measurements (P > 0.5). Mean and SEM values are indicated by major and minor horizontal bars, respectively.
Figure 10
Figure 10. Changes in total mucin concentrations in CF sputum and relationship between mucus concentration and osmotic pressure.
(A) Total mucin concentrations of sputum samples from normal and CF lungs were measured by SEC/dRI. Calculated concentrations of each sample were plotted for comparison. Mean and SEM values are indicated by major and minor horizontal bars, respectively. An independent samples t test was used to determine changes in values between normal and CF samples, indicating a significant increase in total mucin concentration in CF samples (*P = 0.001). (B) Relationship between the osmotic pressure of human-derived mucus samples (measured with a 10-kDa membrane) and their total mucus concentration (i.e., % solids). Samples depicted were from normal (green circles) and CF (blue squares) sputum and undiluted airway mucus samples obtained from excised CF lungs at the time of transplantation (black triangles). Red dashed line represents the best fit with a log-log correlation coefficient of 0.928. Black horizontal dashed line represents the predicted osmotic pressure of the PCL. Note that mucus osmotic pressures above the black dashed line are predicted to produce PCL collapse.
Figure 11
Figure 11. Proposed effect of proteolytic cleavages on mucin integrity.
Two mucin monomers are depicted, with glycosylated tandem repeat mucin domains depicted in green and “naked” Cys domains and N and C termini depicted in gray. Enlargements (below) show naked N- and C-terminal protein regions, where the molecules that are susceptible to proteolysis (highlighted by lightning bolts) oligomerize (C- to C- and N- to N-) and cystein-rich regions that are also protease targets. Depending on the cleavage site(s), antibody immunoreactivity will be affected by these cleavages. Conversely, macromolecular integrity of the mucins are not immediately affected by cleavage, since the oligomers are held together by disulfide bonds.

Similar articles

Cited by

References

    1. Davis PB. Cystic fibrosis since 1938. Am J Respir Crit Care Med. 2006;173(5):475–482. doi: 10.1164/rccm.200505-840OE. - DOI - PubMed
    1. Button B, et al. A periciliary brush promotes the lung health by separating the mucus layer from airway epithelia. Science. 2012;337(6097):937–941. doi: 10.1126/science.1223012. - DOI - PMC - PubMed
    1. Fahy JV, Dickey BF. Airway mucus function and dysfunction. N Engl J Med. 2010;363(23):2233–2247. doi: 10.1056/NEJMra0910061. - DOI - PMC - PubMed
    1. Stoltz DA, et al. Cystic fibrosis pigs develop lung disease and exhibit defective bacterial eradication at birth. Sci Transl Med. 2010;2(29):29ra31. - PMC - PubMed
    1. Mott LS, et al. Distribution of early structural lung changes due to cystic fibrosis detected with chest computed tomography. J Pediatr. 2013;163(1):243–248 e243. - PubMed

Publication types

MeSH terms