. 2014 Jun 3;9(6):e93415.
doi: 10.1371/journal.pone.0093415. eCollection 2014.

HIV-1 subtype A gag variability and epitope evolution

Affiliations

HIV-1 subtype A gag variability and epitope evolution

Syed Hani Abidi et al. PLoS One. .

Abstract

Objective: The aim of this study was to examine the course of time-dependent evolution of HIV-1 subtype A on a global level, especially with respect to the dynamics of immunogenic HIV gag epitopes.

Methods: We used a total of 1,893 HIV-1 subtype A gag sequences representing a timeline from 1985 through 2010, and 19 different countries in Africa, Europe and Asia. The phylogenetic relationship of subtype A gag and its epidemic dynamics was analysed through a Maximum Likelihood tree and Bayesian Skyline plot, genomic variability was measured in terms of G → A substitutions and Shannon entropy, and the time-dependent evolution of HIV subtype A gag epitopes was examined. Finally, to confirm observations on globally reported HIV subtype A sequences, we analysed the gag epitope data from our Kenyan, Pakistani, and Afghan cohorts, where both cohort-specific gene epitope variability and HLA restriction profiles of gag epitopes were examined.

Results: The most recent common ancestor of the HIV subtype A epidemic was estimated to be 1956 ± 1. A period of exponential growth began about 1980 and lasted for approximately 7 years, stabilized for 15 years, declined for 2-3 years, then stabilized again from about 2004. During the course of evolution, a gradual increase in genomic variability was observed that peaked in 2005-2010. We observed that the number of point mutations and novel epitopes in gag also peaked concurrently during 2005-2010.

Conclusion: It appears that as the HIV subtype A epidemic spread globally, changing population immunogenetic pressures may have played a role in steering immune-evolution of this subtype in new directions. This trend is apparent in the genomic variability and epitope diversity of HIV-1 subtype A gag sequences.


Conflict of interest statement

Competing Interests: The authors have declared that no competing interests exist.

Figures

Figure 1
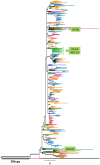
Figure 1. Maximum likelihood (ML) tree of HIV-1 subtype A gag gene sequences.
ML tree was used to infer phylogenetic relationship among the 1,893 HIV-1 subtype A gag sequences submitted to the LANL HIV Sequence Database, representing the years 1985 to 2010. Grey shaded area shows the outgroup sequence SIVcpz gag, that was also used to root the tree. Sequences from year-groups 1985–1990, 1990–1995, 1995–2000, 2000–2005, and 2005–2010 are shown in red, blue, orange, pink and green colour, respectively. The Green shaded area indicates sequences from Afghanistan and Pakistan that were found to group together. The green boxes indicate position and number of Afghan (AFG) and Pakistani (PK) sequences present in the tree. Nodes with bootstrap values >90, >80 and >70 are indicated by red, green and orange circles, respectively.
Figure 2
Figure 2. HIV-1 subtype A effective population size and time for most recent common ancestor.
Bayesian Skyline plot, based on a ‘relaxed clock’ coalescent framework analysis, was constructed using 113 sequences (representing all years and countries). X-axis represents time in years, while Y-axis shows the effective population size. The thick black line represents the median, while the blue band represents 95% highest posterior density (HPD) intervals. The tMRCA of HIV-1 subtype A is indicated by a black dotted line and red box, while the time for the 1985 sequence, which was the oldest reported HIV subtype A strain in the LANL Sequence Database) is indicated by a red arrow. Red, light blue and green shaded areas represent the period of increase in viral effective population size, plateau phase, and decline, respectively.
Figure 3
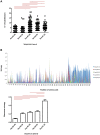
Figure 3. Time-dependent changes in HIV-1 subtype A genomic variability.
HIV-1 gag variability was measured for all five year-groups using a) G→A substitutions and b) Shannon entropy. a) G→A substitutions: Small black circles represent number of substitutions for each sequence; grey lines show the mean for a particular year-group. The red line over the scatter plot represents statistically significant (p<0.001) differences between groups. b) Shannon entropy analysis: The vertical axis represents entropy scores, while the horizontal axis shows position of amino acids in the gag gene. Shannon entropy scores for each year-group are represented in the following colors: 1985–90 (turquoise), 1990–95 (purple), 1995–00 (green), 2000–05 (red) and 2005–2010 (blue) Insert: Mean entropy score for each year-group was calculated and plotted using GraphPad software. Red line over bars represents a statistically significant difference between the groups (p<0.001). Error bars represent the standard error of the mean.
Figure 4
Figure 4. Divergence and evolution of HIV-1 subtype A gag epitopes.
Bar chart summarizing epitope data for each year-group. Black bars show the total number of gag epitopes observed for each year-group, white bars represent epitope variability (total number of mutations in all epitope sequence in year-group/total number of epitopes in a year-group), and grey bars indicate novel epitopes that were observed for each year-group.
Figure 5
Figure 5. Cohort-specific analysis of HIV-1 subtype A gag gene and epitope variability.
A) Genomic variability was measured for sequences from our Afghan, Pakistani and Kenyan cohorts using A) G→A substitutions and Shannon entropy. G→A substitutions (right): Small black circles represent the number of substitutions for each sequence, while the grey lines show the mean for a particular cohort. Shannon entropy analysis (left): A single star over bars represents a statistically significant (p<0.001) difference between the groups. The red bars represent standard error of mean. B) Bar chart summarizing the epitope data for Kenyan, Pakistani and Afghan study cohorts. Black bars show the total number of gag epitopes observed for each cohort, white bars represent epitope variability (total number of mutations in all epitope sequence in cohort/total number of epitopes in a cohorts), and the grey bars show the unique epitopes observed for each year-group, C) All epitopes and their corresponding predicted HLA restriction patterns that were identified in HIV-1 subtype A gag sequences for the three study cohorts. Epitopes observed in Pakistan and Afghan cohorts are highlighted red, while epitopes specific to Kenyan cohort are highlighted blue. Red letters denote mutations observed in a particular epitope, while the grey highlighted rows represent epitopes for which loss or gain of HLA restriction pattern was observed. HLA highlighted in bold indicate alleles that were predominantly observed in the study cohorts (see Methods).

Similar articles

Cited by

References

    1. Brumme ZL, Walker BD (2009) Tracking the culprit: HIV-1 evolution and immune selection revealed by single-genome amplification. J Exp Med 206: 1215–1218. - PMC - PubMed
    1. Hewitt EW (2003) The MHC class I antigen presentation pathway: strategies for viral immune evasion. Immunology 110: 163–169. - PMC - PubMed
    1. Moore CB, John M, James IR, Christiansen FT, Witt CS, et al. (2002) Evidence of HIV-1 adaptation to HLA-restricted immune responses at a population level. Science 296: 1439–1443. - PubMed
    1. Ansari AS, Khanani MR, Abidi SH, Shah F, Shahid A, et al. (2011) Patterns of HIV infection among native and refugee Afghans. AIDS 25: 1427–1430. - PubMed
    1. Khan S, Rai MA, Khanani MR, Khan MN, Ali SH (2006) HIV-1 subtype A infection in a community of intravenous drug users in Pakistan. BMC Infect Dis 6: 164. - PMC - PubMed

Publication types