. 2014 Sep:69:169-79.
doi: 10.1016/j.nbd.2014.05.029. Epub 2014 Jun 2.

RanBP9 overexpression accelerates loss of dendritic spines in a mouse model of Alzheimer's disease

Affiliations

RanBP9 overexpression accelerates loss of dendritic spines in a mouse model of Alzheimer's disease

Ruizhi Wang et al. Neurobiol Dis. 2014 Sep.

Abstract

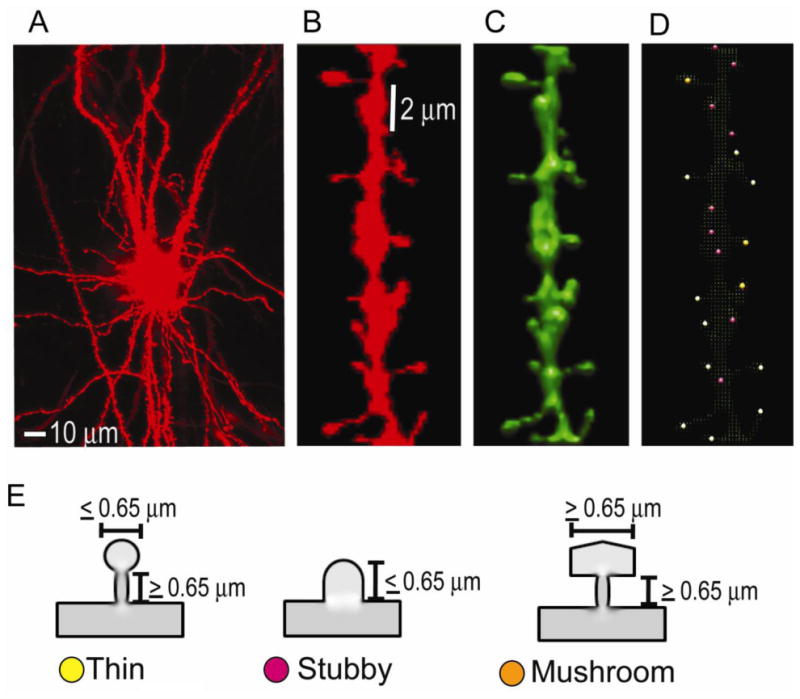
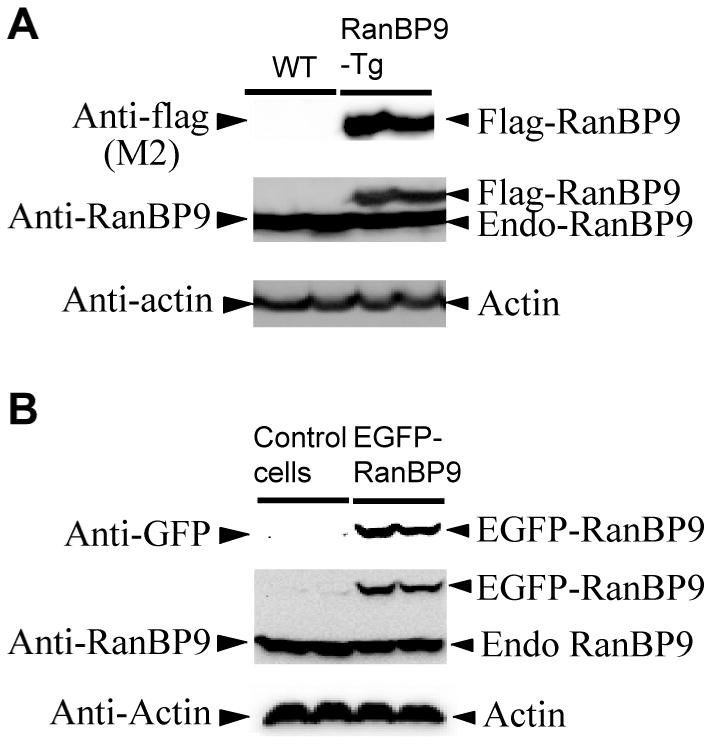
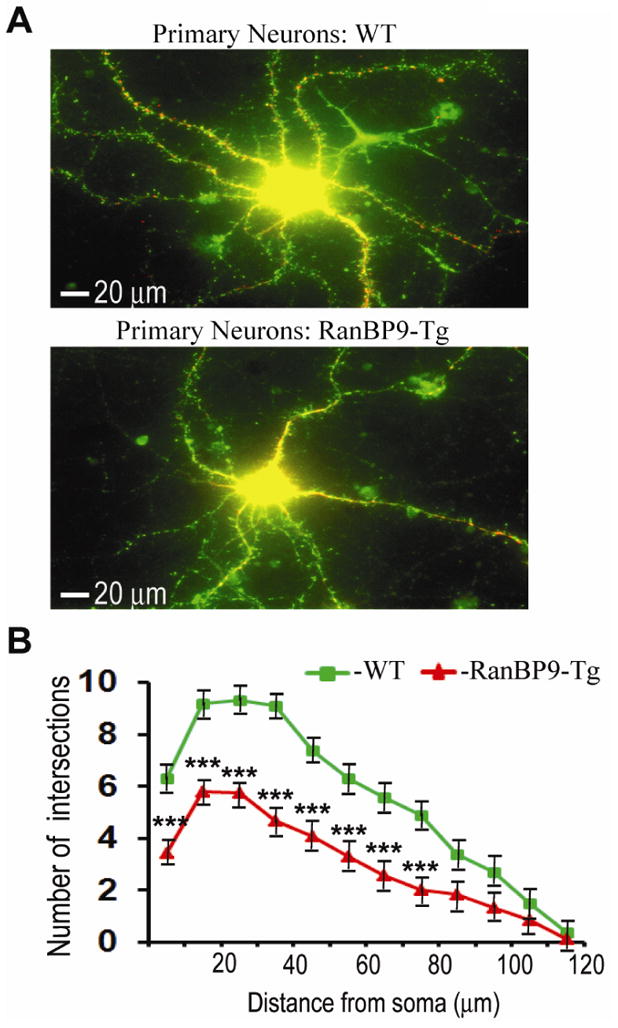
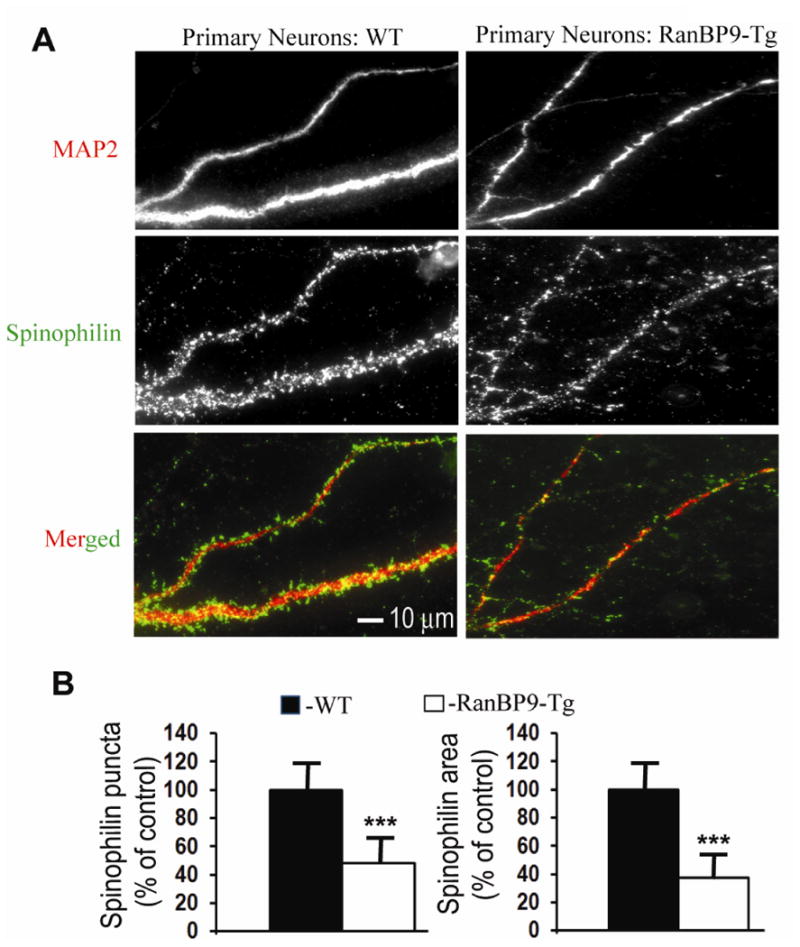
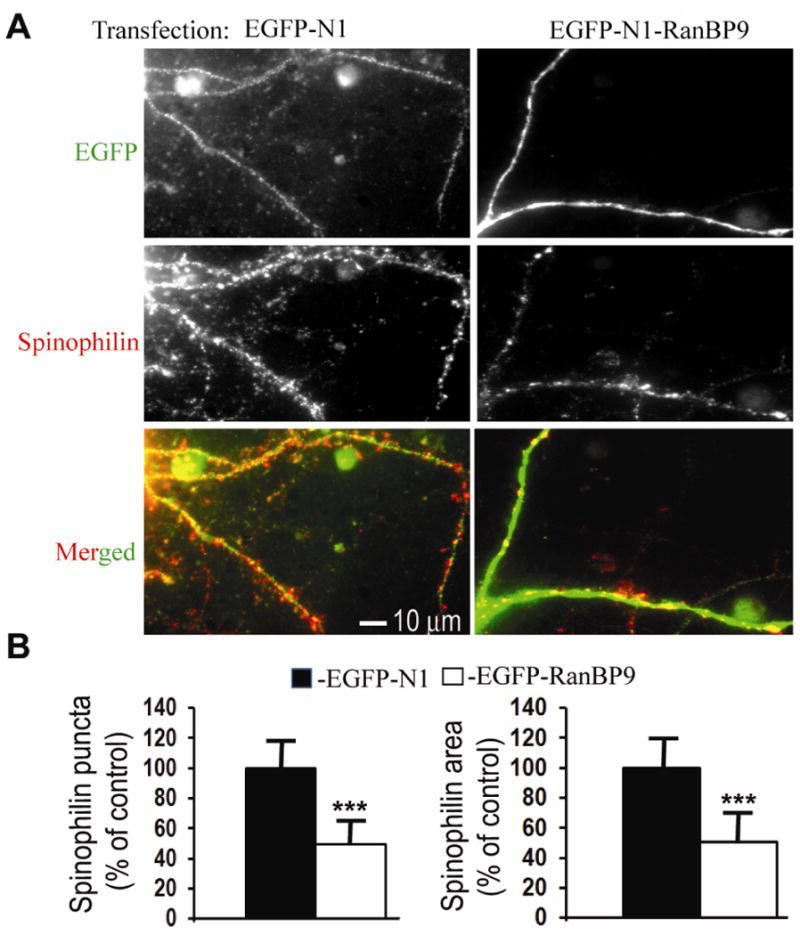
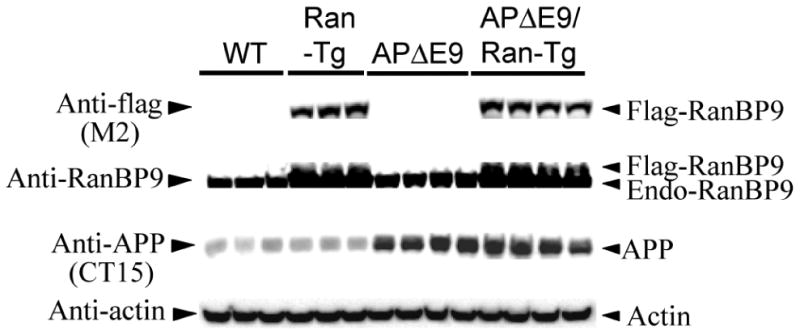
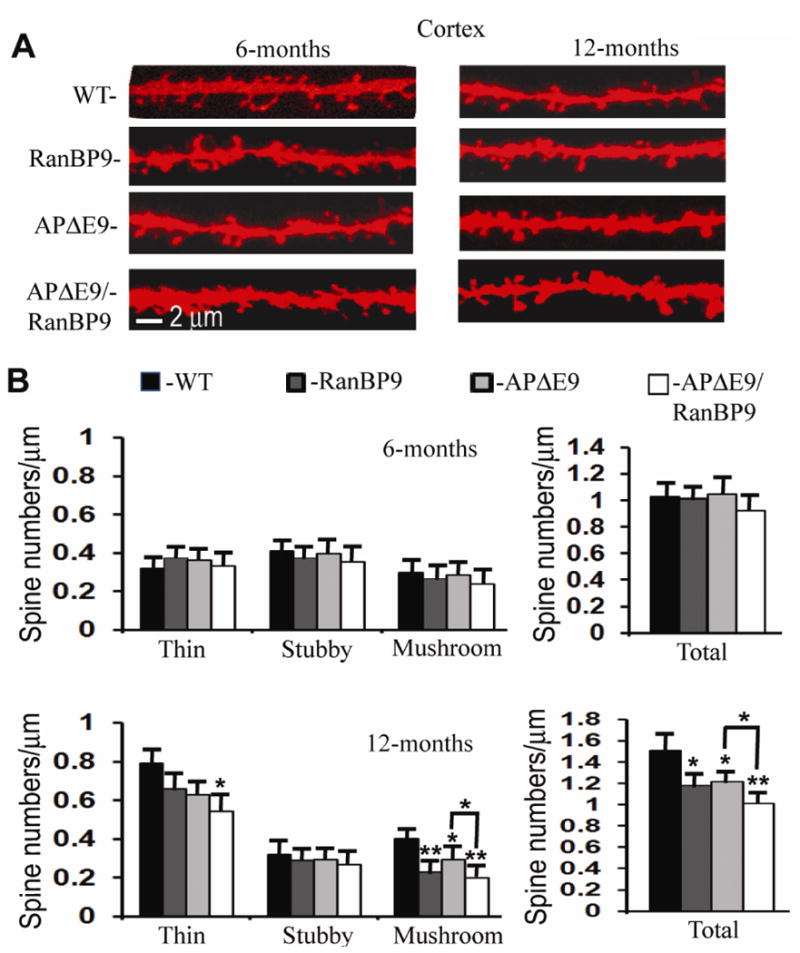
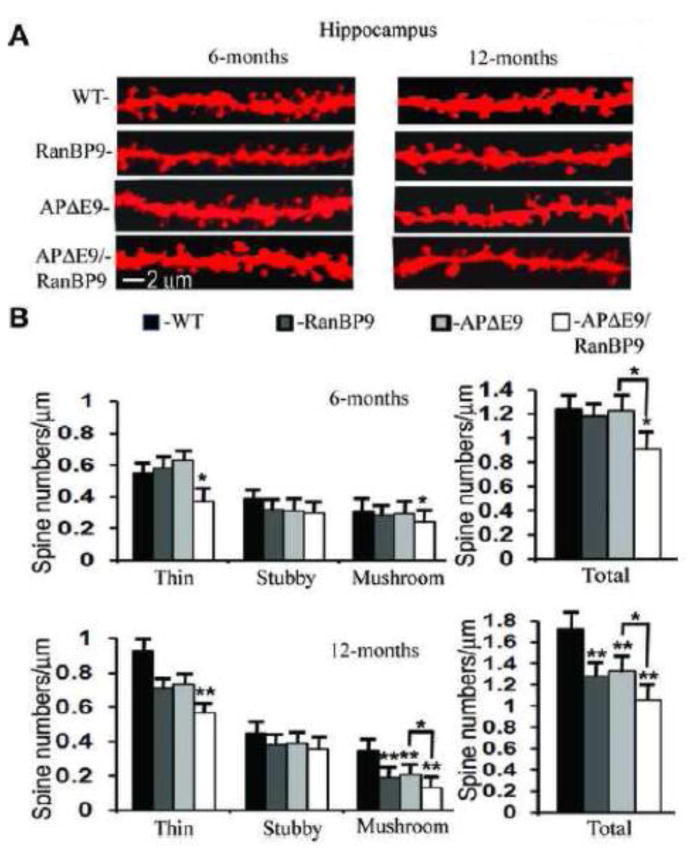
We previously demonstrated that RanBP9 overexpression increased Aβ generation and amyloid plaque burden, subsequently leading to robust reductions in the levels of several synaptic proteins as well as deficits in the learning and memory skills in a mouse model of Alzheimer's disease (AD). In the present study, we found striking reduction of spinophilin-immunoreactive puncta (52%, p<0.001) and spinophilin area (62.5%, p<0.001) in the primary cortical neurons derived from RanBP9 transgenic mice (RanBP9-Tg) compared to wild-type (WT) neurons. Similar results were confirmed in WT cortical neurons transfected with EGFP-RanBP9. At 6-months of age, the total spine density in the cortex of RanBP9 single transgenic, APΔE9 double transgenic and APΔE9/RanBP9 triple transgenic mice was similar to WT mice. However, in the hippocampus the spine density was significantly reduced (27%, p<0.05) in the triple transgenic mice compared to WT mice due to reduced number of thin spines (33%, p<0.05) and mushroom spines (22%, p<0.05). This suggests that RanBP9 overexpression in the APΔE9 mice accelerates loss of spines and that the hippocampus is more vulnerable. At 12-months of age, the cortex showed significant reductions in total spine density in the RanBP9 (22%, p<0.05), APΔE9 (19%, p<0.05) and APΔE9/RanBP9 (33%, p<0.01) mice compared to WT controls due to reductions in mushroom and thin spines. Similarly, in the hippocampus the total spine density was reduced in the RanBP9 (23%, p<0.05), APΔE9 (26%, p<0.05) and APΔE9/RanBP9 (39%, p<0.01) mice due to reductions in thin and mushroom spines. Most importantly, RanBP9 overexpression in the APΔE9 mice further exacerbated the reductions in spine density in both the cortex (14%, p<0.05) and the hippocampus (16%, p<0.05). Because dendritic spines are considered physical traces of memory, loss of spines due to RanBP9 provided the physical basis for the learning and memory deficits. Since RanBP9 protein levels are increased in AD brains, RanBP9 might play a crucial role in the loss of spines and synapses in AD.

Keywords: APΔE9 mice; Cortex; Dendritic spines; Hippocampus; RanBP9; Transgenic mice.


Conflict of interest statement

Conflict of Interest: All the authors declare no conflict of interest.

Figures

Fig.1
Fig.1
An example of diolistic dye, Dil-stained confocal image of a neuron, dendritic segment and dendritic spines used in the study. (A), A cortical neuron completely filled with DiI throughout the soma and dendritic segments.(B), A 20 μm segment of a dendrite with different types of spines. (C), The reconstructed 3D image of the dendritic segment in B by the NeuronStudio software. (D), The NeuronStudio image of the dendrite with color-coded spine types classified based on head to neck ratio. Thin, yellow; stubby, magenta; mushroom, orange. (E), Schematic diagrams illustrating thin (yellow), stubby (magenta) and mushroom (orange) spines with the indicated neck and head diameters.
Fig. 2
Fig. 2
Confirmation of expression of flag-RanBP9 and EGFP-RanBP9 in primary cortical neurons. (A), Lysates prepared from cortical neurons derived from RanBP9-Tg mice at 21DIV were subjected to SDS-PAGE analysis and probed with flag antibody to detect flag-RanBP9 and RanBP9 monoclonal antibody to detect both flag-RanBP9 and endogenous RanBP9. (B), Primary cortical neurons derived from WT mice were transiently transfected on 19DIV with or without EGFP-RanBP9 and on 21DIV lysates were prepared and subjected to SDS-PAGE analysis. GFP antibody detected the expression of EGFP-RanBP9 and RanBP9 antibody detected both EGFP-RanBP9 and endogenous RanBP9. Actin was detected as a loading control.
Fig. 3
Fig. 3
RanBP9 overexpression reduces dendritic outgrowth of primary cortical neurons at 21DIV. (A), Cortical neurons were derived from either WT or RanBP9-Tg mice and cultures were maintained until 21DIV. Neurons were co-stained with anti-MAP2 (red, 1:150 dilution) to stain the dendritic arbor and anti-spinophilin (green, 1:150 dilution) to stain dendritic spines and a representative merged image for each of WT and RanBP9-Tg neurons are shown. (B), Sholl analysis revealed the extent of reduction in the number of intersections. The ordinate represents the distance from soma in μm and the abscissa represents number of dendritic intersections that cross along the concentric circles at defined distance from soma. Significant differences in the dendritic arbor were revealed by ANOVA followed by post hoc test. ***, p<0.001 in RanBP9 cortical neurons versus WT. The data are mean + SEM of 30 neurons in three independent experiments.
Fig. 4
Fig. 4
Spinophilin-immunoreactive puncta are robustly decreased in primary cortical neurons derived from RanBP9-Tg mice. (A), Primary cortical neurons derived from P0 pups of RanBP9-Tg mice or WT mice were cultured and maintained for 21DIV. At 21DIV, the neurons were co-immunostained for MAP2 to label the dendritic arbor (red) and spinophilin to label spines (green) and the images were acquired in their respective channels. Merged images show spinophilin-immunoreactive puncta on the dendrites. (B), Quantitation of the number of spinophilin-immunoreactive puncta and the spinophilin area by image J showed significantly reduced numbers in the cortical neurons derived from RanBP9-Tg mice compared to WT neurons. Student's t-test revealed significant differences. ***, p<0.001 in the RanBP9-Tg neurons compared to WT neurons. The data are mean ± SEM, n=3 independent experiments with 12 neurons analyzed per experiment.
Fig. 5
Fig. 5
Spinophilin-immunoreactive puncta are robustly decreased in primary cortical neurons transiently overexpressing RanBP9. (A), Primary cortical neurons derived from P0 pups of WT mice were cultured and maintained until 15DIV. At 16DIV, the neurons were transiently transfected with either an EGFP-N1-RanBP9-FL construct or the control vector EGFP-N1 by a nanoparticle- based transfection reagent, Neuromag (magnetofection). At 21DIV, the neurons were co-immunostained for GFP to label the dendritic arbor (green) and spinophilin to label spines (red) and the images were acquired in their respective channels. Merged images show spinophilin-immunoreactive puncta on the dendrites. (B), Quantitation of the number of spinophilin-immunoreactive puncta and the spinophilin area by image J showed significantly reduced numbers in the cortical neurons transfected with EGFP-RanBP9 compared to neurons transfected with the EGFP-N1 control vector. Student's t-test revealed significant differences. ***, p<0.001 in the cortical neurons transfected with EGFP-RanBP9 compared to EGFP-N1 vector transfected neurons. The data are mean ± SEM, n=3 independent experiments with 12 neurons analyzed per experiment.
Fig. 6
Fig. 6
Confirmation of transgenes expression in the RanBP9 single transgenic, APΔE9 double transgenic and APΔE9/RanBP9 triple transgenic mice. Brain homogenates prepared from different genotypes of mice and age-matched WT controls at 6-months of age were subjected to SDS-PAGE electrophoresis and probed with anti-flag antibody to detect exogenously expressed flag-tagged RanBP9 in the RanbP9-Tg mice and triple transgenic mice only (panel 1). RanBP9-specific monoclonal antibody confirmed the expression of exogenously expressed flag-RanBP9 as well as endogenous RanBP9 (panel 2). The CT15 antibody (epitope last 15 residues of APP) detected exogenously expressed APP only in the APΔE9 and APΔE9/RanBP9 genotypes (panel 3). Actin was used as loading control (panel 4).
Fig. 7
Fig. 7
RanBP9 overexpression reduces total spine density in the cortex at 12-months of age but not at 6 months. (A), Representative examples of dendrite and spine morphologies of cortical neurons at 6- and 12-monthsof age used for quantitation of spines in different genotypes of mice. (B), Quantitation of Image-pro and NeuronStudio-processed images of 12-month old mice revealed significant reductions in total spines in the RanBP9-Tg (22%), APΔE9 (19%), and APΔE9/RanBP9 (33%) mice compared to WT mice. APΔE9/RanBP9 mice showed further reductions in total spines compared to APΔE9 (14%) mice. The reduction in total spines is due to reduced mushroom spines in the RanBP9-Tg (23%), and APΔE9 (28%) genotypes, while in the APΔE9/RanBP9-Tg genotype the reduction was due to both thin (32%) and mushroom spines (50%). ANOVA followed by post hoc Bonferroni multiple comparison test revealed significant differences. *, p<0.05, **, p<0.01 as indicated compared to WT mice or APΔE9 mice. The data are mean ± SEM, n=5 mice for each genotype.
Fig. 8
Fig. 8
RanBP9 overexpression accelerates loss of spines in the hippocampus at both 6- and 12-months of age. (A), Representative examples of dendrite and spine morphologies of hippocampal neurons at 6- and 12-months of age used for quantitation of spines in different genotypes of mice. (B), Quantitation of Image-pro and NeuronStudio-processed images of 6- month old mice revealed a significant reduction in total spines only in the APΔE9/RanBP9 mice (27%), compared to WT mice which was due to reduced numbers of thin spines (33%) and mushroom spines (22%). At 12 months, reductions in total spines were evident in the RanBP9-Tg (23%), APΔE9 (26%) and APΔE9/RanBP9 mice (39%) compared to WT mice. The reduction in total spines in the APΔE9 mice (46%) and in ranBP9-Tg mice (40%) is due to reductions in the mushroom spines, while in the APΔE9/RanBP9 mice the reductions were due to reduced levels of both thin (39%) and mushroom (63%) spines. ANOVA followed by post hoc Bonferroni multiple comparison test revealed significant differences. *, p<0.05, **, p<0.01 as indicated compared to WT mice or APΔE9 mice. The data are mean ± SEM, n=5 mice for each genotype.

Similar articles

Cited by

References

    1. Alvarez VA, Sabatini BL. Anatomical and physiological plasticity of dendritic spines. Ann Rev Neurosci. 2007;30:79–97. - PubMed
    1. Arefin AS, Mathieson L, Johnstone D, Berretta R, Moscato P. Unveiling clusters of RNA transcript pairs associated with markers of Alzheimer's disease progression. PLoS One. 2012;7:e45535. - PMC - PubMed
    1. Auffret A, Gautheron V, Repici M, Kraftsik R, Mount HT, Mariani J, et al. Age-dependent impairment of spine morphology and synaptic plasticity in hippocampal CA1 neurons of a presenilin1 transgenic mouse model of Alzheimer's disease. J Neurosci. 2009;29:10144–10152. - PMC - PubMed
    1. Battaglia F, Wang HY, Ghilardi MF, Gashi E, Quartarone A, Friedman E, et al. Cortical plasticity in Alzheimer's disease in humans and rodents. Biol Psychiatry. 2007;62:1405–1412. - PubMed
    1. Bernstein BW, Bamburg JR. ADF/cofilin: a functional node in cell biology. Trends Cell Biol. 2010;20:187–195. - PMC - PubMed

Publication types

MeSH terms