

Breast density assessment using a 3T MRI system: comparison among different sequences
- PMID: 24892933
- PMCID: PMC4044003
- DOI: 10.1371/journal.pone.0099027
Breast density assessment using a 3T MRI system: comparison among different sequences
Abstract
Purpose: To compare MRI sequences for breast density measurements on a 3T MRI system using IDEAL (Iterative Decomposition of water and fat with Echo Asymmetry and Least squares estimation) as possible physiology-like reference.
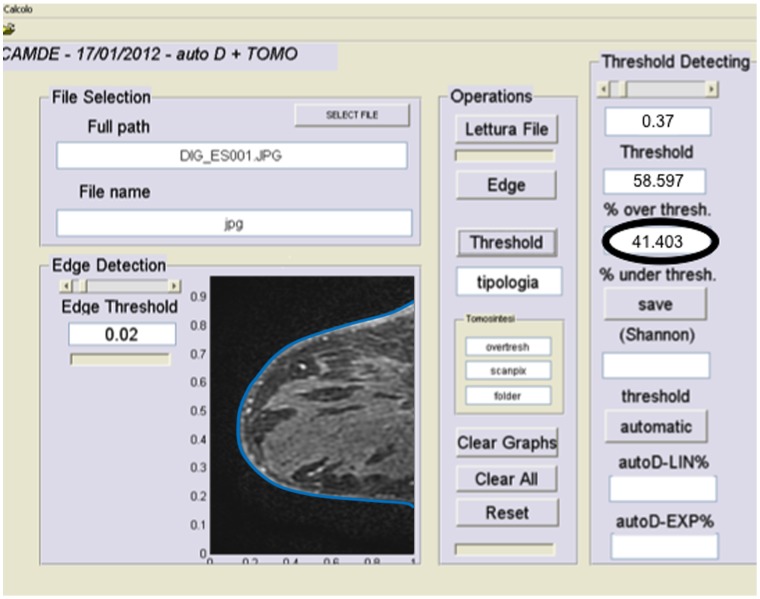
Materials and methods: MRI examination was performed in 48 consecutive patients (mean age 41, years; range, 35-67 years) on a 3.0T scanner and 46 were included. All (fertile) women, were examined between days 5 and 15 of their menstrual cycle. MRI protocol included: T1-turbo spin-echo (T1-tSE), T2-turbo spin-echo (T2-tSE), VIBRANT (Volume Imaging for Breast Assessment) before and after injection of contrast media and IDEAL. Breast density was calculated with semi-automated software. Statistical analysis was performed with non-parametric tests.
Results: Mean percentage of breast density calculated in each sequence was: T1-tSE = 56%; T2-tSE = 52%; IDEAL FatOnly = 55%; IDEAL WaterOnly = 53%, VIBRANT = 55%. Significant differences were observed between T2-tSE and both T1-tSE (p<0.001), VIBRANT sequences (p = 0.009), T1-tSE and both IDEAL WaterOnly (p = 0.007) and IDEAL FatOnly (p = 0.047). Breast density percentage showed a positive linear correlation among different sequences: r ≥ 0.93.
Conclusions: Differences exist between MRI sequences used to assess breast density percentage. T1-weighted sequences values were similar to IDEAL sequences.
Conflict of interest statement
Figures
References
-
- McCormack VA, Dos SSI (2006) Breast density and parenchymal patterns as markers of breast cancer risk: a meta-analysis. Cancer Epidemiol Biomarkers Prev 15: 1159–1169. - PubMed
-
- Houssami N, Kerlikowske K (2012) The impact of breast density on breast cancer risk and breast screening. Curr Breast Cancer Rep doi:10.1371/journal.pmed.0020298 - DOI
-
- Harvey JA, Bovbjerg VE (2004) Quantitative assessment of mammographic breast density: relationship with breast cancer risk. Radiology 230: 29–41. - PubMed
-
- Diorio C, Pollak M, Byrne C, Mâsse B, Hébert-Croteau N, et al. (2004) Insulin-like growth factor-I, IGF-binding protein-3, and mammographic breast density. Cancer Epidemiol Biomarkers Prev 14: 1065–1073. - PubMed
Publication types
MeSH terms
LinkOut - more resources
Full Text Sources
Other Literature Sources
Medical
