

MR elastography for the assessment of hepatic fibrosis in patients with chronic hepatitis B infection: does histologic necroinflammation influence the measurement of hepatic stiffness?
- PMID: 24893048
- PMCID: PMC4263647
- DOI: 10.1148/radiol.14132592
MR elastography for the assessment of hepatic fibrosis in patients with chronic hepatitis B infection: does histologic necroinflammation influence the measurement of hepatic stiffness?
Abstract
Purpose: To determine the diagnostic performance of magnetic resonance (MR) elastography for the staging of hepatic fibrosis and to evaluate the influence of necroinflammation on hepatic stiffness in patients with chronic hepatitis B virus (HBV) infection by using histopathologic findings as the reference standard.
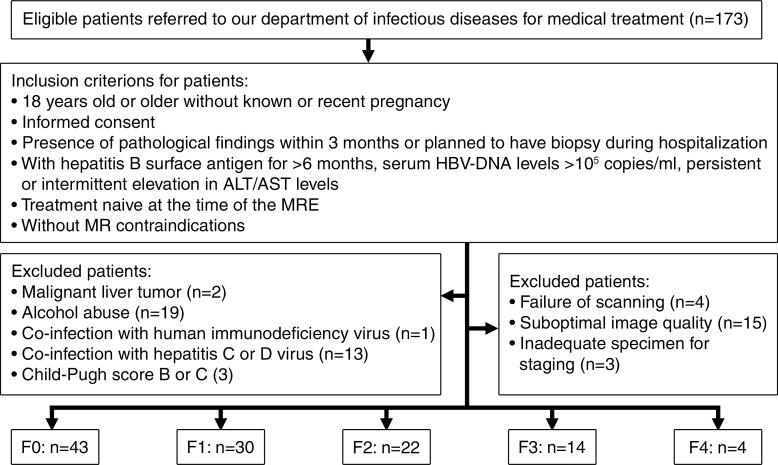
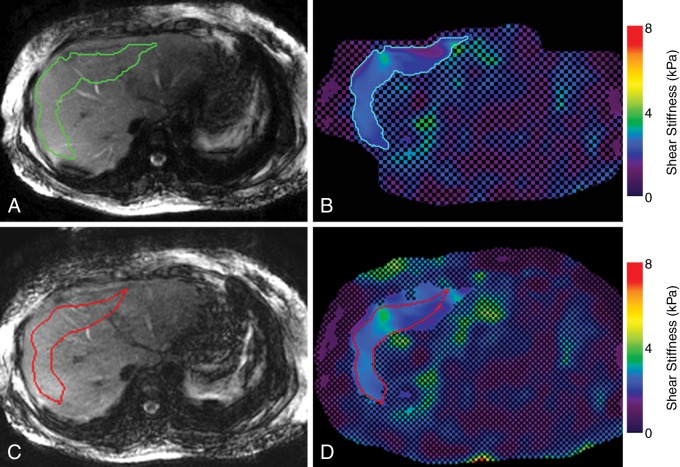
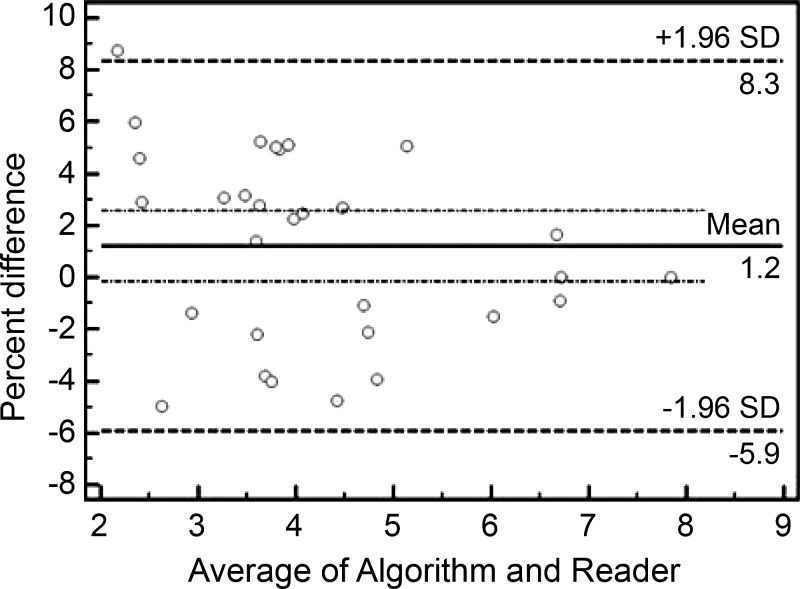
Materials and methods: One hundred thirteen consecutive patients with chronic HBV infection were recruited prospectively in this institutional review board-approved study after providing written informed consent between March 2012 and October 2013. The stiffness measurements were obtained by using two-dimensional gradient-echo MR elastography with a 3.0-T MR system. The METAVIR scoring system was used for the assessment of fibrosis ("F" stage) and necroinflammation ("A" grade). The predictive ability of MR elastography was evaluated by using the receiver operating characteristic (ROC) curve and the area under the ROC curve (AUC). Multiple linear regression analyses were conducted to determine the relationship between hepatic stiffness and the variables that showed a significant association in the univariate analysis or those that were of interest for comparison with earlier work (histologic scores, sex, age, aspartate aminotransferase level, and aspartate aminotransferase/alanine aminotransferase ratio).
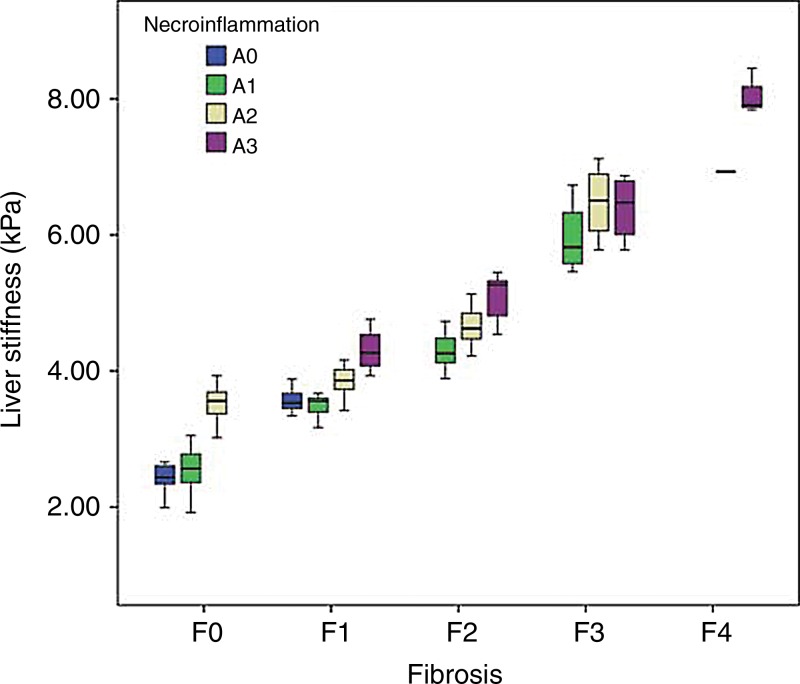
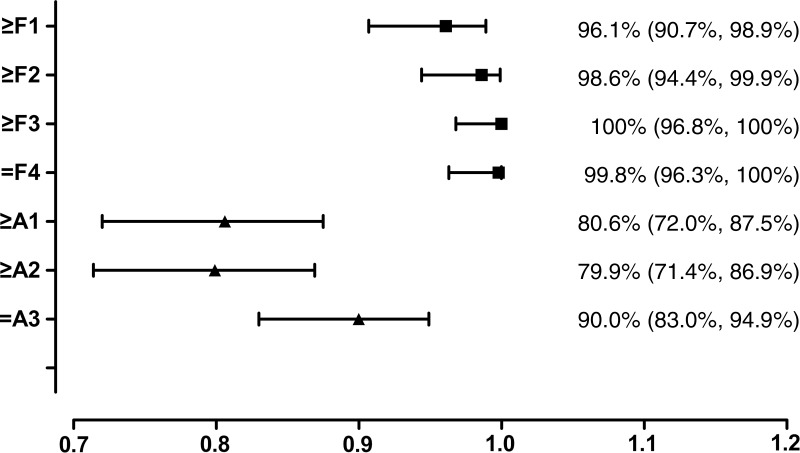
Results: MR elastography showed excellent performance for characterization of ≥ F1, ≥ F2, ≥ F3, and F4 findings, with AUC values of 0.961, 0.986, 1.000, and 0.998, respectively. It showed a moderate capability for evaluation of necroinflammatory activity of ≥ A1, ≥ A2, and A3 (AUC = 0.806, 0.834, and 0.906, respectively). Multiple linear regression analysis showed that fibrosis, necroinflammation, and sex were independently associated with hepatic stiffness (β = 0.799, 0.277, and 0.070, respectively; P < .05). For pairwise comparisons, log-transformed hepatic stiffness showed no difference between (a) groups F0/A2-3 and F1/A0-1 and (b) groups F1/A2-3 and F2/A0-1 (P > .99 and P = .486, respectively).
Conclusion: MR elastography demonstrated excellent performance for distinguishing the stages of hepatic fibrosis in patients with chronic HBV infection. For hepatic tissue with ≤ F2 fibrosis, necroinflammation can account for a substantial fraction of the increase in hepatic stiffness.
© RSNA, 2014.
Figures
References
-
- Ott JJ, Stevens GA, Groeger J, Wiersma ST. Global epidemiology of hepatitis B virus infection: new estimates of age-specific HBsAg seroprevalence and endemicity. Vaccine 2012;30(12):2212–2219. - PubMed
-
- Mohd Hanafiah K, Groeger J, Flaxman AD, Wiersma ST. Global epidemiology of hepatitis C virus infection: new estimates of age-specific antibody to HCV seroprevalence. Hepatology 2013;57(4):1333–1342. - PubMed
-
- European Association for the Study of the Liver . EASL clinical practice guidelines: Management of chronic hepatitis B virus infection. J Hepatol 2012;57(1):167–185. - PubMed
-
- Fattovich G, Olivari N, Pasino M, D’Onofrio M, Martone E, Donato F. Long-term outcome of chronic hepatitis B in Caucasian patients: mortality after 25 years. Gut 2008;57(1):84–90. - PubMed
-
- Fattovich G, Stroffolini T, Zagni I, Donato F. Hepatocellular carcinoma in cirrhosis: incidence and risk factors. Gastroenterology 2004;127(5,Suppl 1):S35–S50. - PubMed
Publication types
MeSH terms
Grants and funding
LinkOut - more resources
Full Text Sources
Other Literature Sources
Medical
Miscellaneous
