

Characterization of the Zn(II) binding properties of the human Wilms' tumor suppressor protein C-terminal zinc finger peptide
- PMID: 24893204
- PMCID: PMC4066921
- DOI: 10.1021/ic500862b
Characterization of the Zn(II) binding properties of the human Wilms' tumor suppressor protein C-terminal zinc finger peptide
Abstract
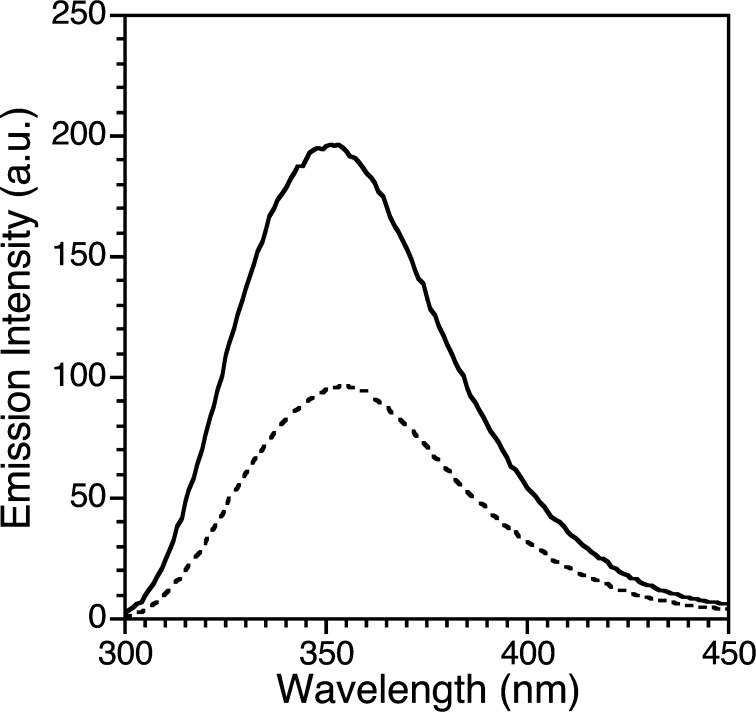
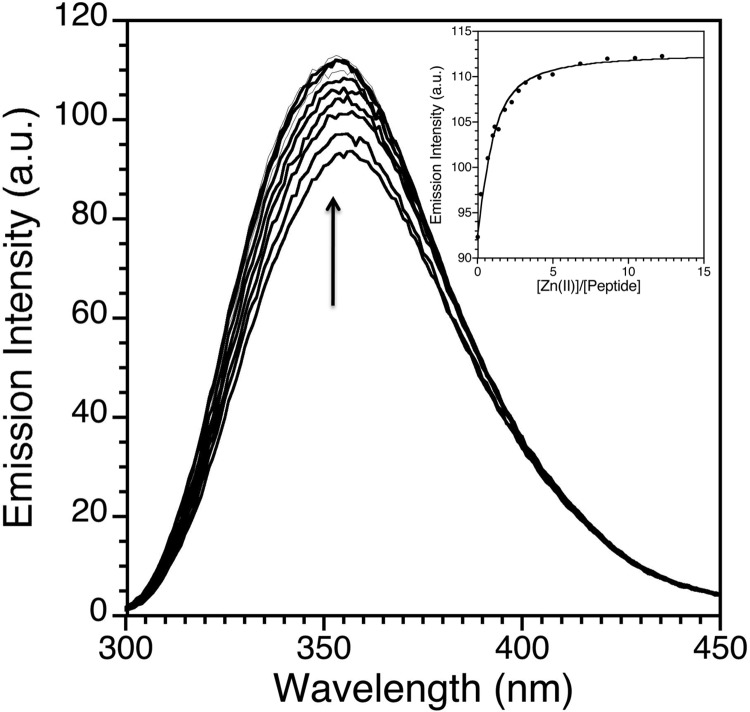
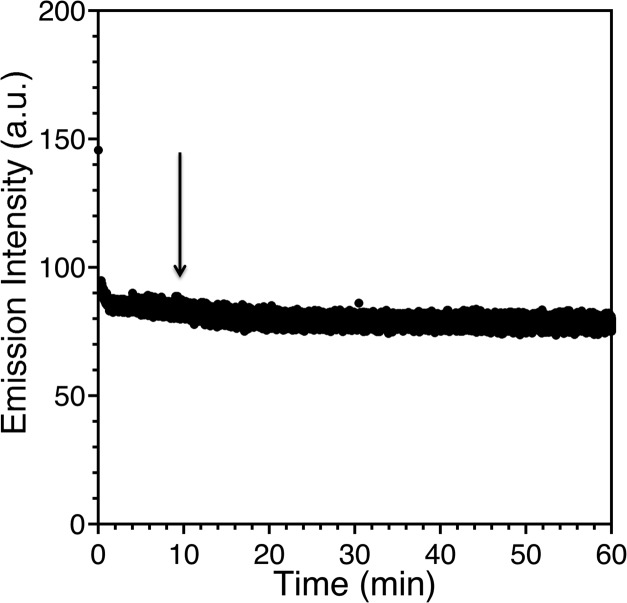
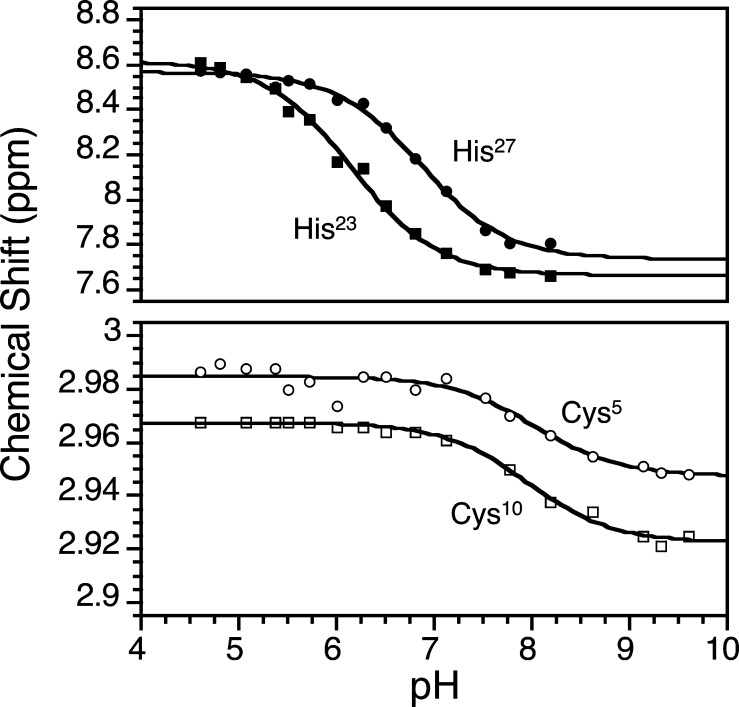
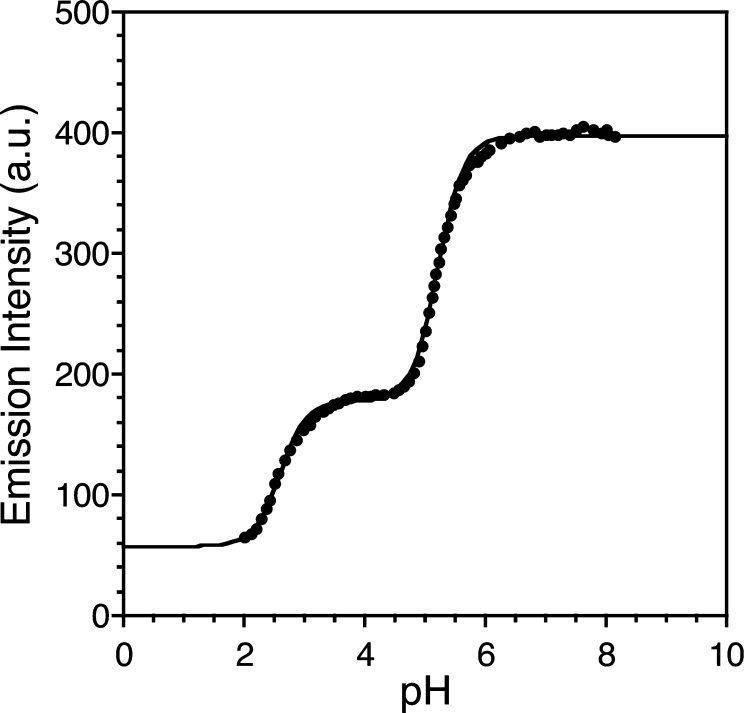
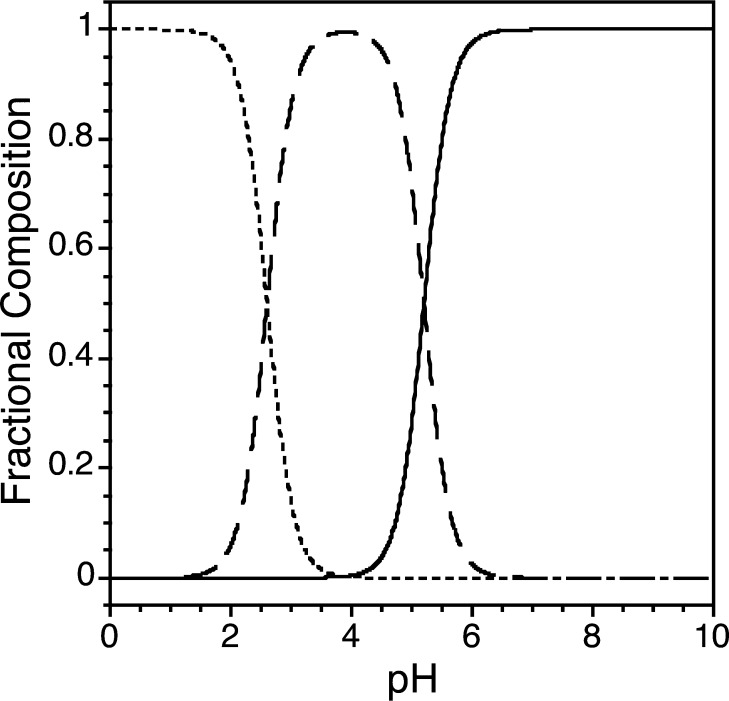
Zinc finger proteins that bind Zn(II) using a Cys2His2 coordination motif within a ββα protein fold are the most abundant DNA binding transcription factor domains in eukaryotic systems. These classic zinc fingers are typically unfolded in the apo state and spontaneously fold into their functional ββα folds upon incorporation of Zn(II). These metal-induced protein folding events obscure the free energy cost of protein folding by coupling the protein folding and metal-ion binding thermodynamics. Herein, we determine the formation constant of a Cys2His2/ββα zinc finger domain, the C-terminal finger of the Wilms' tumor suppressor protein (WT1-4), for the purposes of determining its free energy cost of protein folding. Measurements of individual conditional dissociation constants, Kd values, at pH values from 5 to 9 were determined using fluorescence spectroscopy by direct or competition titration. Potentiometric titrations of apo-WT1-4 followed by NMR spectroscopy provided the intrinsic pKa values of the Cys2His2 residues, and corresponding potentiometric titrations of Zn(II)-WT1-4 followed by fluorescence spectroscopy yielded the effective pKa(eff) values of the Cys2His2 ligands bound to Zn(II). The Kd, pKa, and pKa(eff) values were combined in a minimal, complete equilibrium model to yield the pH-independent formation constant value for Zn(II)-WT1-4, Kf(ML) value of 7.5 × 10(12) M(-1), with a limiting Kd value of 133 fM. This shows that Zn(II) binding to the Cys2His2 site in WT1-4 provides at least -17.6 kcal/mol in driving force to fold the protein scaffold. A comparison of the conditional dissociation constants of Zn(II)-WT1-4 to those from the model peptide Zn(II)-GGG-Cys2His2 over the pH range 5.0 to 9.0 and a comparison of their pH-independent Kf(ML) values demonstrates that the free energy cost of protein folding in WT1-4 is less than +2.1 kcal/mol. These results validate our GGG model system for determining the cost of protein folding in natural zinc finger proteins and support the conclusion that the cost of protein folding in most zinc finger proteins is ≤+4.2 kcal/mol, a value that pales in comparison to the free energy contribution of Zn(II) binding, -17.6 kcal/mol.
Figures


Similar articles
-
Deducing the energetic cost of protein folding in zinc finger proteins using designed metallopeptides.J Am Chem Soc. 2007 Oct 24;129(42):12815-27. doi: 10.1021/ja073902+. Epub 2007 Sep 29. J Am Chem Soc. 2007. PMID: 17902663
-
Evaluation of the Intrinsic Zn(II) Affinity of a Cys3His1 Site in the Absence of Protein Folding Effects.Inorg Chem. 2015 Jun 15;54(12):5942-8. doi: 10.1021/acs.inorgchem.5b00718. Epub 2015 May 27. Inorg Chem. 2015. PMID: 26016528
-
Why zinc fingers prefer zinc: ligand-field symmetry and the hidden thermodynamics of metal ion selectivity.Biochemistry. 2004 Nov 9;43(44):13910-25. doi: 10.1021/bi0491999. Biochemistry. 2004. PMID: 15518539
-
Effects of Denys-Drash syndrome point mutations on the DNA binding activity of the Wilms' tumor suppressor protein WT1.Biochemistry. 1996 Sep 17;35(37):12070-6. doi: 10.1021/bi960758o. Biochemistry. 1996. PMID: 8810912
-
DNA and RNA binding by the Wilms' tumour gene 1 (WT1) protein +KTS and -KTS isoforms-From initial observations to recent global genomic analyses.Eur J Haematol. 2018 Mar;100(3):229-240. doi: 10.1111/ejh.13010. Epub 2018 Jan 10. Eur J Haematol. 2018. PMID: 29240258 Review.
Cited by
-
p53 and Zinc: A Malleable Relationship.Front Mol Biosci. 2022 Apr 13;9:895887. doi: 10.3389/fmolb.2022.895887. eCollection 2022. Front Mol Biosci. 2022. PMID: 35495631 Free PMC article. Review.
-
Effect of Single-Residue Mutations on CTCF Binding to DNA: Insights from Molecular Dynamics Simulations.Int J Mol Sci. 2023 Mar 29;24(7):6395. doi: 10.3390/ijms24076395. Int J Mol Sci. 2023. PMID: 37047368 Free PMC article.
-
What Is the Correlation between Preeclampsia and Cancer? The Important Role of Tachykinins and Transition Metal Ions.Pharmaceuticals (Basel). 2023 Feb 28;16(3):366. doi: 10.3390/ph16030366. Pharmaceuticals (Basel). 2023. PMID: 36986466 Free PMC article. Review.
-
Exploration of the zinc finger motif in controlling activity of matrix metalloproteinases.J Phys Chem B. 2014 Nov 26;118(47):13505-12. doi: 10.1021/jp5088702. Epub 2014 Nov 14. J Phys Chem B. 2014. PMID: 25375834 Free PMC article.
-
Designing heterotropically activated allosteric conformational switches using supercharging.Proc Natl Acad Sci U S A. 2020 Mar 10;117(10):5291-5297. doi: 10.1073/pnas.1916046117. Epub 2020 Feb 25. Proc Natl Acad Sci U S A. 2020. PMID: 32098845 Free PMC article.
References
-
- Klug A. Q. Rev. Biophys. 2010, 43, 1–21. - PubMed
-
- Burdach J.; O’Connell M. R.; Mackay J. P.; Crossley M. Trends Biochem. Sci. 2012, 37, 199–205. - PubMed
-
- Stenmark H.; Aasland R. J. Cell Sci. 1999, 112, 4175–4183. - PubMed
-
- Kröncke K. D.; Klotz L. O. Antiox. Redox Signaling 2009, 11, 1015–1027. - PubMed
Publication types
MeSH terms
Substances
Grants and funding
LinkOut - more resources
Full Text Sources
Other Literature Sources
Medical
