. 2014 Jun;33(6):1275-89.
doi: 10.1109/TMI.2014.2308894.

Radial basis functions for combining shape and speckle tracking in 4D echocardiography

Radial basis functions for combining shape and speckle tracking in 4D echocardiography

Colin B Compas et al. IEEE Trans Med Imaging. 2014 Jun.

Erratum in

Abstract

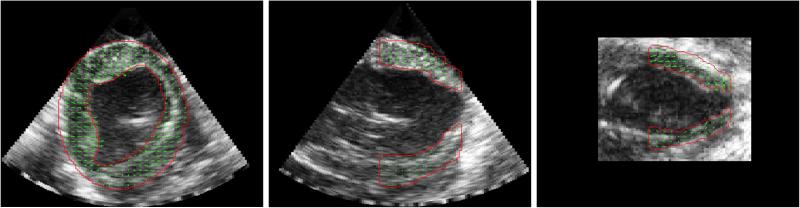
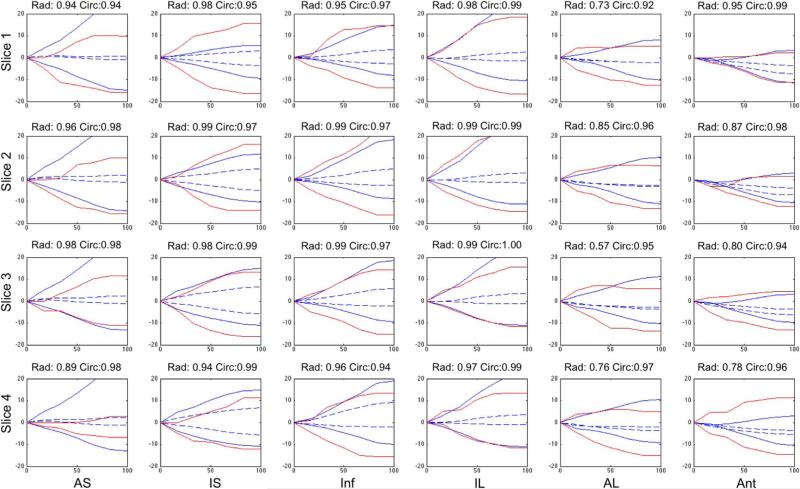
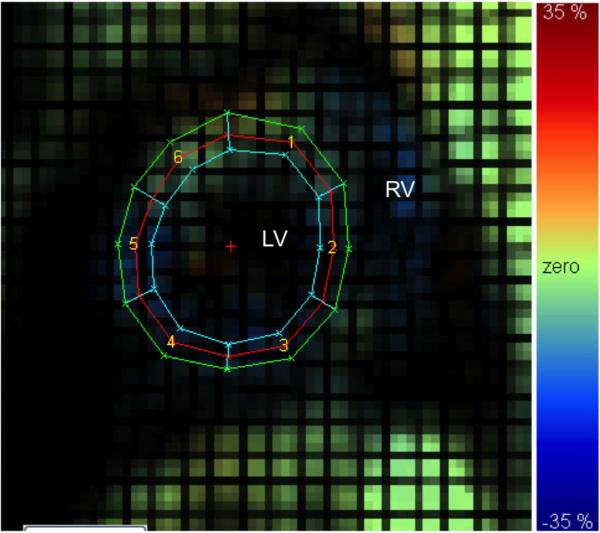
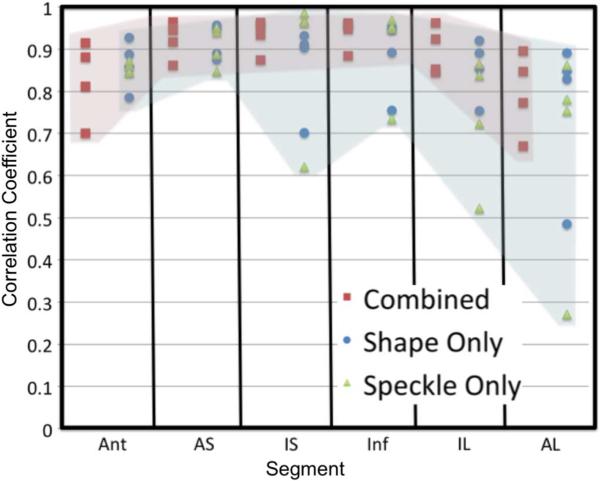
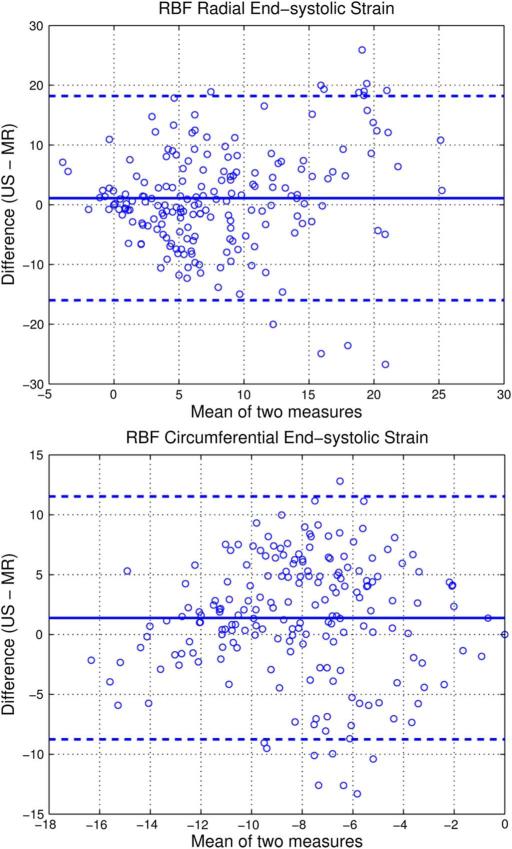
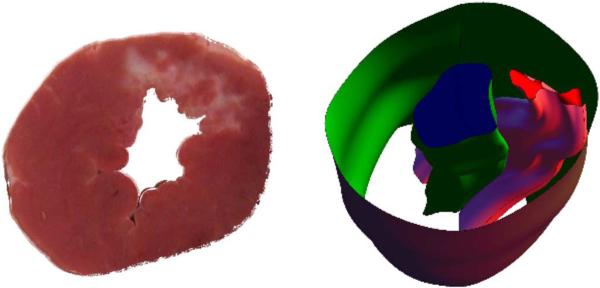
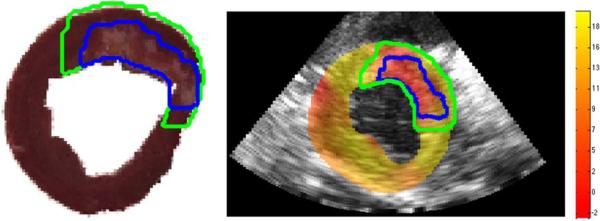
Quantitative analysis of left ventricular deformation can provide valuable information about the extent of disease as well as the efficacy of treatment. In this work, we develop an adaptive multi-level compactly supported radial basis approach for deformation analysis in 3D+time echocardiography. Our method combines displacement information from shape tracking of myocardial boundaries (derived from B-mode data) with mid-wall displacements from radio-frequency-based ultrasound speckle tracking. We evaluate our methods on open-chest canines (N=8) and show that our combined approach is better correlated to magnetic resonance tagging-derived strains than either individual method. We also are able to identify regions of myocardial infarction (confirmed by postmortem analysis) using radial strain values obtained with our approach.


Figures

Fig. 1
Fig. 1
Red dots indicate center locations added at each level of the adaptive algorithm.
Fig. 2
Fig. 2
(a) Sparse input vectors with shape tracking (red: epicardial, purple: endocardial), and speckle tracking (green). (b) Corresponding dense 3D myocardial radial strain map showing normal thickening in most regions (red for positive strain) and dyskinesis in the infarct (blue for negative strain) near ES.
Fig. 3
Fig. 3
Graphic representation of the four slices and six segments used to compare ultrasound-derived strains to MR tagging-derived strains.
Fig. 4
Fig. 4
Radial (solid), circumferential (dashed), and longitudinal (dotted) strain curves in percent strain derived from 4DE as a function of percent systole from a single representative canine six weeks post-MI.
Fig. 5
Fig. 5
Representative ED image for three perpendicular image planes of the ED B-mode image with segmentation (red) and accumulated displacements at ES overlaid (green).
Fig. 6
Fig. 6
Radial (positive) and circumferential (negative) strain curves in % derived from 4DE using our method (solid blue) and from MR tagging using HARP analysis (solid red) for a single post-occlusion dog at the four slices shown in Fig. 3 ranging from the apex to the base (top to bottom) divided into six segments from anteroseptal (left) to anterior (right) as a function of percent systole. Correlation coefficients between the two methods for both radial and circumferential strains are shown in the title of each frame. Infarct region is in the top right plots. Strains derived using an FFD approach (dashed blue) are shown for comparison.
Fig. 7
Fig. 7
Sample MR tagged image with radial strain map overlaid. Left (LV) and right (RV) ventricle noted for reference. For segments 1) anteroseptal, 2) anterior, 3) anterolateral, 4) inferolateral, 5) inferior, and 6) inferoseptal. Color scale from –35% to 35%.
Fig. 8
Fig. 8
Correlation coefficients for radial strain calculated from the combined method and MR (red), shape tracking alone and MR (blue), and speckle tracking alone and MR (green). Images were divided into six segments at four slices, as shown in Fig. 3. Columns of the figure represent the six segments around the myocardium with four correlation values in each column. Colored shading highlights the range of correlation values from the combined method (red) compared to the two individual methods (blue).
Fig. 9
Fig. 9
Bland–Altman plots for radial (top) and circumferential (bottom) end-systolic strain % for all eight dogs across four image slices in six image segments for ultrasound compared to MR. Mean difference (solid blue line) and 95% confidence interval (dashed blue line) are shown on the graphs.
Fig. 10
Fig. 10
Sample slice of a postmortem heart (left). Infarcted tissue is white, while noninfarcted tissue is red. A 3D reconstruction of the myocardial boundaries with infarct zone (right). Infarct zone is the pink volume between the endoand epicardial surfaces.
Fig. 11
Fig. 11
Slice of the postmortem heart with the infarct border (blue) and peri-infarct border (green) defined (left). Corresponding slice of the 3D radial strain map in percent strain overlaid on the B-mode image at the terminal time point with the mapped infarct border (blue) and peri-infarct (green) border warped to the B-mode image (right).

Similar articles

Cited by

References

    1. Murray CJ, Jamison DT, Lopez AD, Ezzati M, Mathers CD. Global Burden of Disease and Risk Factors. World Bank, Oxford Univ. Press; Washington, DC: 2006. - PubMed
    1. Kramer C, Rogers W, Theobald T, Power T, Petruolo S, Reichek N. Remote noninfarcted region dysfunction soon after first anterior myocardial infarction. Circulation. 1996;94:660–666. - PubMed
    1. Marcus JT, Götte MJ, Van Rossum AC, Kuijer JP, Heethaar RM, Axel L, Visser CA. Myocardial function in infarcted and remote regions early after infarction in man: Assessment by magnetic resonance tagging and strain analysis. Magn. Reson. Med. 1997 Nov.38:803–810. - PubMed
    1. Kramer CM, Lima JA, Reichek N, Ferrari V. a., Llaneras MR, Palmon LC, Yeh IT, Tallant B, Axel L. Regional differences in function within noninfarcted myocardium during left ventricular remodeling. Circulation. 1993 Sep.88:1279–1288. - PubMed
    1. Bohs LN, Trahey GE. A novel method for angle independent ultrasonic imaging of blood flow and tissue motion. IEEE Biomed. Eng. 1991 Mar.38(3):280–286. - PubMed

Publication types