. 2014 Jun;26(6):2310-2350.
doi: 10.1105/tpc.114.124537. Epub 2014 Jun 3.

Systems Analysis of the Response of Photosynthesis, Metabolism, and Growth to an Increase in Irradiance in the Photosynthetic Model Organism Chlamydomonas reinhardtii

Affiliations

Systems Analysis of the Response of Photosynthesis, Metabolism, and Growth to an Increase in Irradiance in the Photosynthetic Model Organism Chlamydomonas reinhardtii

Tabea Mettler et al. Plant Cell. 2014 Jun.

Abstract

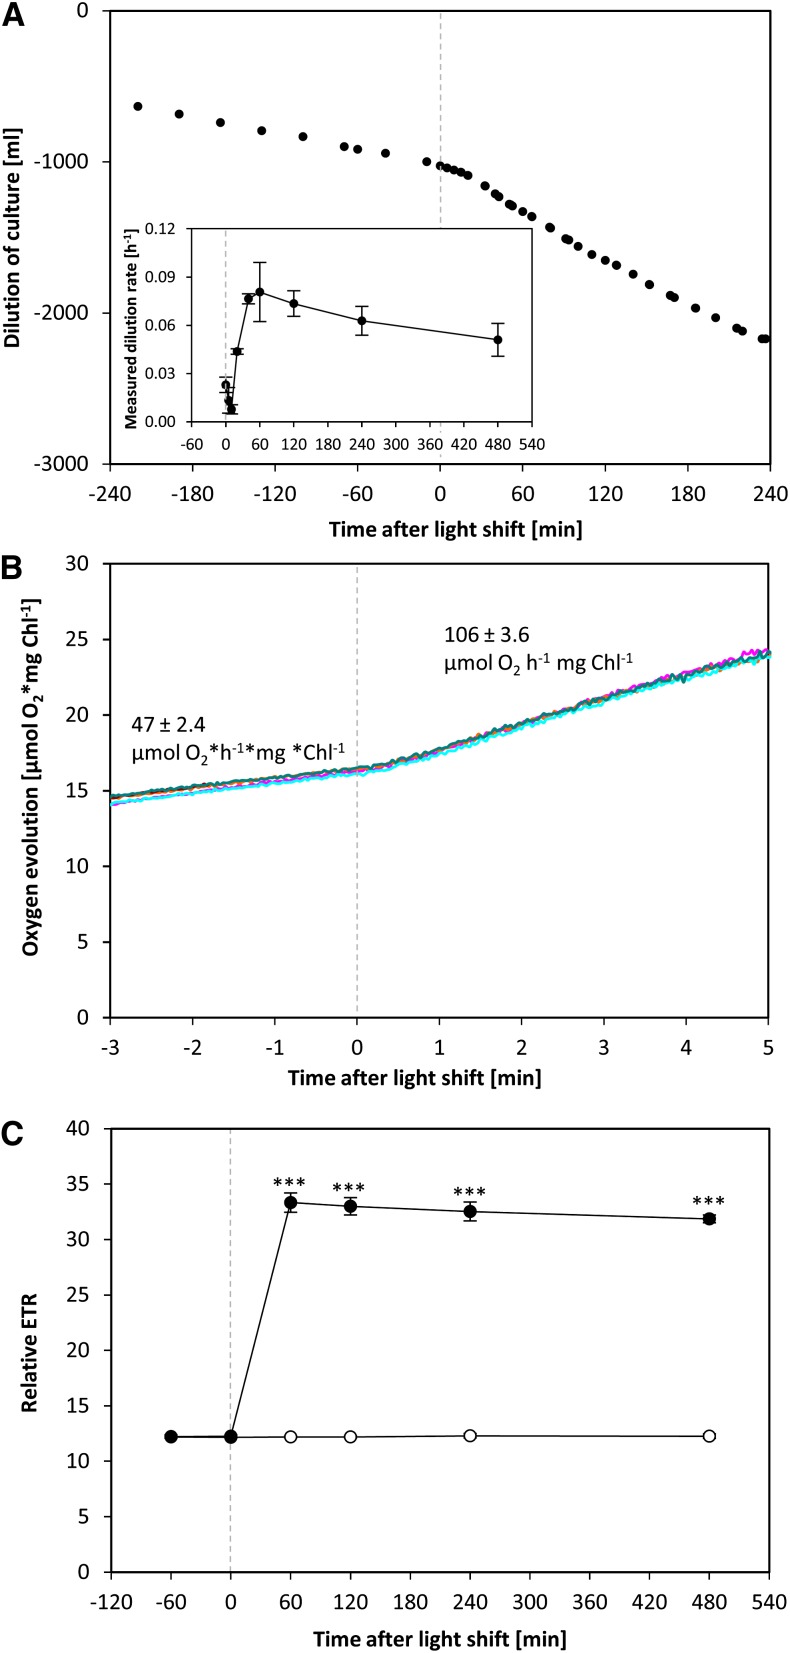
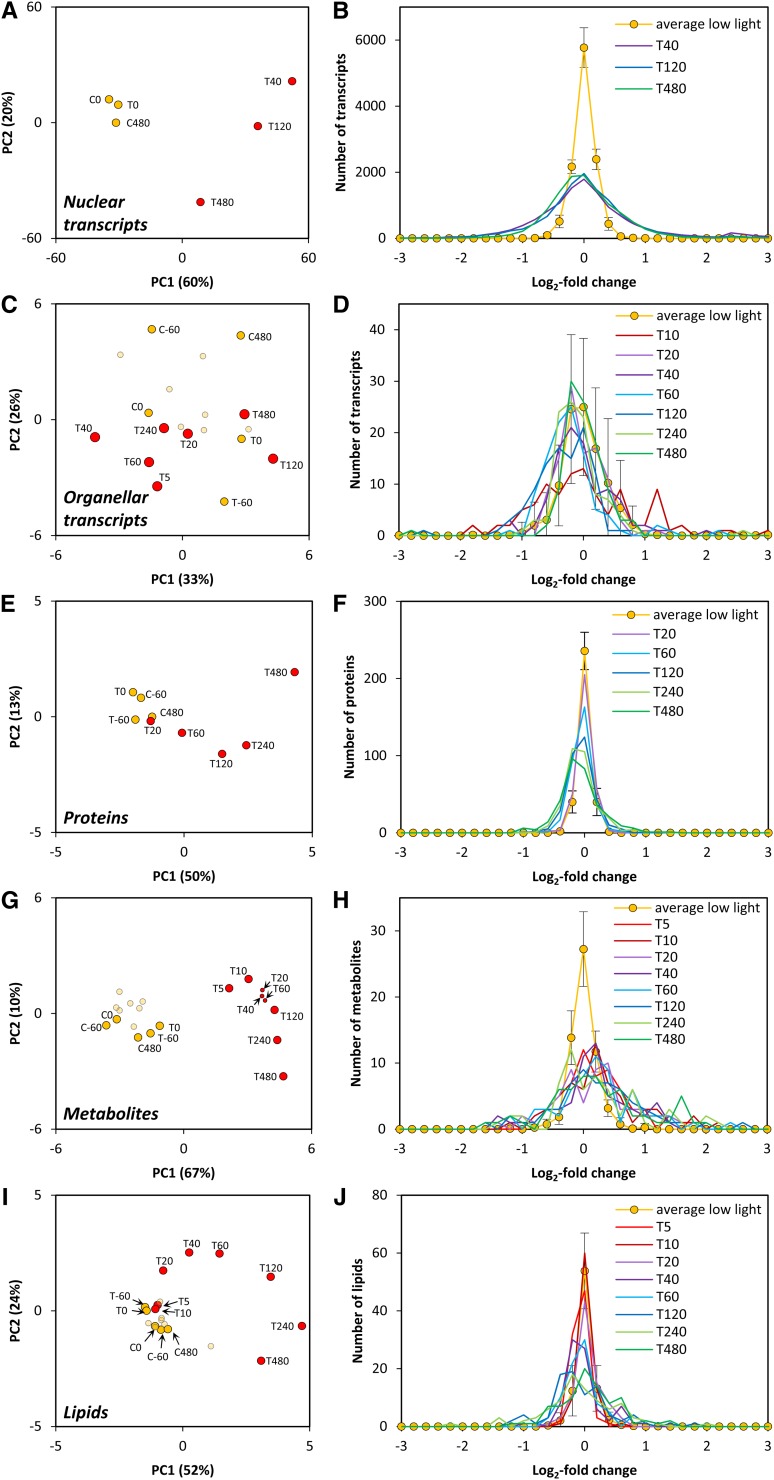
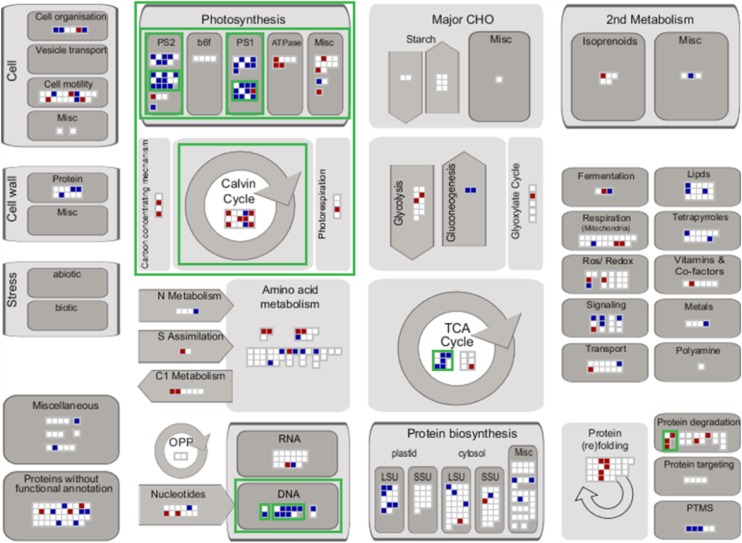
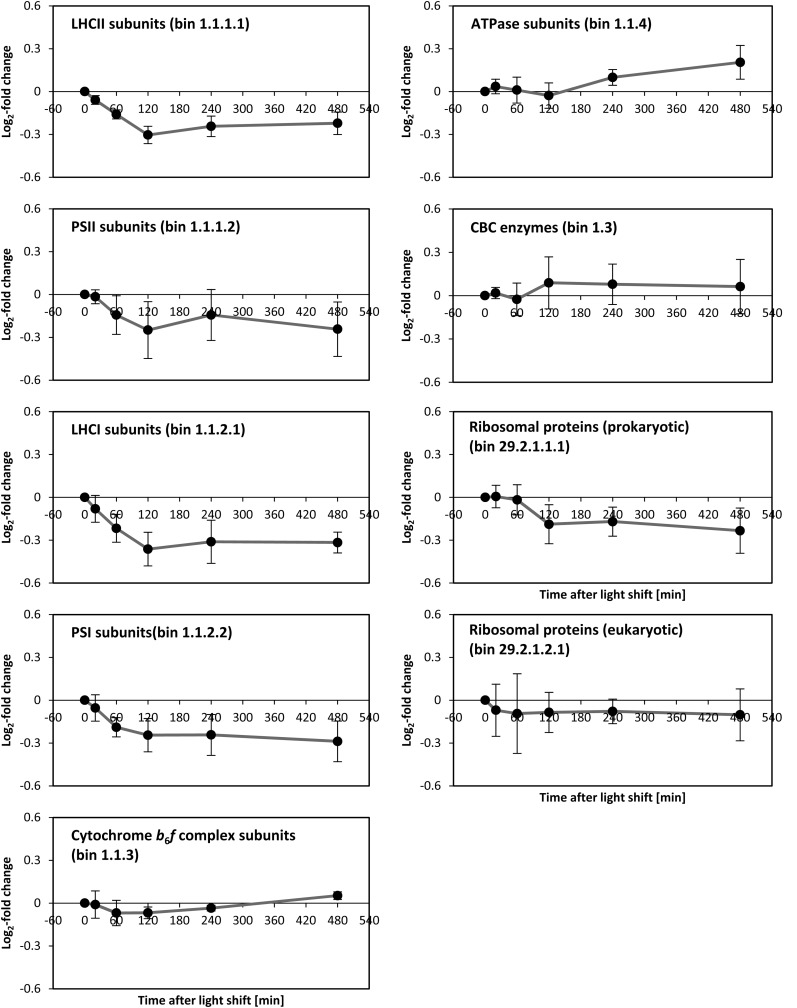
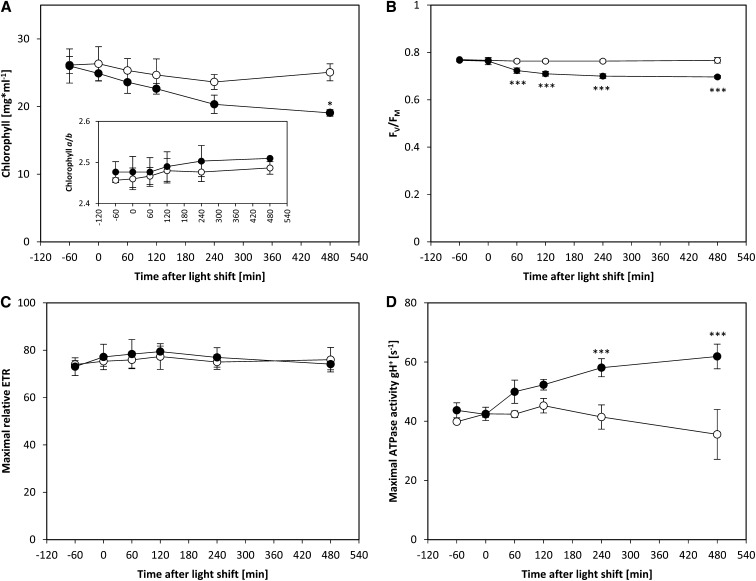
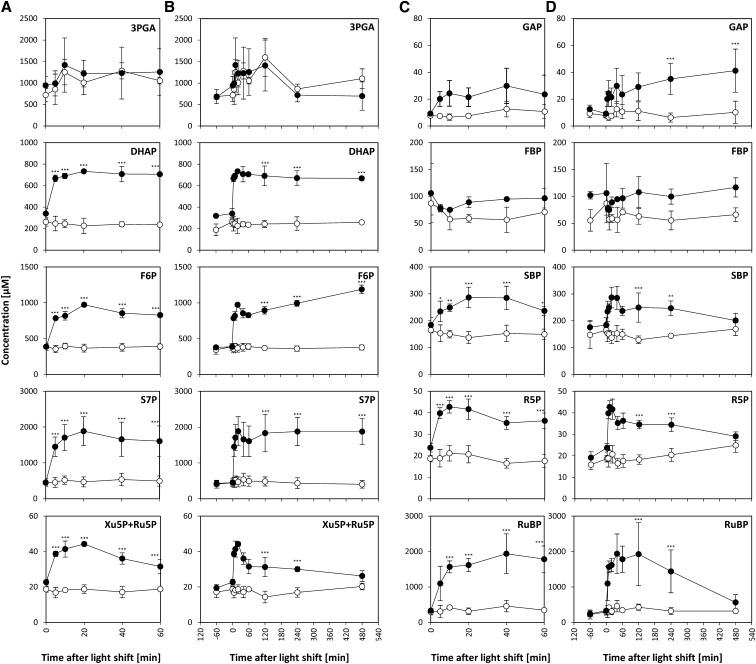
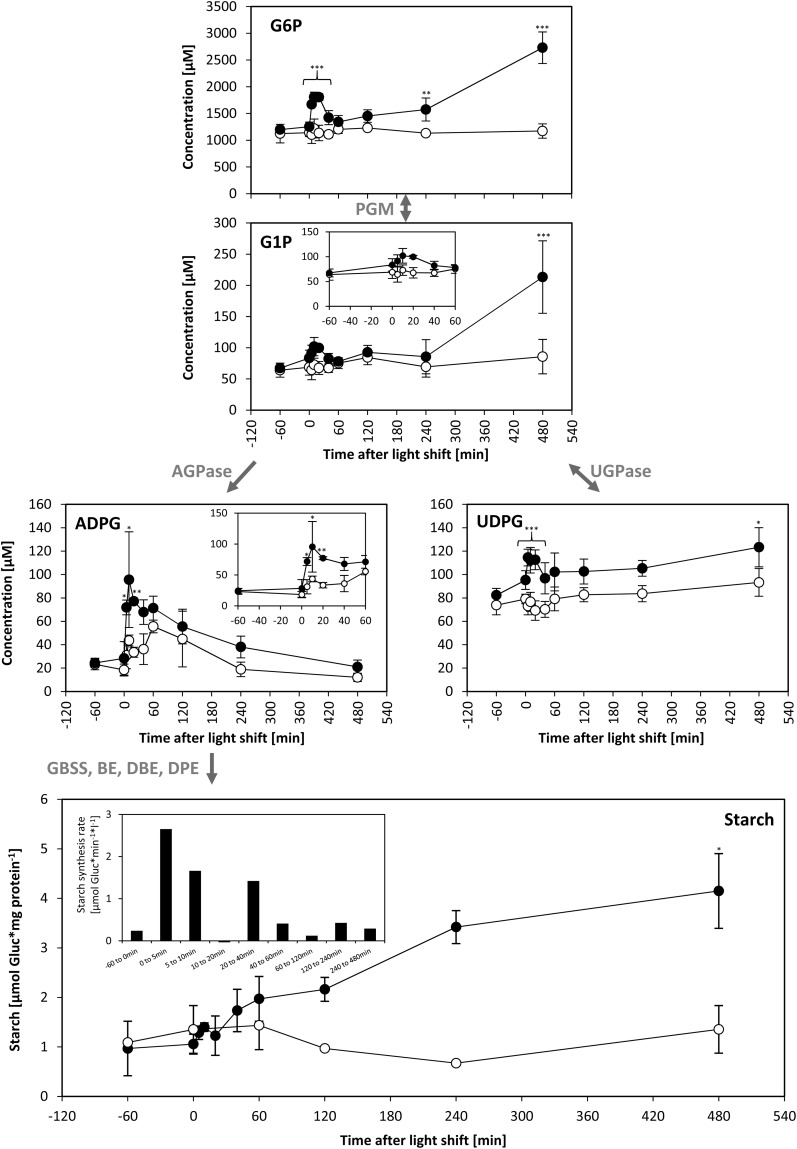
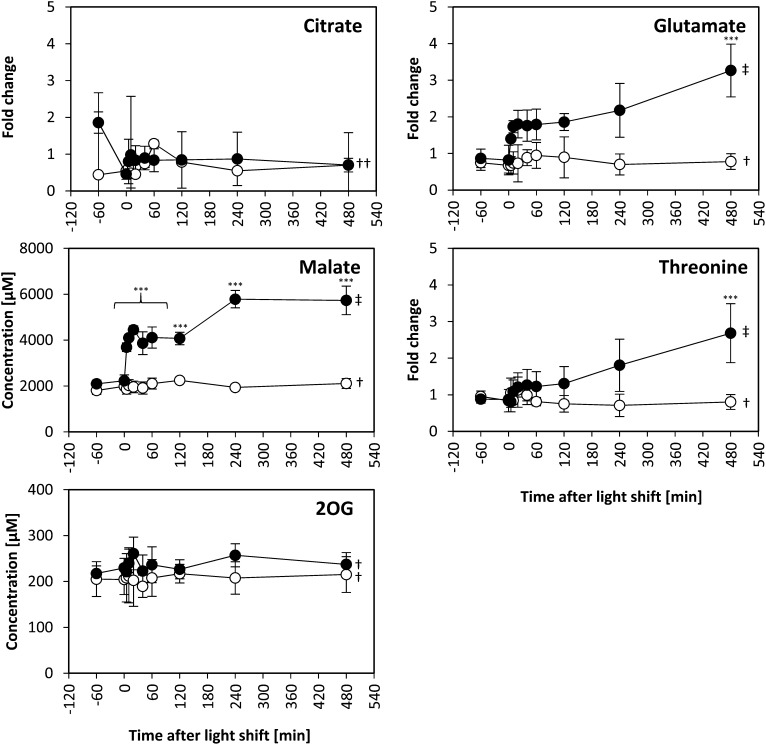
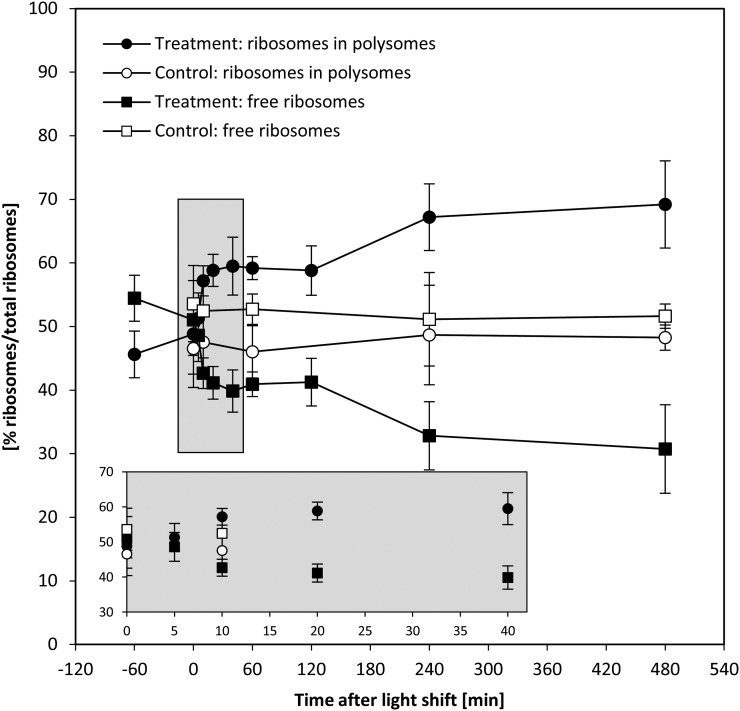
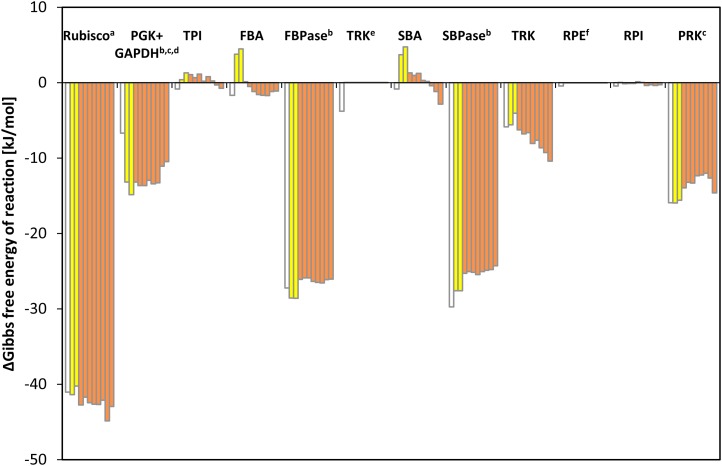
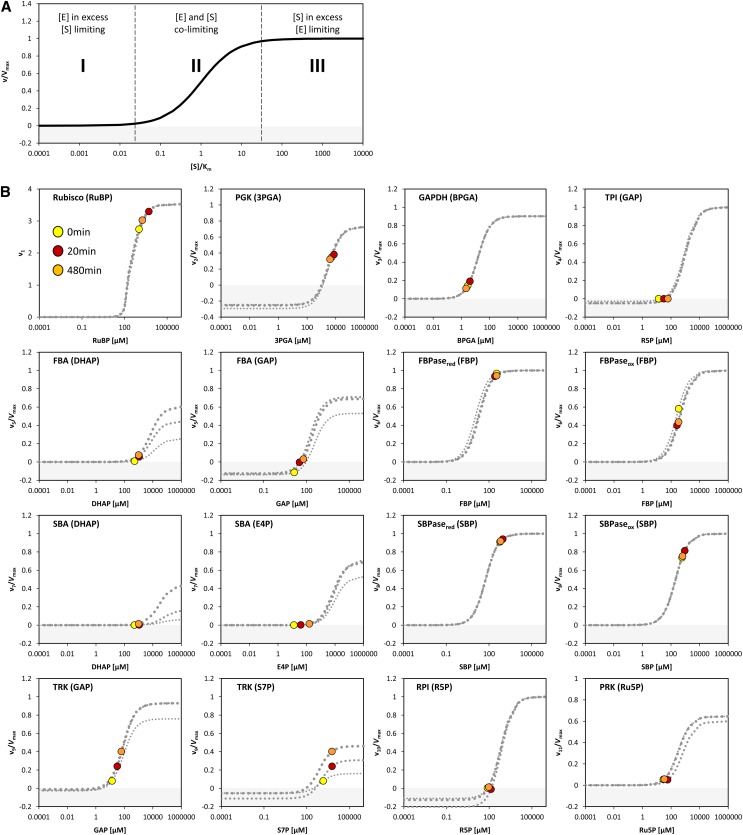
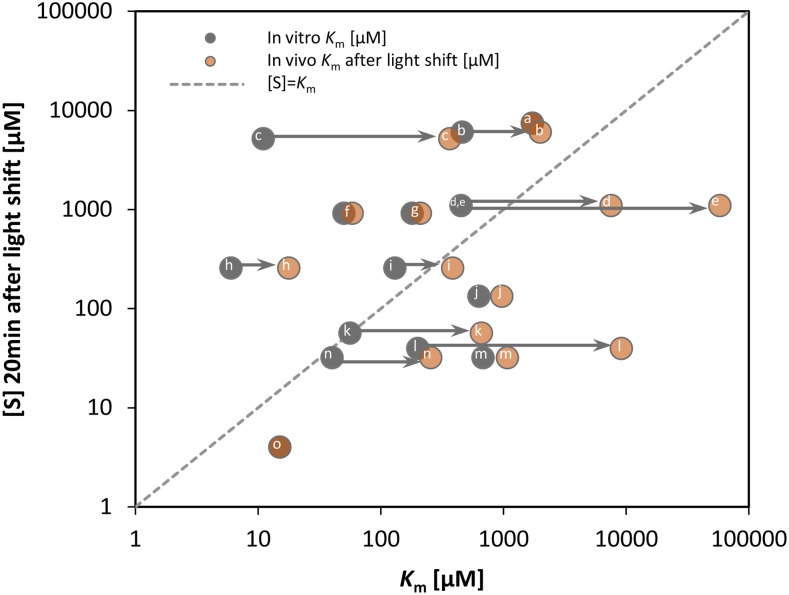
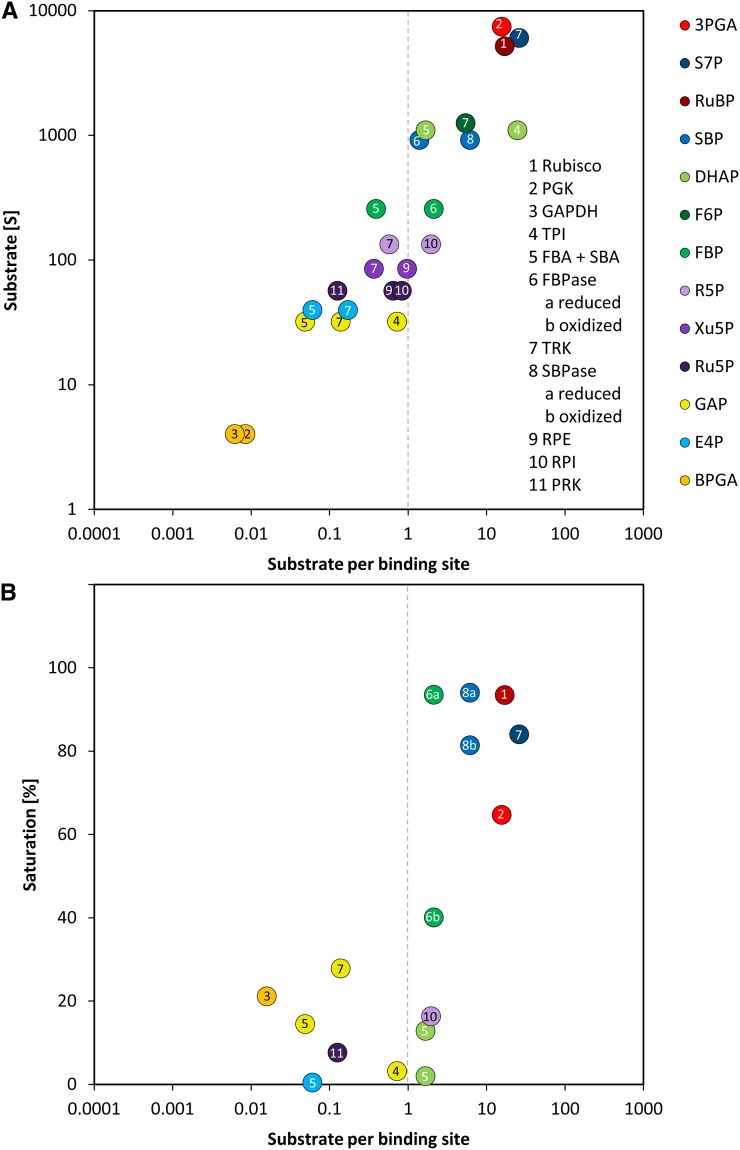
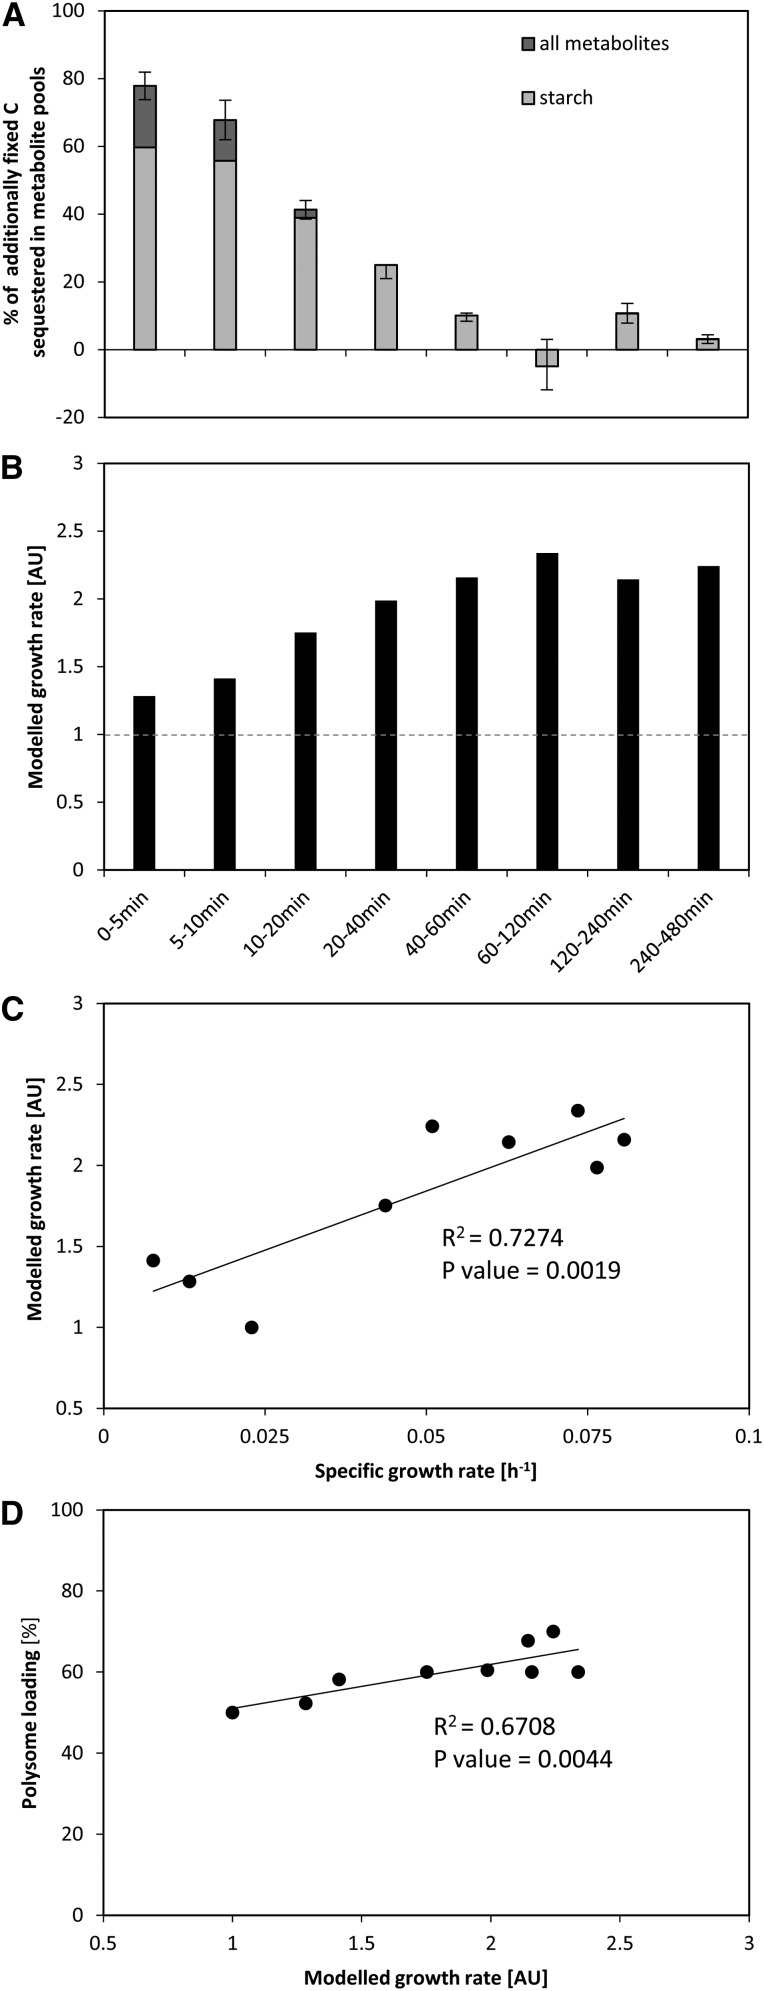
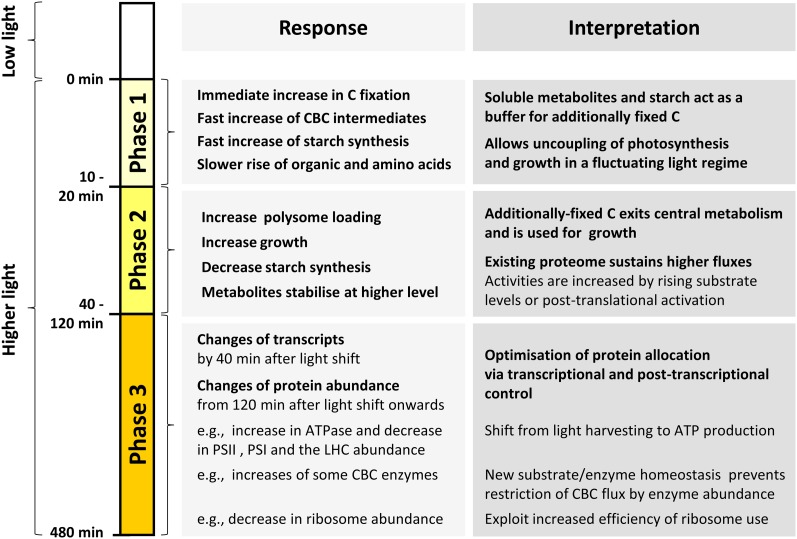
We investigated the systems response of metabolism and growth after an increase in irradiance in the nonsaturating range in the algal model Chlamydomonas reinhardtii. In a three-step process, photosynthesis and the levels of metabolites increased immediately, growth increased after 10 to 15 min, and transcript and protein abundance responded by 40 and 120 to 240 min, respectively. In the first phase, starch and metabolites provided a transient buffer for carbon until growth increased. This uncouples photosynthesis from growth in a fluctuating light environment. In the first and second phases, rising metabolite levels and increased polysome loading drove an increase in fluxes. Most Calvin-Benson cycle (CBC) enzymes were substrate-limited in vivo, and strikingly, many were present at higher concentrations than their substrates, explaining how rising metabolite levels stimulate CBC flux. Rubisco, fructose-1,6-biosphosphatase, and seduheptulose-1,7-bisphosphatase were close to substrate saturation in vivo, and flux was increased by posttranslational activation. In the third phase, changes in abundance of particular proteins, including increases in plastidial ATP synthase and some CBC enzymes, relieved potential bottlenecks and readjusted protein allocation between different processes. Despite reasonable overall agreement between changes in transcript and protein abundance (R2 = 0.24), many proteins, including those in photosynthesis, changed independently of transcript abundance.


Figures

Figure 1.
Figure 1.
Changes in Doubling Time and Photosynthesis Rate of C. reinhardtii Cells Shifted to an Increased Light Intensity. C. reinhardtii CC-1690 cells were grown in a bioreactor at 24°C, 5% CO2, and 41 μmol photons m−2 s−1 and shifted to 145 μmol photons m−2 s−1 at time point zero (dashed line). (A) During the whole experiment, the optical density was kept constant. The dilution of the culture over time allowed calculating the dilution rate [h−1] (n = 2 ± sd) (inset), which is equivalent to the specific growth rate μ for a steady state chemostat (see Methods). (B) The oxygen evolution was measured in a closed cuvette with an optical sensor at the low-light intensity (41 μmol photons m−2 s−1) and after transfer at time point zero to a higher light intensity (145 μmol photons m−2 s−1). The rate of O2 evolution was estimated from the slope. The figure shows an overlay of five independent measurements. (C) ETR was measured in an open cuvette via fluorometry at the low light intensity (41 μmol photons m−2 s−1) and after transfer to a higher light intensity (145 μmol photons m−2 s−1, filled circles) at time point zero or kept at the initial light intensity for 480 min (open circles) (n = 3 ± sd). A pairwise t test between control and treatment samples and P value correction for multiple sampling by Bonferroni correction was performed (three asterisks, P < 0.001). [See online article for color version of this figure.]
Figure 2.
Figure 2.
Overall Changes in Nuclear Transcripts, Organellar Transcripts, Protein Groups, Metabolites, and Lipids after Shift to a Higher Light Intensity. C. reinhardtii CC-1690 cells were grown in a bioreactor at 24°C, 5% CO2, and 41 μmol photons m−2 s−1. At time point zero, the light was either kept at the initial light intensity (C; control) or shifted to 145 μmol photons m−2 s−1 (T; treatment). CX, TX, and X indicate the minutes relative to time point zero. For further details of analyses, see Methods. (A), (C), (E), (G), and (I) PC analysis of log2-normalized nucleus-encoded transcript (A), plastid- and mitochondria-encoded transcript (C), and protein (E), metabolite (G), and lipid (I) levels measured at low light (orange; C5 to C240 are shown in bright orange) and higher light (red) intensity. (B), (D), (F), (H), and (J) Histogram of the log2-fold changes of different time points after the light shift compared with the control time points of nucleus-encoded transcripts (B), plastid- and mitochondria-encoded transcripts (D), and protein (F), metabolite (H), and lipid (J) levels.
Figure 3.
Figure 3.
Schematic Overview of the Differentially Regulated Proteins According to Their Biochemical Pathways and Cellular Processes. Significantly decreased (blue squares) and increased (red squares) protein levels between the control time points and 60 and 480 min after light shift according to Supplemental Figure 6B are visualized within their functional categories based on MapMan ontology using MapMan software (http://mapman.gabipd.org/web/guest/mapman; version 3.6.0RC1). Nonsignificantly changing protein groups are represented by white squares. Green borders indicate enriched functional categories determined by hypergeometric testing (P value < 0.05): bin 28 (DNA; P value = 0.0025), bin 28.1 (DNA.synthesis/chromatin structure; P value = 0.0025), bin 28.1.3 (DNA.synthesis/chromatin structure.histone; P value = 0.0025), bin 1 (photosynthesis; P value < 0.0001), bin 1.3 (PS.calvin cycle; P value = 0.0434), bin 1.1 (PS.lightreaction; P value < 0.0001), bin 1.1.2 (PS.lightreaction.photosystem I; P value = 0.0001), bin 1.1.2.2 (PS.lightreaction.photosystem I.PSI polypeptide subunits; P value = 0.0015), bin 1.1.1 (PS.lightreaction.photosystem II; P value = 0.0015), bin 1.1.1.2 (PS.lightreaction.photosystem II.PSII polypeptide subunits; P value = 0.0058), bin 8.1 (TCA/org transformation.TCA; P value = 0.0154), and bin 29.5.11.1 (protein.degradation.ubiquitin. ubiquitin; P value = 0.0335).
Figure 4.
Figure 4.
Central Tendencies of Protein Levels during the Light Shift Experiment within the Functional Categories Light Reaction, CBC, and Ribosomes. Central tendencies are calculated using average and sd of all protein groups belonging to the same functional category based on the MapMan ontology (MapMan bin numbers are given in parentheses). For single values of protein groups, see Supplemental Figure 9.
Figure 5.
Figure 5.
Changes in Chlorophyll Content per Milliliter of Culture, Chlorophyll a/b Ratio, Maximum Quantum Efficiency of PSII (FV/FM), Maximal Relative ETR under Light Saturated Conditions, and Maximum ATPase Activity. C. reinhardtii CC-1690 cells were grown in a bioreactor at 24°C, 5% CO2, and 41 µmol photons m−2 s−1. At time point zero, the light was either kept at the initial light intensity (open circles) or shifted to 145 µmol photons m−2 s−1 (filled circles). A pairwise t test between control and treatment samples and P value correction for multiple sampling by Bonferroni correction was performed (n = 4 ± sd; one asterisk, P < 0.05; three asterisks, P < 0.001).
Figure 6.
Figure 6.
Rapid Increase of CBC Intermediates. C. reinhardtii CC-1690 cells were grown in a bioreactor at 24°C, 5% CO2, and 41 μmol photons m−2 s−1. At time point zero, the light was either kept at the initial light intensity (open circles, n = 4 ± sd) or shifted to 145 μmol photons m−2 s−1 (filled circles, n = 4 ± sd) at time point zero. Metabolite levels were given as concentrations in algal cells (μM; see Methods). A pairwise t test between control and treatment samples with P value correction for multiple sampling by Bonferroni correction was performed (one asterisk, P < 0.05; two asterisks, P < 0.01; three asterisks, P < 0.001). For both conditions, cells were harvested for metabolite analysis by LC-MS/MS during the 8 h following the time point zero. Metabolites levels are shown for the whole time course ([A] and [C]) and the first hour ([B] and [D]). Graphs are based on Supplemental Data Set 1.
Figure 7.
Figure 7.
Hexose-Phosphates, ADPG, UDPG, and Starch. C. reinhardtii CC-1690 cells were harvested after a light shift from 41 to 145 μmol photons m−2 s−1 (filled circles) or kept at 41 μmol photons m−2 s−1 (open circles). F6P, G6P, G1P, ADPG, and UDPG were measured by LC-MS/MS as described in Methods (n = 4 ± sd). Metabolite levels were given as concentrations in algal cells (μM). Starch was measured enzymatically according to Methods (n = 3, ± sd). The rate of starch synthesis (shown as inset) was calculated as described in Methods. Pairwise t test between control and treatment and P value correction for multiple sampling by Bonferroni correction was done (one asterisk, P < 0.05; two asterisks, P < 0.01; three asterisks, P < 0.001). The enzymes catalyzing steps between compounds are given in gray. PGI, phosphoglucoisomerase; PGM, phosphoglucomutase; GBSS, granule-bound starch synthase; BE, branching enzyme; DBE, debranching enzyme; DPE, disproportionating enzyme.
Figure 8.
Figure 8.
TCA Cycle Intermediates and Amino Acids during Light Shift. C. reinhardtii CC-1690 cells were grown in a bioreactor at 24°C, 5% CO2, and 41 μmol photons m−2 s−1 (open circles) or shifted to 145 μmol photons m−2 s−1 at time point zero (filled circles). 2OG and malate were separated and detected by LC-MS/MS and given in μM (n = 4, ± sd). Citrate, glutamate, and threonine were separated and detected by GC-MS (n = 3, ± sd) and given in fold changes normalized to time point zero. Pairwise t test between control and treatment was done and P value correction for multiple sampling by Bonferroni correction (one asterisk, P < 0.05; two asterisks, P < 0.01; three asterisks, P < 0.001). Additionally, ANOVA analysis over the whole control and treatment time course was done with P value correction for multiple sampling by Benjamini-Hochberg correction (dagger, P > 0.05; double dagger, P < 0.05). For all measured TCA intermediates and amino acids levels, see Supplemental Figure 14.
Figure 9.
Figure 9.
Increase in Polysome Loading upon Increased Light Intensity. C. reinhardtii CC-1690 cells were grown in a bioreactor at 24°C, 5% CO2, and 41 μmol photons m−2 s−1 and kept at this light intensity (open symbols) or shifted to 145 μmol photons m−2 s−1 at time point zero (closed symbols). For each time point and both treatments, the percentage of free ribosomes (squares) and ribosomes in polysomes (cycles) was calculated based on the ribosome profile (see Methods for details; n = 3 ± sd).
Figure 10.
Figure 10.
Gibbs Free Energy of Reaction (ΔrG) of CBC Enzymes. ΔrG based on metabolite data shown in Figure 6 of C. reinhardtii CC-1690 cells harvested 1 h before the light shift and at time point zero (light gray) and after the light shift (dark gray). The time points proceed from left to right: 1 h before light shift, time point zero, and 5, 10, 20, 40, 60, 120, 240, and 480 min after light shift. For comparison, the ΔrG values calculated by Bassham and Krause (1969) based on metabolites measured in C. pyrenoidosa are shown (white). This figure is a graphic representation of data presented in Supplemental Data Set 2. a[CO2] under 5% CO2 conditions was assumed to be 0.202 M. bNADPH/NADP+ = 1 (Heineke et al., 1991). cATP/ADP = 3 (Gardeström and Wigge, 1988). d[Pi] = 0.002 M (Pratt et al., 2009). eThe TRK reaction was assumed to be at equilibrium to estimate the in vivo concentration of E4P (K = 0.084, Bassham and Krause 1969). fThe RPE reaction was assumed to be at equilibrium to estimate individual levels of Xu5P and Ru5P (K = 0.667; Bassham and Krause, 1969). [See online article for color version of this figure.]
Figure 11.
Figure 11.
Calculated v/Vmax Values for CBC Reactions during Light Shift. (A) Enzyme kinetics plotted according to Fendt et al. (2010) showing three different relationships (I-III) between enzyme abundances and metabolite concentrations alterations based on Michaelis-Menten enzyme kinetic: v = Vmax*[S]*(Km+[S])−1. Note that the x axis is shown in log10-scale. (B) Enzyme kinetics were calculated over a range of substrate concentration for each CBC enzymes except RPE and the first TRK. For PGK, TPI, FBA, SBA, TRK, and RPI, the Michaelis-Menten kinetic equation for reversible reactions was applied. For GAPDH, FBPase, SBPase, and PRK, the Michaelis-Menten kinetic equation for irreversible reaction was applied taking into account known competitive inhibitors for the FBPase, SBPase, and PRK reactions. For Rubisco, the Michaelis-Menten-like kinetic equation based on Farquhar (1979) was used (Von Caemmerer, 2000). This was done for time point zero (0 min, thin dashed line), 20 min (intermediate dashed line), and 480 min (thick dashed line) after the light shift. Additionally, the actual measured substrate concentration at three representative time points during the light shift is shown at time point zero (yellow), 20 min (red), and 480 min (orange) after the light shift. Enzyme names are given with their corresponding substrate in parentheses. For details of the calculation, see Methods, for rate equations, see Supplemental Table 2, and for Km and KI values, see Supplemental Table 3. For FBA, SBA, and TRK, the v/Vmax modeled at different time points changes due to changes in the level of the second substrates GAP (FBA and TRK) and DHAP (FBA and SBA). Note that for FBPase and SBPase, the Km for FBP and SBP, respectively, of the reduced (red) and the oxidized (ox) enzyme is used for modeling the substrate saturation. Note that the x axes are shown in log10-scale. Values of the y axis <0 are shaded in gray and indicate that the reaction works in the opposite direction for the corresponding substrate level.
Figure 12.
Figure 12.
In Vitro and in Vivo Km Values versus Substrate Concentrations [S]. The substrate levels 20 min after the light shift of CBC reactions (Figure 11) are plotted against in vitro Km (dark gray) (literature values; for details, see Supplemental Table 3) and in vivo Km (light gray) calculated based on substrate saturation curves (Figure 11). Arrows indicate >2-fold increases between in vitro and in vivo Km values. Enzymes with their substrate in parentheses: aPGK (3PGA), bTRK (S7P), cRubisco (RuBP), dFBA (DHAP), eSBA (DHAP), foxidized SBPase (SBP), greduced SBPase (SBP), hoxidized FBPase (FBP), ireduced FBPase (FBP), jRPI (R5P), kPRK (Ru5P), lSBA (E4P), mTPI (GAP), nFBA (GAP), and oGAPDH (BPGA). In Supplemental Figure 18, the corresponding plot with substrate levels at the low light intensity is shown. [See online article for color version of this figure.]
Figure 13.
Figure 13.
Substrate per Binding Sites versus Substrate Concentrations and Enzyme Saturation of the CBC. Substrates of CBC reactions were measured via LC-MS/MS and are shown in Figure 6. Binding sites of CBC enzymes were calculated based on proteomics data via the emPAI as described in the text and in Supplemental Table 1. (A) Substrate per binding site values of CBC reactions are plotted against the substrate level 20 min after the light intensity was increased from 41 to 145 μmol photons m−2 s−1. (B) Substrate per binding site values of CBC reactions are plotted against the degree of saturation according to the saturation curves shown in Figure 11, 20 min after the light intensity was increased from 41 to 145 μmol photons m−2 s−1. For a similar plot at the lower light intensity, see Supplemental Figure 20.
Figure 14.
Figure 14.
C Sequestration after Light Shift into Metabolite Pools and Starch. C. reinhardtii CC-1690 cells were grown in a bioreactor at 24°C, 5% CO2, and 41 μmol photons m−2 s−1 and shifted to 145 μmol photons m−2 s−1 at time point zero. (A) Based on photosynthesis rate, the additionally fixed C in the higher light condition was calculated and set to 100% (n = 4 ± sd). Based on changes between metabolites pools measured by LC-MS/MS (Supplemental Data Set 1) and starch (Figure 7), the changes in C atoms in these pools were calculated and expressed relative to the additionally fixed C between all time points (see Methods). (B) Based on the C sequestration shown in (A), the growth rate was modeled (for details, see Methods). The dashed line indicates the modeled growth rate at the low light intensity that was set to 1. AU, arbitrary units. (C) Pearson correlation between the modeled growth rate shown in (B) and the specific growth rate measured by medium dilution rate (Figure 1A). (D) Pearson correlation between the modeled growth rate shown in (B) and polysome loading (Figure 9).
Figure 15.
Figure 15.
Schematic Summary of the Response of C. reinhardtii to an Increase in Light Intensity (for Details, See Text). Phase 1 is not at steady state, and phase 2 and phase 3 represent quasi–steady states.

Similar articles

Cited by

References

    1. Ainsworth E.A., et al. (2008). Next generation of elevated [CO2] experiments with crops: a critical investment for feeding the future world. Plant Cell Environ. 31: 1317–1324. - PubMed
    1. Akan P., Alexeyenko A., Costea P.I., Hedberg L., Solnestam B.W., Lundin S., Hällman J., Lundberg E., Uhlén M., Lundeberg J. (2012). Comprehensive analysis of the genome transcriptome and proteome landscapes of three tumor cell lines. Genome Med. 4: 86. - PMC - PubMed
    1. Allorent G., et al. (2013). A dual strategy to cope with high light in Chlamydomonas reinhardtii. Plant Cell 25: 545–557. - PMC - PubMed
    1. Amthor J.S. (2010). From sunlight to phytomass: on the potential efficiency of converting solar radiation to phyto-energy. New Phytol. 188: 939–959. - PubMed
    1. Anderson J.M. (1992). Cytochrome b6f complex: Dynamic molecular organization, function and acclimation. Photosynth. Res. 34: 341–357. - PubMed