

Tumor MHC class I expression improves the prognostic value of T-cell density in resected colorectal liver metastases
- PMID: 24894090
- PMCID: PMC4048875
- DOI: 10.1158/2326-6066.CIR-13-0180
Tumor MHC class I expression improves the prognostic value of T-cell density in resected colorectal liver metastases
Abstract
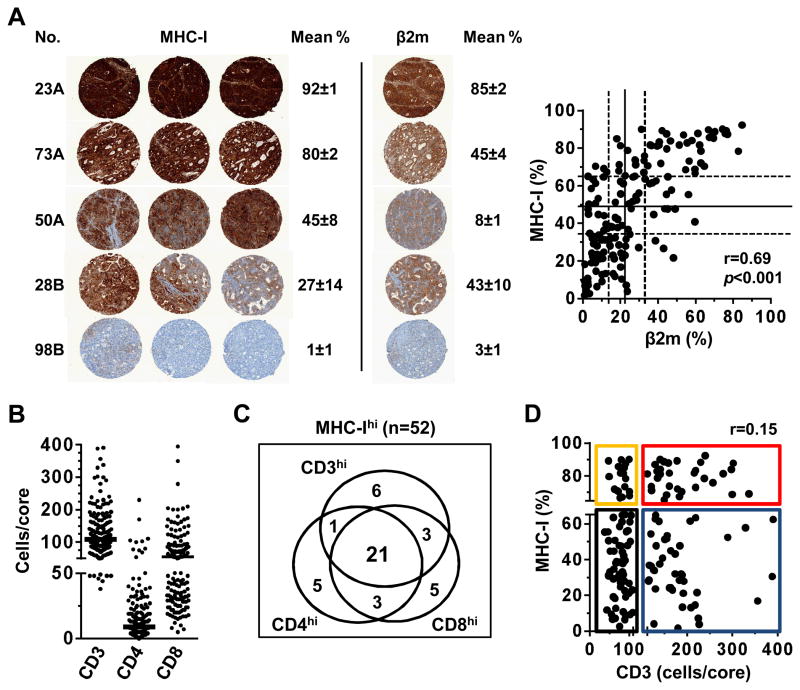
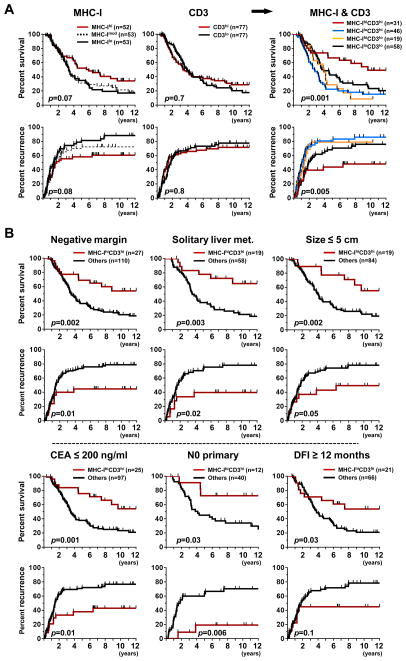
Tumor-infiltrating lymphocytes (TIL) in colorectal cancer liver metastases (CLM) have been associated with more favorable patient outcomes, but whether MHC class I (MHC-I) expression on cancer cells affects prognosis is uncertain. Immunohistochemistry was performed on a tissue microarray of 158 patients with CLM, who underwent partial hepatectomy with curative intent. Using the antibody HC-10, which detects HLA-B and HLA-C antigens and a minority of HLA-A antigens, MHC-I expression was correlated with β-2 microglobulin (β2m; r = 0.7; P < 0.001), but not with T-cell density (r < 0.32). The median follow-up for survivors was 9.7 years. High levels of MHC-I expression in tumors concomitant with high T-cell infiltration (CD3, CD4, or CD8) best identified patients with favorable outcomes, compared with patients with one or none of these immune features. The median overall survival (OS) of patients with MHC-I(hi)CD3(hi) tumors (n = 31) was 116 months compared with 40 months for the others (P = 0.001), and the median time to recurrence (TTR) was not reached compared with 17 months (P = 0.008). By multivariate analysis, MHC(hi)CD3(hi) was associated with OS and TTR independent of the standard clinicopathologic variables. An immune score that combines MHC-I expression and TIL density may be a valuable prognostic tool in the treatment of patients with CLM.
©2014 American Association for Cancer Research.
Conflict of interest statement
Figures
References
-
- Fridman WH, Pages F, Sautes-Fridman C, Galon J. The immune contexture in human tumours: impact on clinical outcome. Nat Rev Cancer. 2012;12:298–306. - PubMed
-
- Galon J, Costes A, Sanchez-Cabo F, Kirilovsky A, Mlecnik B, Lagorce-Pages C, et al. Type, density, and location of immune cells within human colorectal tumors predict clinical outcome. Science. 2006;313:1960–4. - PubMed
-
- Pages F, Berger A, Camus M, Sanchez-Cabo F, Costes A, Molidor R, et al. Effector memory T cells, early metastasis, and survival in colorectal cancer. N Engl J Med. 2005;353:2654–66. - PubMed
-
- Mlecnik B, Tosolini M, Kirilovsky A, Berger A, Bindea G, Meatchi T, et al. Histopathologic-based prognostic factors of colorectal cancers are associated with the state of the local immune reaction. J Clin Oncol. 2011;29:610–8. - PubMed
Publication types
MeSH terms
Substances
Grants and funding
LinkOut - more resources
Full Text Sources
Other Literature Sources
Medical
Research Materials
Miscellaneous
