Mechanical vulnerability explains size-dependent mortality of reef corals
- PMID: 24894390
- PMCID: PMC4145665
- DOI: 10.1111/ele.12306
Mechanical vulnerability explains size-dependent mortality of reef corals
Abstract
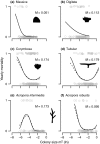
Understanding life history and demographic variation among species within communities is a central ecological goal. Mortality schedules are especially important in ecosystems where disturbance plays a major role in structuring communities, such as coral reefs. Here, we test whether a trait-based, mechanistic model of mechanical vulnerability in corals can explain mortality schedules. Specifically, we ask whether species that become increasingly vulnerable to hydrodynamic dislodgment as they grow have bathtub-shaped mortality curves, whereas species that remain mechanically stable have decreasing mortality rates with size, as predicted by classical life history theory for reef corals. We find that size-dependent mortality is highly consistent between species with the same growth form and that the shape of size-dependent mortality for each growth form can be explained by mechanical vulnerability. Our findings highlight the feasibility of predicting assemblage-scale mortality patterns on coral reefs with trait-based approaches.
Keywords: Biomechanics; colonial; demography; disturbance; life history; mortality; reef coral.
© 2014 The Authors. Ecology Letters published by John Wiley & Sons Ltd and CNRS.
Figures


References
-
- Adler PB, Fajardo A, Kleinhesselink AR. Trait-based tests of coexistence mechanisms. Ecol. Lett. 2013;16:1294–1306. - PubMed
-
- Babcock RC. Comparative demography of three species of scleractinian corals using age-and size-dependent classifications. Ecol. Monogr. 1991;61:225–244.
-
- Baird AH, Marshall PA. Mortality, growth and reproduction in scleractinian corals following bleaching on the Great Barrier Reef. Mar. Ecol. Prog. Ser. 2002;237:133–141.
-
- Baird AH, Bhagooli R, Ralph PJ, Takahashi S. Coral bleaching: the role of the host. Trends Ecol. Evol. 2009;24:16–20. - PubMed
-
- Baria MVB, dela Cruz DW, Villanueva RD, Guest JR. Spawning of three-year-old Acropora Millepora corals reared from Larvae in Northwestern Philippines. Bull. Mar. Sci. 2012;88:61–62.
Publication types
MeSH terms
LinkOut - more resources
Full Text Sources
Other Literature Sources

