. 2014 Jul 3;13(7):3330-7.
doi: 10.1021/pr5001829. Epub 2014 Jun 13.

Bioinformatic and proteomic analysis of bulk histones reveals PTM crosstalk and chromatin features

Affiliations

Bioinformatic and proteomic analysis of bulk histones reveals PTM crosstalk and chromatin features

Chunchao Zhang et al. J Proteome Res. .

Abstract

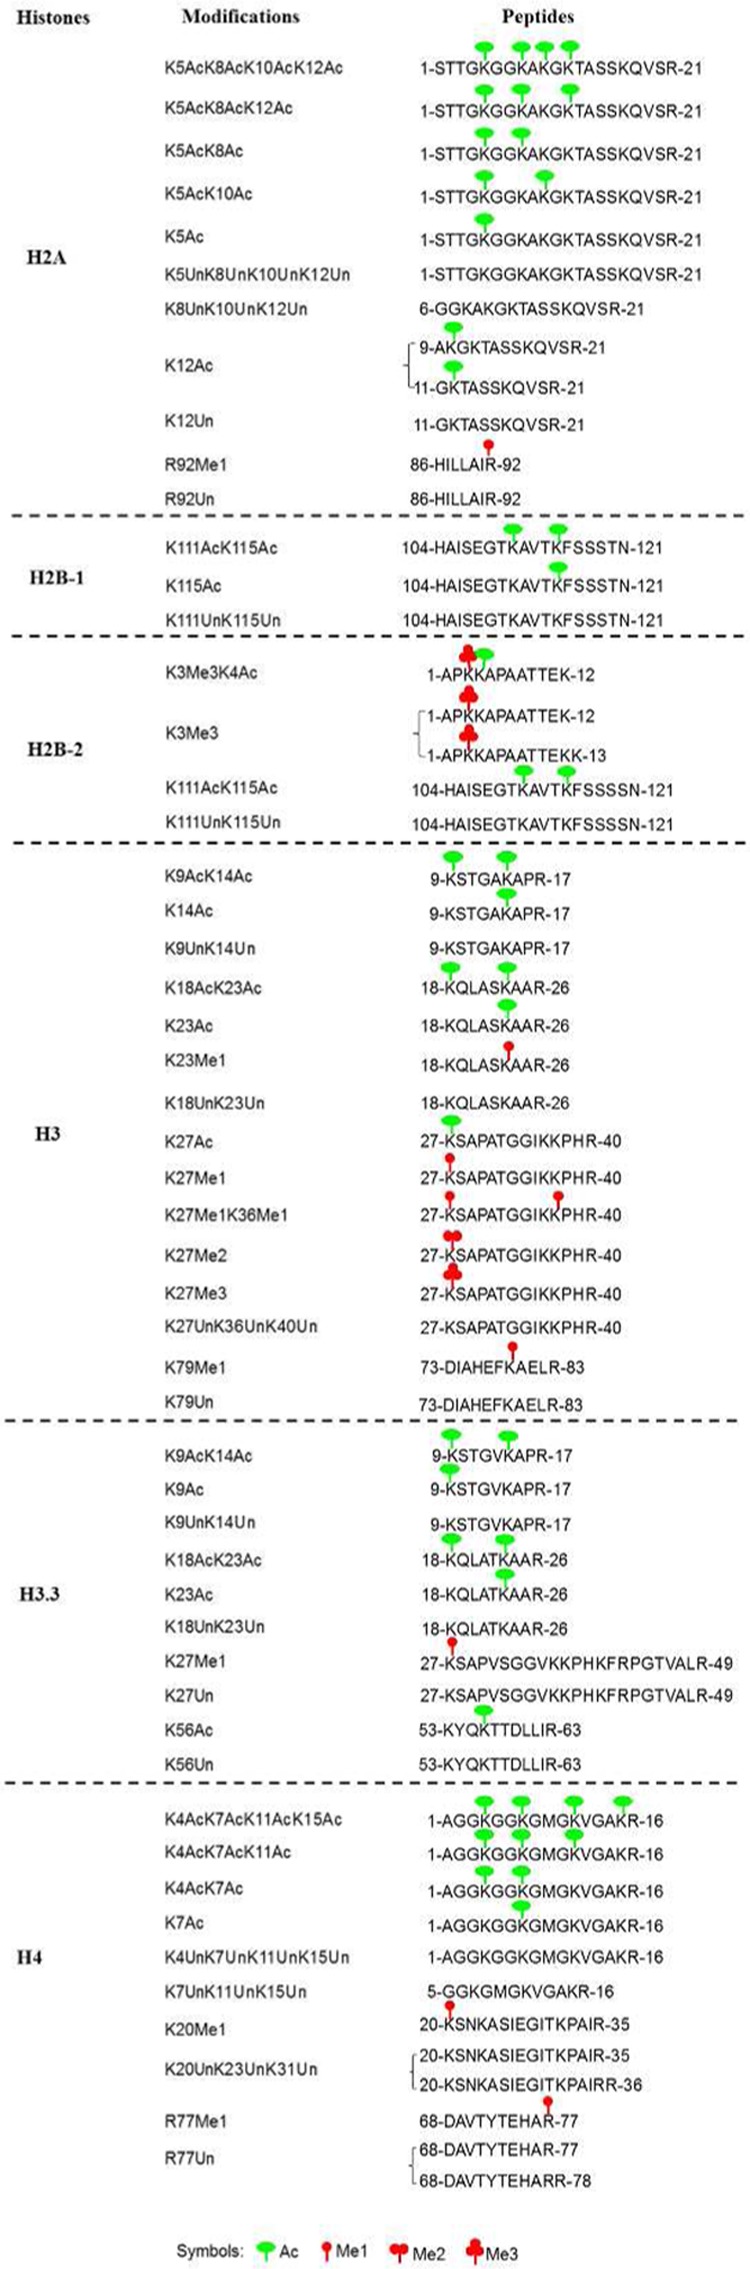
Systems analysis of chromatin has been constrained by complex patterns and dynamics of histone post-translational modifications (PTMs), which represent major challenges for both mass spectrometry (MS) and immuno-based approaches (e.g., chromatin immuno-precipitation, ChIP). Here we present a proof-of-concept study demonstrating that crosstalk among PTMs and their functional significance can be revealed via systematic bioinformatic and proteomic analysis of steady-state histone PTM levels from cells under various perturbations. Using high resolution tandem MS, we quantified 53 modification states from all core histones and their conserved variants in the unicellular eukaryotic model organism Tetrahymena. By correlating histone PTM patterns across 15 different conditions, including various physiological states and mutations of key histone modifying enzymes, we identified 5 specific chromatin states with characteristic covarying histone PTMs and associated them with distinctive functions in replication, transcription, and DNA repair. In addition to providing a detailed picture on histone PTM crosstalk at global levels, this work has established a novel bioinformatic and proteomic approach, which can be adapted to other organisms and readily scaled up to allow increased resolution of chromatin states.


Figures

Figure 1
Figure 1
Overall workflow. Wild-type or knockout cells collected under growing, starving, or conjugating conditions were unlabeled, while one wild-type cell line was 15N-metabolically labeled. Histones from all cell lines were acid extracted and separated by C8 reversed-phase HPLC. Each type of core histones was equally mixed with the same type of 15N-labeled core histones, which served as global internal standards. Protein digests were analyzed by nanoflow liquid chromatography coupled with a high-resolution LTQ Orbitrap-XL mass spectrometer. A PTM quantification matrix reflecting perturbed chromatin profiles was generated. Multivariate statistical models were employed to reveal hidden chromatin features and PTM crosstalk.
Figure 2
Figure 2
Identification and quantification of 53 histone modification states in all cell lines. We identified 40 individual histone marks and quantified 53 modification states in all phenotypes from individual core histones averaged over replicates, multiple charge states, different propionylation degrees, or multiple tryptic cleavage sites.
Figure 3
Figure 3
Factor analysis of histone modifications reveals 5 hidden chromatin features. (a) A PCA screeplot of the data correlation matrix was used to determine how many factors are required for the FA model based on the following rules: (1) number of eigenvalues greater than one; (2) percent of variance explained by first several factors. (b) Details of 5-factor model from R software: FA model identified 5 chromatin features known as “growth”, “replication”, “transcription”, and two other factors with less clear biological significance. The first 5 factors account for up to 84.5% of variance and most factors have low uniqueness. The loadings with large numbers are identified with red numbers. Note: Factor loadings are very similar to regression coefficients in the Generalized Linear Model. They represent how well variables are correlated with each of the factors. The loadings with large numbers usually provide meaningful interpretations of factors.
Figure 4
Figure 4
Five functionally related histone PTM subgroups. Common PTMs and clusters identified by both PAM and Ward’s hierarchical clustering algorithm. Cluster 1: N-terminal acetylation of H2A, H3 and H4. Cluster 2: Some unchanged levels of PTMs and unmodified forms. Cluster 3: PTMs in this group are H3:K23Me1 and unacetylated forms in H3.3. Cluster 4: Monomethylation of H3K27 and K36. Cluster 5: Di/trimethylation of K27. Note: For clustering analysis, dissimilarity matrix is used as input in PAM, and Euclidean distance is measured in hierarchical clustering.

References

    1. Allis C. D.; Jenuwein T.; Reinberg D.. Epigenetics; Cold Spring Harbor Laboratory Press: Cold Spring Harbor, NY, 2007.
    1. Jenuwein T.; Allis C. D. Translating the histone code. Science 2001, 29355321074–80. - PubMed
    1. Strahl B. D.; Allis C. D. The language of covalent histone modifications. Nature 2000, 403676541–5. - PubMed
    1. Taverna S. D.; Li H.; Ruthenburg A. J.; Allis C. D.; Patel D. J. How chromatin-binding modules interpret histone modifications: lessons from professional pocket pickers. Nat. Struct. Mol. Biol. 2007, 14111025–40. - PMC - PubMed
    1. Greer E. L.; Shi Y. Histone methylation: a dynamic mark in health, disease and inheritance. Nat. Rev. Genet 2012, 135343–57. - PMC - PubMed

Publication types

LinkOut - more resources