

Next maSigPro: updating maSigPro bioconductor package for RNA-seq time series
- PMID: 24894503
- PMCID: PMC4155246
- DOI: 10.1093/bioinformatics/btu333
Next maSigPro: updating maSigPro bioconductor package for RNA-seq time series
Abstract
Motivation: The widespread adoption of RNA-seq to quantitatively measure gene expression has increased the scope of sequencing experimental designs to include time-course experiments. maSigPro is an R package specifically suited for the analysis of time-course gene expression data, which was developed originally for microarrays and hence was limited in its application to count data.
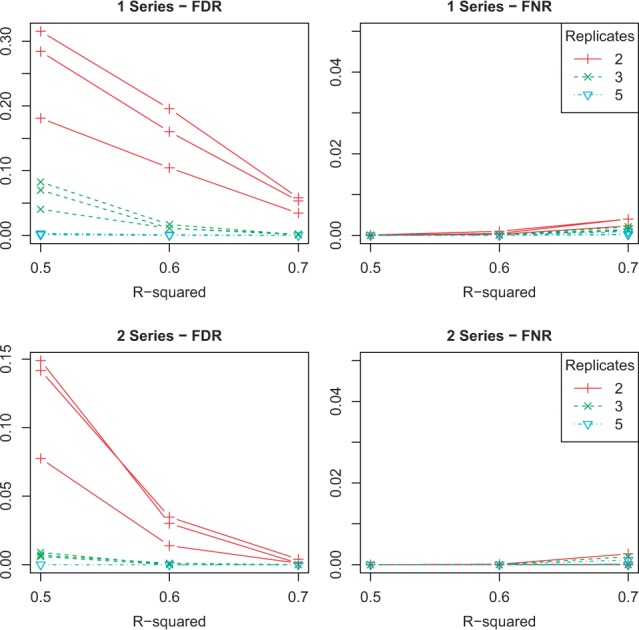
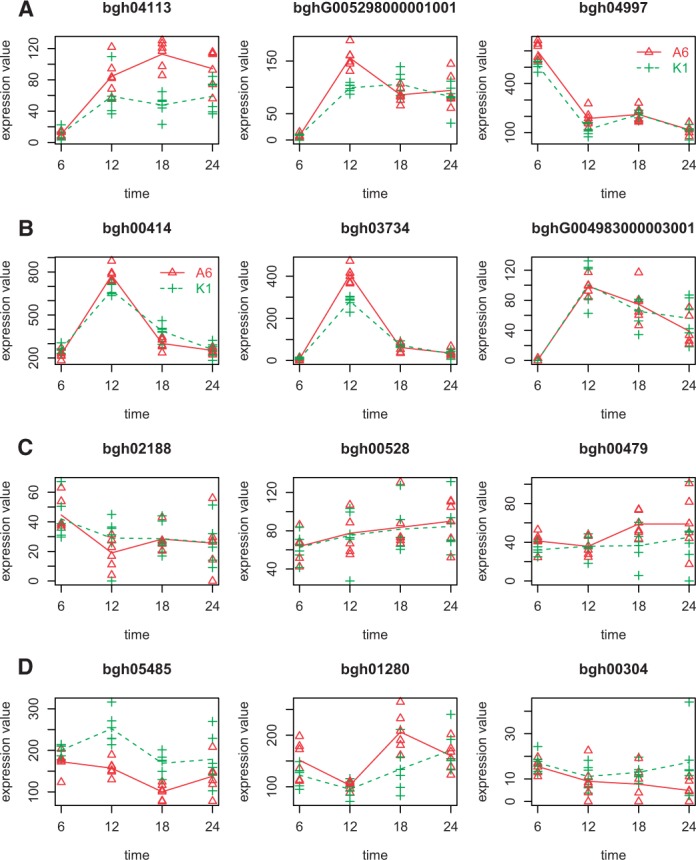
Results: We have updated maSigPro to support RNA-seq time series analysis by introducing generalized linear models in the algorithm to support the modeling of count data while maintaining the traditional functionalities of the package. We show a good performance of the maSigPro-GLM method in several simulated time-course scenarios and in a real experimental dataset.
Availability and implementation: The package is freely available under the LGPL license from the Bioconductor Web site (http://bioconductor.org).
© The Author 2014. Published by Oxford University Press.
Figures
Similar articles
-
Identification and visualization of differential isoform expression in RNA-seq time series.Bioinformatics. 2018 Feb 1;34(3):524-526. doi: 10.1093/bioinformatics/btx578. Bioinformatics. 2018. PMID: 28968682 Free PMC article.
-
A flexible count data model to fit the wide diversity of expression profiles arising from extensively replicated RNA-seq experiments.BMC Bioinformatics. 2013 Aug 21;14:254. doi: 10.1186/1471-2105-14-254. BMC Bioinformatics. 2013. PMID: 23965047 Free PMC article.
-
Polyester: simulating RNA-seq datasets with differential transcript expression.Bioinformatics. 2015 Sep 1;31(17):2778-84. doi: 10.1093/bioinformatics/btv272. Epub 2015 Apr 28. Bioinformatics. 2015. PMID: 25926345 Free PMC article.
-
easyRNASeq: a bioconductor package for processing RNA-Seq data.Bioinformatics. 2012 Oct 1;28(19):2532-3. doi: 10.1093/bioinformatics/bts477. Epub 2012 Jul 30. Bioinformatics. 2012. PMID: 22847932 Free PMC article.
-
Identifying local associations in biological time series: algorithms, statistical significance, and applications.Brief Bioinform. 2023 Sep 22;24(6):bbad390. doi: 10.1093/bib/bbad390. Brief Bioinform. 2023. PMID: 37930023 Review.
Cited by
-
EBSeq-HMM: a Bayesian approach for identifying gene-expression changes in ordered RNA-seq experiments.Bioinformatics. 2015 Aug 15;31(16):2614-22. doi: 10.1093/bioinformatics/btv193. Epub 2015 Apr 5. Bioinformatics. 2015. PMID: 25847007 Free PMC article.
-
Differential gene expression during floral transition in pineapple.Plant Direct. 2023 Nov 14;7(11):e541. doi: 10.1002/pld3.541. eCollection 2023 Nov. Plant Direct. 2023. PMID: 38028646 Free PMC article.
-
TIMEOR: a web-based tool to uncover temporal regulatory mechanisms from multi-omics data.Nucleic Acids Res. 2021 Jul 2;49(W1):W641-W653. doi: 10.1093/nar/gkab384. Nucleic Acids Res. 2021. PMID: 34125906 Free PMC article.
-
Analysis of Time-Series Gene Expression Data to Explore Mechanisms of Chemical-Induced Hepatic Steatosis Toxicity.Front Genet. 2018 Sep 18;9:396. doi: 10.3389/fgene.2018.00396. eCollection 2018. Front Genet. 2018. PMID: 30279702 Free PMC article.
-
GPrank: an R package for detecting dynamic elements from genome-wide time series.BMC Bioinformatics. 2018 Oct 4;19(1):367. doi: 10.1186/s12859-018-2370-4. BMC Bioinformatics. 2018. PMID: 30286713 Free PMC article.
References
-
- Conesa A, et al. maSigPro: a method to identify significantly differential expression profiles in time-course microarray experiments. Bioinformatics. 2006;22:1096–1102. - PubMed
-
- Dobson AJ. An Introduction to Generalized Linear Models. 2nd edn. Boca Ratón, FL: Chapman & Hall/CRC; 2002.
Publication types
MeSH terms
LinkOut - more resources
Full Text Sources
Other Literature Sources
Molecular Biology Databases
