. 2014 Aug;35(8):1881-90.
doi: 10.1093/carcin/bgu121. Epub 2014 Jun 3.

Nuclear adenomatous polyposis coli suppresses colitis-associated tumorigenesis in mice

Affiliations

Nuclear adenomatous polyposis coli suppresses colitis-associated tumorigenesis in mice

Maged Zeineldin et al. Carcinogenesis. 2014 Aug.

Abstract

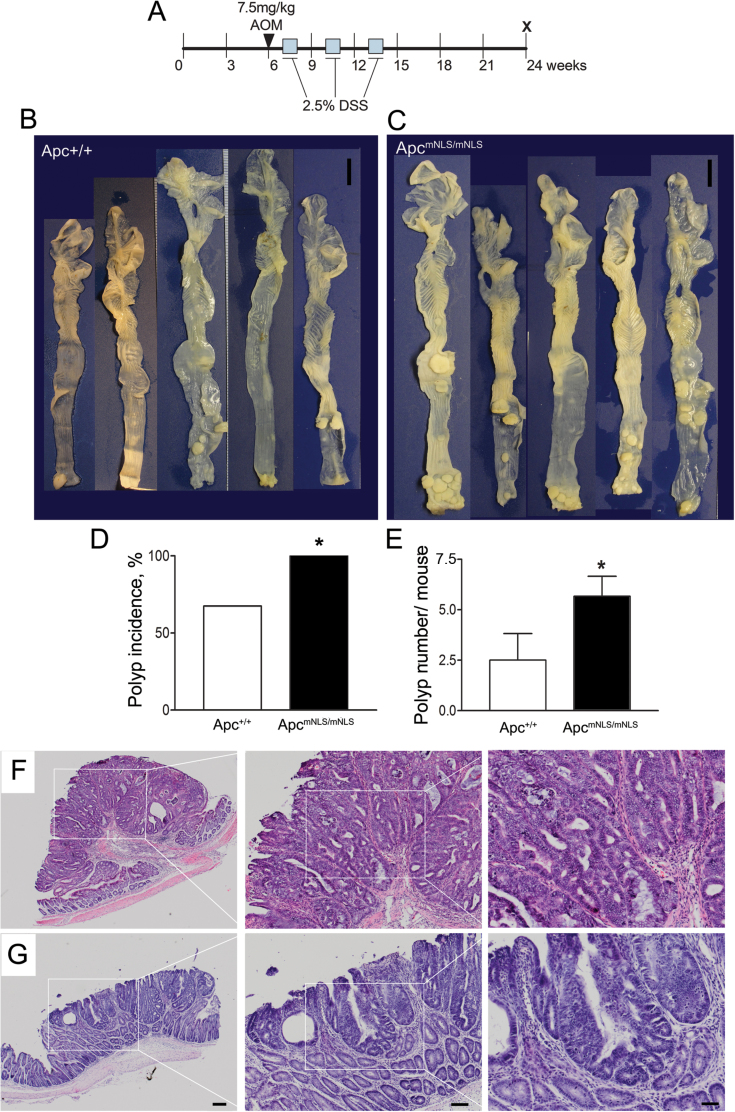
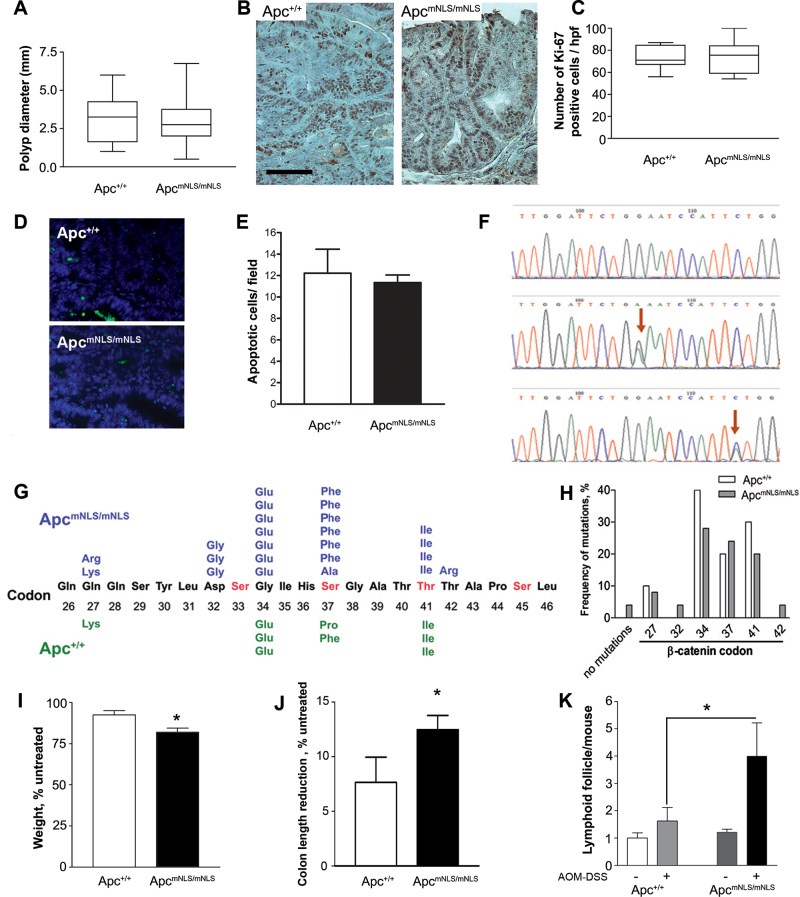
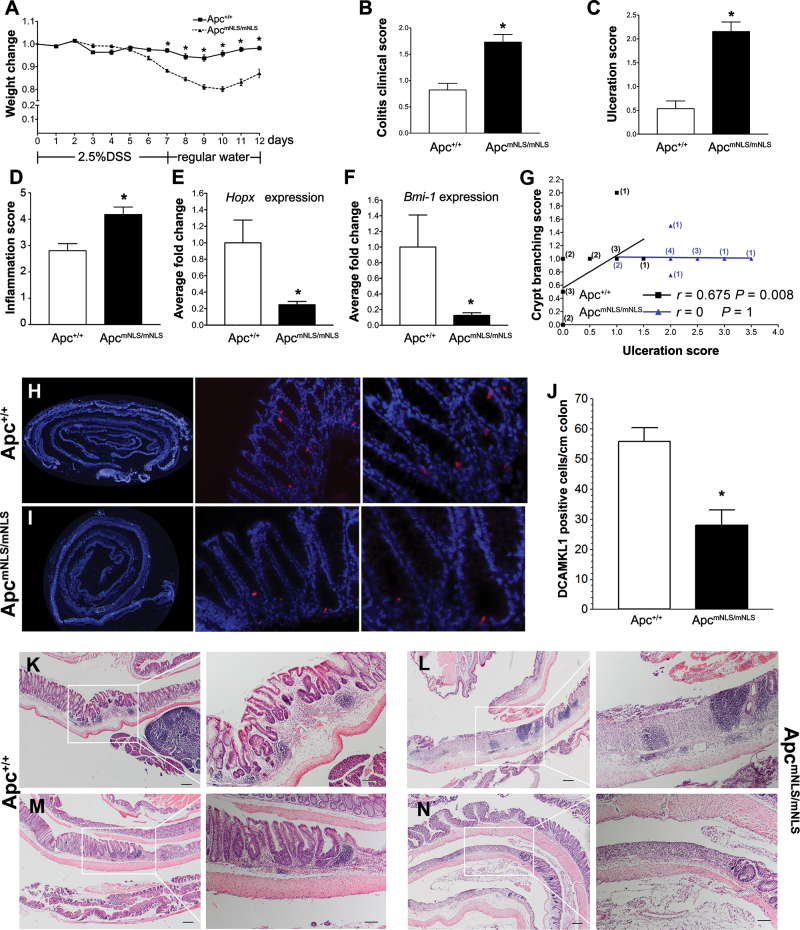
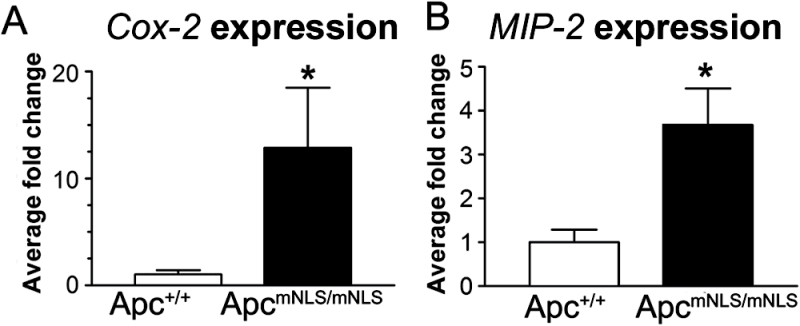
Mutation of tumor suppressor adenomatous polyposis coli (APC) initiates most colorectal cancers and chronic colitis increases risk. APC is a nucleo-cytoplasmic shuttling protein, best known for antagonizing Wnt signaling by forming a cytoplasmic complex that marks β-catenin for degradation. Using our unique mouse model with compromised nuclear Apc import (Apc(mNLS)), we show that Apc(mNLS/mNLS) mice have increased susceptibility to tumorigenesis induced with azoxymethane (AOM) and dextran sodium sulfate (DSS). The AOM-DSS-induced colon adenoma histopathology, proliferation, apoptosis, stem cell number and β-catenin and Kras mutation spectra were similar in Apc(mNLS/mNLS) and Apc(+/+) mice. However, AOM-DSS-treated Apc(mNLS/mNLS) mice showed more weight loss, more lymphoid follicles and edema, and increased colon shortening than treated Apc(+/+) mice, indicating a colitis predisposition. To test this directly, we induced acute colitis with a 7 day DSS treatment followed by 5 days of recovery. Compared with Apc(+/+) mice, DSS-treated Apc(mNLS/mNLS) mice developed more severe colitis based on clinical grade and histopathology. Apc(mNLS/mNLS) mice also had higher lymphocytic infiltration and reduced expression of stem cell markers, suggesting an increased propensity for chronic inflammation. Moreover, colons from DSS-treated Apc(mNLS/mNLS) mice showed fewer goblet cells and reduced Muc2 expression. Even in untreated Apc(mNLS/mNLS) mice, there were significantly fewer goblet cells in jejuna, and a modest decrease in colonocyte Muc2 expression compared with Apc(+/+) mice. Colonocytes from untreated Apc(mNLS/mNLS) mice also showed increased expression of inflammatory mediators cyclooxygenase-2 (Cox-2) and macrophage inflammatory protein-2 (MIP-2). These findings reveal novel functions for nuclear Apc in goblet cell differentiation and protection against inflammation-induced colon tumorigenesis.


Figures

Fig. 1.
Fig. 1.
ApcmNLS allele increases tumor incidence and multiplicity in AOM–DSS mouse model. AOM–DSS treatment protocol (A). Representative samples of large intestines from treated Apc+/+ (n = 8) mice (B) and ApcmNLS/mNLS (n = 15) mice (C). Scale bars = 1cm. (D) Polyp incidence calculated following polyp detected using a dissecting microscope with ×10 magnification. Significant differences are indicated with * (P < 0.05, Fisher’s exact test). (E) Average polyp number in AOM-DSS treated mice (P < 0.05, Student’s t-test). Histopathology of representative polypoidal (F) and semi-flat (G) colonic adenomas from AOM–DSS-treated ApcmNLS/mNLS mice. Higher magnifications of boxed areas are presented. Scale bars 200 µm (left panels), 100 µm (middle) and 50 µm (right). Error bars represent standard error of the mean throughout.
Fig. 2.
Fig. 2.
Polyps from AOM–DSS-treated ApcmNLS/mNLS mice do not differ in size, proliferation, apoptosis or β-catenin mutations, but treated ApcmNLS/mNLS mice are more prone to chronic inflammation. (A) Colon polyp diameters from AOM–DSS-treated ApcmNLS/mNLS and Apc+/+ mice presented as box and whiskers plots. (B) Representative images of Ki-67 staining, scale bar = 100 µm. (C) Box and whiskers plots of proliferation marker Ki-67-positive cells per 100×100 µm high-power field (hpf) from AOM–DSS-treated ApcmNLS/mNLS and Apc+/+ mice. (D) Representative images of TUNEL assay showing apoptotic cells in green and 4′,6-diamidino-2-phenylindole (DAPI)-stained nuclei in blue. (E) The average number of apoptotic cells per high-power field (×40) in tumors from AOM–DSS-treated Apc+/+ (upper panel) and ApcmNLS/mNLS (lower panel) mice. (F) Representative sequencing chromatographs showing a G→A (middle) or a C→T (lower) mutation (arrows) or the normal control β-catenin coding sequence (top). (G) Predicted amino acid alterations resulting from the missense mutations in exon 3 of β-catenin are presented for polyps from AOM–DSS-treated ApcmNLS/mNLS (top) and Apc+/+ (bottom) mice. (H) The distribution of β-catenin exon 3 mutations found in tumors from ApcmNLS/mNLS and Apc+/+ mice is displayed as the relative frequency at each codon. (I) The average weight change of AOM–DSS-treated mice is shown relative to the untreated mice from both ApcmNLS/mNLS and Apc+/+ groups (*P < 0.01, Student’s t-test). (J) The average reduction of colon length in AOM–DSS-treated mice as a percentage to the untreated mice (*P < 0.05, Student’s t-test). (K) The average number of visible colonic lymphoid follicles in untreated and AOM–DSS-treated mice (*P < 0.05, Student’s t-test). Error bars represent standard error of the mean throughout.
Fig. 3.
Fig. 3.
DSS induces more severe tissue damage and less effective tissue repair in ApcmNLS/mNLS mice. (A) Weight changes in 2.5% DSS-treated ApcmNLS/mNLS and Apc+/+ mice (treatment schematic shown below graph). * indicates P < 0.05, using Student’s t-test. (B) The average colitis severity clinical score in DSS-treated ApcmNLS/mNLS and Apc+/+ mice (P < 0.05, using Mann–Whitney test). (C and D) Histopathological scoring for ulceration (C) and inflammation (D) in DSS-treated ApcmNLS/mNLS and Apc+/+ mice (P < 0.05, using Mann–Whitney test). (E and F) Relative expression of the intestinal stem cell markers; Hopx (E) and Bmi1 (F) in DSS-treated Apc+/+ and ApcmNLS/mNLS mice (P < 0.05, using Mann–Whitney test). (G) Correlation between ulceration score and crypt branching score in 14 DSS-treated Apc+/+ (black squares) and 13 treated ApcmNLS/mNLS mice (blue triangles). The number of mice at each point are presented in black (Apc+/+) and blue (ApcmNLS/mNLS). (HJ) Intestinal stem cell marker DCAMKL (red) in colons from DSS-treated Apc+/+ (H) and ApcmNLS/mNLS (I) mice. The average number of positive cells/cm of colon from DSS-treated mice is presented in (J) (P < 0.05, Student’s t-test). (KN) Representative pictures of colonic lesions from DSS-treated Apc+/+ mice (K and M) and treated ApcmNLS/mNLS mice (L and N) showing inflammation with no ulceration and lymphocytic infiltration (K), ulceration with lymphocytic infiltrations (L), crypt branching (M) and ulceration (N). Scale bars 200 µm (left panels) and 100 µm (right panels).
Fig. 4.
Fig. 4.
ApcmNLS/mNLS mice have goblet cell defects. (AD) Alcian Blue-stained sections of colons in DSS-treated Apc+/+ (A and B) and ApcmNLS/mNLS mice (C and D). Left panels show the whole Swiss roll. The squared areas in the left panels are magnified in right panels. (E and F) Relative expression of Muc2 mRNA in DSS-treated (E) and untreated (F) Apc+/+ and ApcmNLS/ mNLS mice (*P < 0.05, using Mann–Whitney test). (G) Goblet cells represented as percentage of total cells per crypt in jejunum from untreated Apc+/+ and ApcmNLS/mNLS mice (*P < 0.05, using mixed statistical model as described in Materials and methods). Error bars throughout represent standard error of the mean.
Fig. 5.
Fig. 5.
Differential expression of inflammatory mediators in untreated ApcmNLS/mNLS mice. Relative expression of Cox-2 and MIP-2 in colon epithelial cells from untreated ApcmNLS/mNLS and Apc+/+ mice (*P < 0.05 using Mann–Whitney non-parametric test). Error bars represent standard error of the mean.

Similar articles

Cited by

References

    1. Terzić J., et al. (2010). Inflammation and colon cancer. Gastroenterology, 138, 2101–2114.e5 - PubMed
    1. Din F.V., et al. (2010). Effect of aspirin and NSAIDs on risk and survival from colorectal cancer. Gut, 59, 1670–1679 - PubMed
    1. Rowland K.J., et al. (2013). The role of growth factors in intestinal regeneration and repair in necrotizing enterocolitis. Semin. Pediatr. Surg., 22, 101–111 - PMC - PubMed
    1. Borrello M.G., et al. (2008). Inflammation and cancer: the oncogene-driven connection. Cancer Lett., 267, 262–270 - PubMed
    1. Camilleri M., et al. (2012). Intestinal barrier function in health and gastrointestinal disease. Neurogastroenterol. Motil., 24, 503–512 - PMC - PubMed

Publication types

MeSH terms