. 2014 Jun 4:5:3998.
doi: 10.1038/ncomms4998.

A Snail1/Notch1 signalling axis controls embryonic vascular development

Affiliations

A Snail1/Notch1 signalling axis controls embryonic vascular development

Zhao-Qiu Wu et al. Nat Commun. .

Abstract

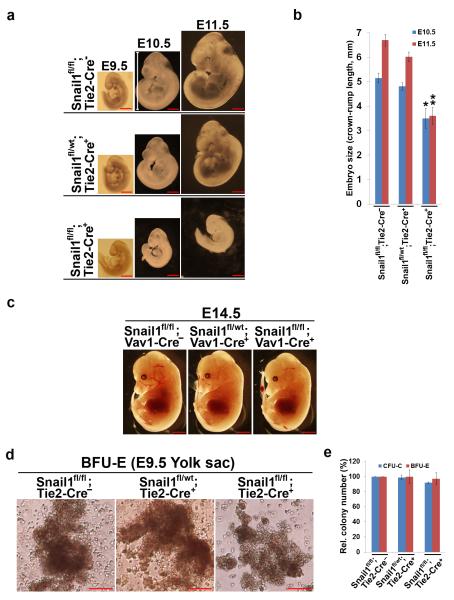
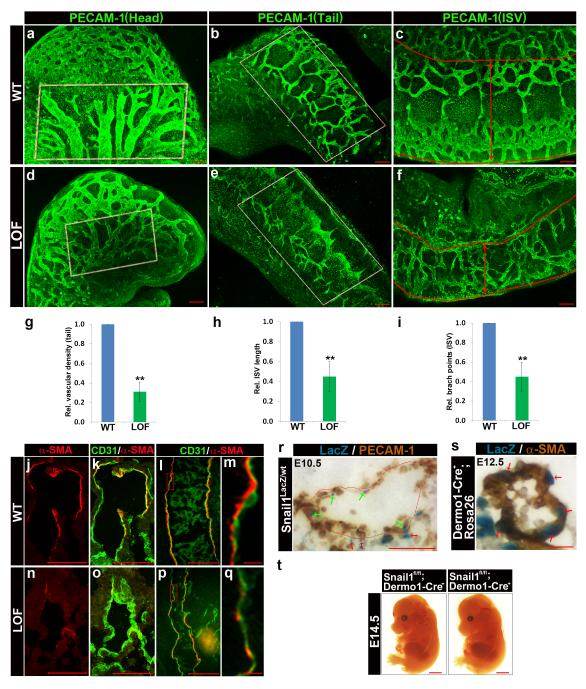
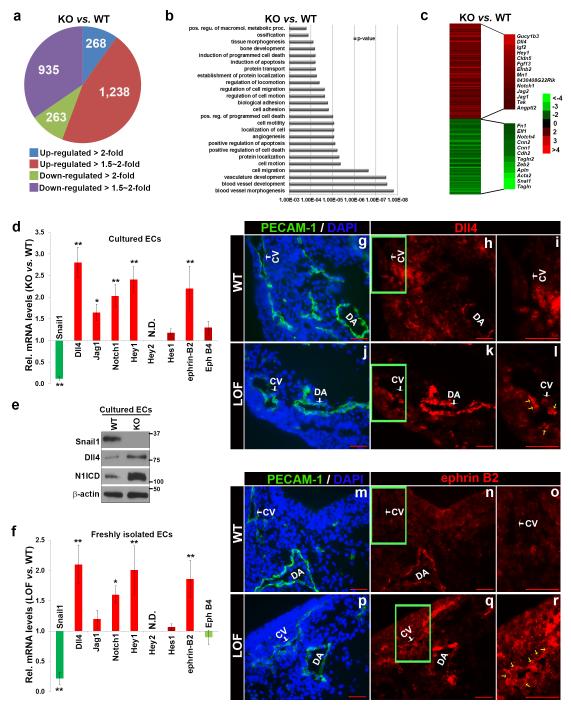
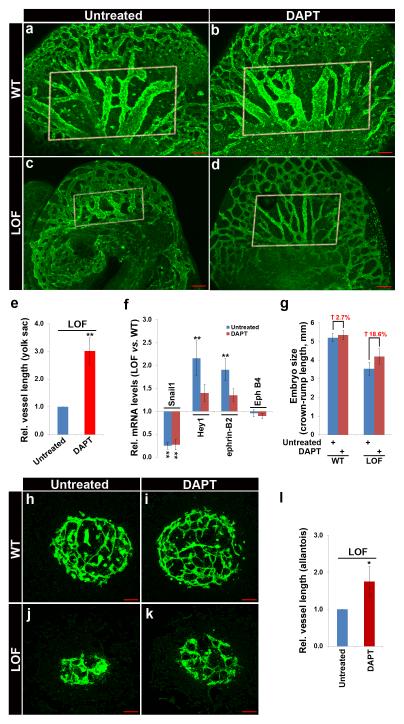
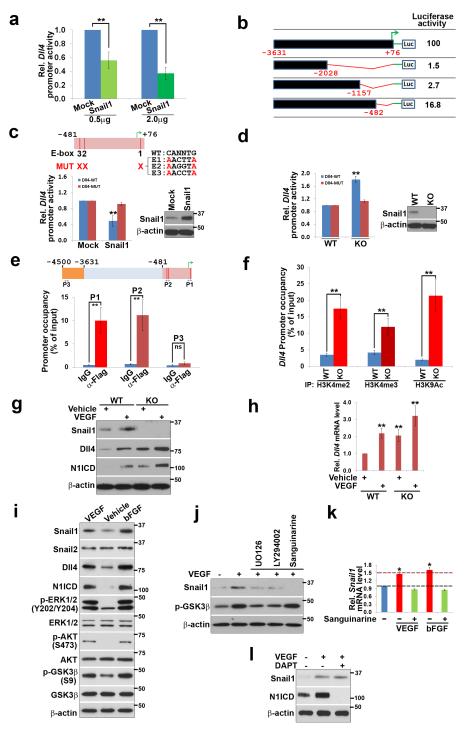
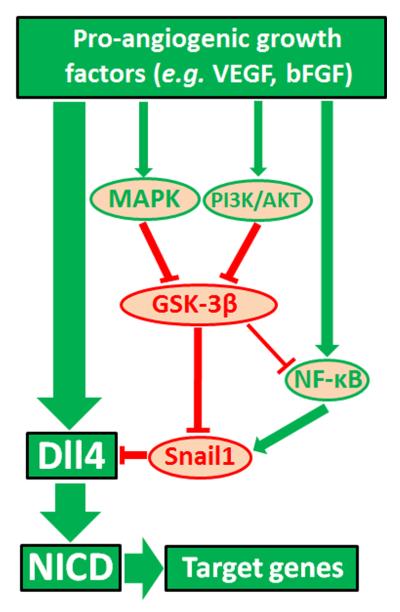
Notch1-Delta-like 4 (Dll4) signalling controls vascular development by regulating endothelial cell (EC) targets that modulate vessel wall remodelling and arterial-venous specification. The molecular effectors that modulate Notch signalling during vascular development remain largely undefined. Here we demonstrate that the transcriptional repressor, Snail1, acts as a VEGF-induced regulator of Notch1 signalling and Dll4 expression. EC-specific Snail1 loss-of-function conditional knockout mice die in utero with defects in vessel wall remodelling in association with losses in mural cell investment and disruptions in arterial-venous specification. Snail1 loss-of-function conditional knockout embryos further display upregulated Notch1 signalling and Dll4 expression that is partially reversed by inhibiting γ-secretase activity in vivo with Dll4 identified as a direct target of Snail1-mediated transcriptional repression. These results document a Snail1-Dll4/Notch1 axis that controls embryonic vascular development.


Figures

Figure 1
Figure 1. Endothelial-Specific Deletion of Snail1 Induces Embryonic Lethality
(a) Gross examination of whole embryos at the indicated stages of development. Note the significantly reduced size of Snail1fl/fl;Tie2-Cre+ embryos at E10.5 and E11.5. Scale bar: 1 mm. (b) Quantification of embryo size as indicated by crown-rump length (shown in [a]) (n=4 in each group). Data are presented as mean ± SEM. *, ** p < 0.05 and p < 0.01, respectively (ANOVA test). (c) Gross examination of whole embryos from Vav1-Cre crosses at E14.5. No differences were observed between Snail1fl/fl;Vav1-Cre+ mutants and their control littermates in size, stage or overall appearance. Scale bars: 2 mm. (d,e) In vitro differentiation analysis of yolk sac hematopoietic cells derived from E9.5 Snail1fl/fl;Tie2-Cre+ mutants and their control littermates. Representative photomicrographs of BFU-E colonies 7 d after plating are shown at left (d). Quantification of CFU-E and BFU-E colonies from yolk sacs (n=3 in each group) is shown to the right (e). Data are presented as mean ± SEM. Not significant, ANOVA. Scale bars: 50 μm.
Figure 2
Figure 2. Endothelial-Specific Deletion of Snail1 Derails Vascular Development
(a-f) Whole-mount PECAM-1 immunofluorescent staining of E10.5 WT (a-c) and Snail1 LOF (d-f) embryos. Defective remodeling and branching are highlighted in the cephalic (rectangled area in a and d), tail (rectangled area in b and e) and intersomitic vessels (area demarcated by dotted lines in c and f with ISV width of field marked by the double-headed arrows). Scale bar: 100 μm. (g-i) Quantification of relative vascular density in tail (PECAM-1 positive vessel area in rectangle box; g) vessels as well as vessel length (h) and branch points (defined as the junction point of 3 vessels; i) of ISV in WT and Snail1 LOF embryos (n=4 in each group). Data are presented as mean ± SEM. **p < 0.01, Student’s t test. (j-q) Cross-sections (j,k,n,o) and sagittal sections (l,m,p,q) obtained from E10.5 WT (j-m) and Snail1 LOF (n-q) embryos were stained with anti-PECAM and anti-α-SMA antibodies to detect ECs and vascular smooth muscle cells, respectively. Boxed areas in l and p are shown at higher magnification in m and q, respectively. The arteries in WT embryos are surrounded by α-SMA positive cells, whereas arteries in LOF embryos recruited few α-SMA positive cells. Scale bar: 50 μm (j,k,n,o); 100 μm (l,p) 10 μm (m,q). (r) Cross-sections from E10.5 Snail1LacZ/wt embryos were stained with X-Gal/lacZ followed by PECAM-1 immunohistochemical staining. Green or red arrows denote the Snail1-positive ECs and perivascular cells, respectively. Scale bar: 50 μm. (s) Cross-sections from E12.5 ROSA26;Dermo1-Cre+ embryos were stained with X-Gal/lacZ followed by α-SMA immunohistochemical staining. Red arrows mark dual-positive perivascular cells. Scale bar: 50 μm. (t) Gross examination of whole embryos from Dermo1-Cre crosses at E14.5. No differences were observed between Snail1fl/fl;Dermo1-Cre+ mutants and their control littermates in size, stage or overall appearance. Scale bar: 2 mm.
Figure 3
Figure 3. EC Snail1 Drives Vascular Remodeling in Extra-embryonic Tissues
(a,d) Gross examination of yolk sacs dissected from E10.5 WT (a) and Snail1 LOF (d) embryos. Scale bar: 2 mm. (b,e) Whole-mount PECAM-1 staining of yolk sac dissected from E10.5 WT (b) and Snail1 LOF (e) embryos. Insets, representative images of whole-mount α-SMA staining. Red lines mark continuous vessels with a diameter > 20 μm. Scale bar: 100 μm. (c,f) Gross examination of WT (c) and Snail1 LOF (f) embryos with yolk sac at E11.5. Note the absence of vascular structures in the LOF mutant yolk sacs. Scale bar: 2 mm. (g) Quantification of relative vessel (diameter > 20 μm) length in yolk sacs from E10.5 WT (b) and Snail1 LOF (e) embryos (n=4 each). Data are presented as mean ± SEM. **p < 0.01, Student’s t test. (h-m) Whole-mount PECAM-1 staining of allantois explants dissected from E8.25 WT (h-j) and Snail1 LOF (k-m) embryos. At pre-culture (h,k), vascularization of allantois explants derived from WT and Snail1 LOF embryos were comparable, whereas at 24 h post-culture, the Snail1 LOF embryo explants display marked defects in their ability to generate vascular structures (i,j,l,m). Cell nuclei were stained with TOTO3 (blue). Scale bar: 100 μm. (n) Quantification of relative vessel length in the WT and Snail1 LOF explant cultures (n = 5 in each group). Data are presented as mean ± SEM. **p < 0.01, Student’s t test.
Figure 4
Figure 4. Snail1 Regulates Angiogenic Program in a Xenograft Transplant Model
(a) Representative image of isolated ECs from eGFP+;Snail1fl/fl mice. Scale bar: 50 μm. (b) Adeno-β-gal or Adeno-Cre infected ECs were stimulated with vehicle or VEGF (100 ng/ml) for 12 h and subjected to Western blot analysis. Results are representative of 3 or more experiments. (c,d) Whole-mount PECAM-1 (CD 31) staining of the implants after 14 d in vivo. Scale bar: 50 μm. (c,g,I,k) Gross view of implants. Scale bar: 2 mm. (f,h,i,l) Whole-mount PECAM-1 staining of the implants. Scale bar: 100 μm. (m) Quantification of relative vessel length in the implants (n = 3 in each group). Data are presented as mean ± SEM. **, $$, ##p < 0.01, ANOVA test.
Figure 5
Figure 5. Upregulated Notch Signaling in Snail1-deleted ECs
(a-c) Transcriptional profiling analysis of cultured ECs derived from E10.5 Snail1fl/fl embryos and transduced in vitro with Adeno-β-gal or Adeno-Cre to induce Snail1 KO recombination. Pie chart depicts the distribution of total transcripts changed in Snail1-deleted ECs as compared to control ECs (a). Gene ontology (GO) analysis of Snail1-deleted vs. control ECs (b). Heat map representation of microarray data highlights the expression levels of key transcription factors, arterial-venous specification genes, EnMT-related genes as well as Notch signaling target genes (c). (d) RT-qPCR analysis of cultured ECs from (a). Snail1 KO ECs presented significantly higher levels of Dll4, Jag1, Notch1, Hey1 and ephrin-B2. Data are presented as mean ± SEM (n=3). *p < 0.05, **p < 0.01, Student’s t test. (e) Western blot analysis of cultured ECs from (a). (f) RT-qPCR analysis of ECs freshly isolated from E10.5 WT and Snail1 KO embryos. ECs isolated from Snail1 LOF embryos displayed significantly higher levels of Dll4, Notch1, Hey1 and ephrin-B2 (n=6 each). Data are presented as mean ± SEM. *p < 0.05, **p < 0.01, Student’s t test. (g-l) Cross-sections from E10.5 WT and Snail1 LOF mutant embryos were co-stained with anti-PECAM-1 and anti-Dll4 antibodies. Cell nuclei were stained with DAPI (blue). [i] and [l], magnified area in [h] and [k], respectively. Yellow arrow depicts Dll4-positive ECs in CV region. Scale bars: 50 μm. (m-r) Cross-sections from E10.5 WT and Snail1 LOF mutant embryos were co-stained with anti-PECAM-1 and anti-ephrin B2 antibodies. Cell nuclei were stained with DAPI (blue). [o] and [r], magnified area in [n] and [q], respectively. Yellow arrow depicts ephrin B2-positive ECs in CV region. Scale bars: 50 μm.
Figure 6
Figure 6. Administration of DAPT Partially Reverses Snail1 Deletion-Induced Vascular Defects
(a-d) Confocal analysis of PECAM-1 stained whole-mounted untreated (a,c) or DAPT-treated embryos (b,d). Rectangled area highlights improved vascular remodeling in DAPT treated Snail1 LOF mutant embryos. Scale bar: 100 μm. (e) Quantification of relative vessel length in yolk sacs from E10.5 untreated and DAPT treated Snail1 LOF embryos (n=4 each). Data are presented as mean ± SEM. *p < 0.05, **p < 0.01, Student’s t test. (f) RT-qPCR analysis of ECs freshly isolated from untreated or DAPT treated E10.5 embryos (n=4 each). Data are presented as mean ± SEM. **p < 0.01, Student’s t test. (g) Quantification of embryo size in a-d above. (h-k) Allantoises dissected from WT (h,i) and Snail1 LOF mutant (j,k) embryos were cultured in the presence of vehicle (h,j) or 8 μM DAPT (i,k) for 24 h and ECs visualized by whole-mount PECAM-1 staining. Scale bar: 100 μm. (l) Quantification of relative vessel length in allantoises (n=4 each). Data are presented as a mean ± SEM. **p < 0.05, Student’s t test.
Figure 7
Figure 7. EC Snail1 Regulates Notch Activity through Direct Transcriptional Repression of Dll4
(a) ECs derived from E10.5 Snail1fl/fl embryos were electroporated with a mock or Snail1 expression vector (0.5 μg or 2.0 μg) in combination with 0.5 μg of a mouse Dll4 promoter reporter construct and luciferase activity determined. (mean ± SEM; n=3). *p < 0.05, **p < 0.01, Student’s t test. (b) ECs from (A) were electroporated with full-length or deleted Dll4 promoter reporter constructs and subjected to luciferase assay (results are of 3 experiments performed). (c) Diagram depicts the mutations in the three E-boxes located within the proximal region of the mouse Dll4 promoter. Cultured ECs from (a) were electroporated with mock or human Snail1 expression vectors in combination with wild type (WT) or mutated (MUT) Dll4 promoter reporter constructs. Luciferase assays and Western blot analysis are shown. (mean ± SEM; n=3). **p < 0.01, Student’s t test. (d) Cultured control or Snail1-deleted ECs were electroporated with WT or MUT Dll4 promoter reporter constructs for luciferase assay (left) and Western blot analysis (right). (mean ± SEM; n=3). **p < 0.01, Student’s t test. (e) Snail1-Dll4 promoter interactions in ECs expressing a Snail1 expression vector were assessed within the indicated regions (P1~P3) by ChIP/qPCR. (mean ± SEM; n=3). **p < 0.01, Student’s t test. (f) Lysates from cultured control or Snail1-deleted ECs were subjected to ChIP analysis using antibodies directed against H3K4me2, H3K4me3 or H3K9Ac and Dll4 occupancy determined by qPCR. (mean ± SEM; n=3). **p < 0.01, Student’s t test. (g,h) Control and Snail1-deleted ECs were treated with vehicle or VEGF for 12 h, and subjected to Western blot (g) or RT-qPCR analysis (h), respectively. Western results are representative of 3 experiments with RT-qPCR results presented as mean ± SEM (n=3). **p < 0.01, ANOVA. (i) WT ECs were stimulated with vehicle, VEGF (100 ng/ml) or bFGF (20 ng/ml) for 12 h and subjected to Western blot analysis. Results are representative of 3 or more experiments. (j,k) WT ECs were pretreated with U0126 (20 μM), LY294002 (10 μM) or sanguinarine (2.5 μM) for 1 h followed by stimulation with VEGF or bFGF for 12 h. Cell lysates were prepared and subjected to Western blot (j) and RT-qPCR (k) analysis, respectively. Western results representative of 3 experiments with RT-qPCR results presented as mean ± SEM (n=3). **p < 0.01, ANOVA. (l) WT ECs were pretreated with vehicle or DAPT (8 μM) for 1 h followed by stimulation with VEGF (100 ng/ml) for 12 h. Cell lysates were prepared and subjected to Western blot analysis. Results are representative of 3 experiments.
Figure 8
Figure 8. Snail-Dependent Control of a Notch1-Dll4 Regulatory Cascade
Schematic outlining the ability of VEGF or bFGF to up-regulate Dll4 expression and Notch signaling while simultaneously modulating Dll4 expression levels by co-inducing Snail1 resulting in Dll4 transcriptional repression.

References

    1. Phng LK, Gerhardt H. Angiogenesis: a team effort coordinated by Notch. Dev. Cell. 2009;16:196–208. - PubMed
    1. de la Pompa JL, Epstein JA. Coordinating tissue interactions: Notch signaling in cardiac development and disease. Dev. Cell. 2012;22:244–254. - PMC - PubMed
    1. Limbourg FP, et al. Essential role of endothelial Notch1 in angiogenesis. Circulation. 2005;111:1826–1832. - PMC - PubMed
    1. Trindade A, et al. Overexpression of delta-like 4 induces arterialization and attenuates vessel formation in developing mouse embryos. Blood. 2008;112:1720–1729. - PMC - PubMed
    1. Venkatesh DA, et al. Cardiovascular and hematopoietic defects associated with Notch1 activation in embryonic Tie2-expressing populations. Circ. Res. 2008;103:423–431. - PMC - PubMed

Publication types

MeSH terms

Substances

Associated data