

Rate of steroid double-bond reduction catalysed by the human steroid 5β-reductase (AKR1D1) is sensitive to steroid structure: implications for steroid metabolism and bile acid synthesis
- PMID: 24894951
- PMCID: PMC4163838
- DOI: 10.1042/BJ20140220
Rate of steroid double-bond reduction catalysed by the human steroid 5β-reductase (AKR1D1) is sensitive to steroid structure: implications for steroid metabolism and bile acid synthesis
Abstract
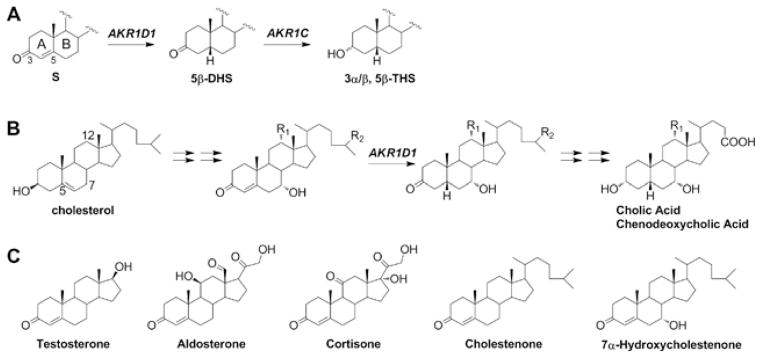
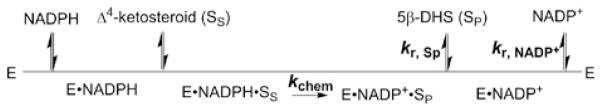
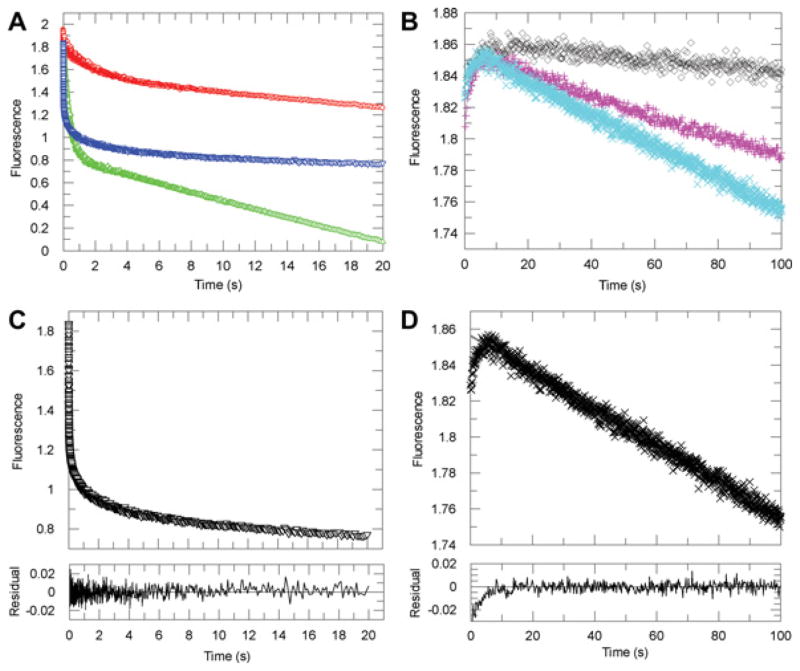
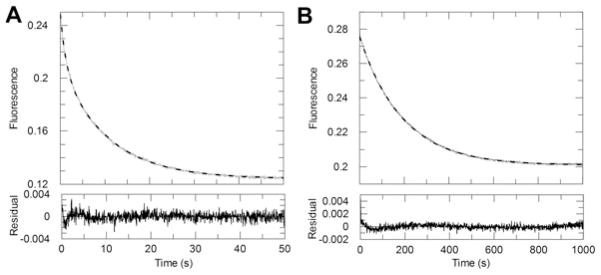
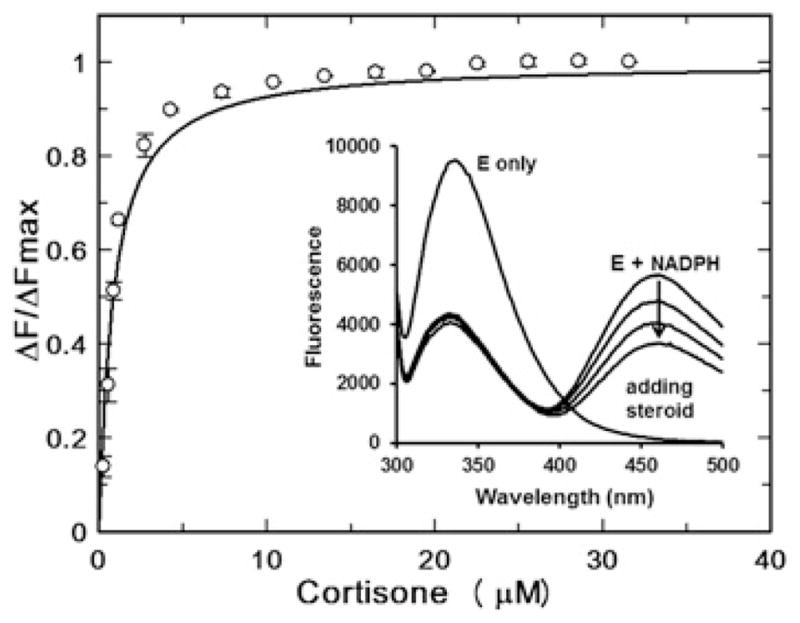
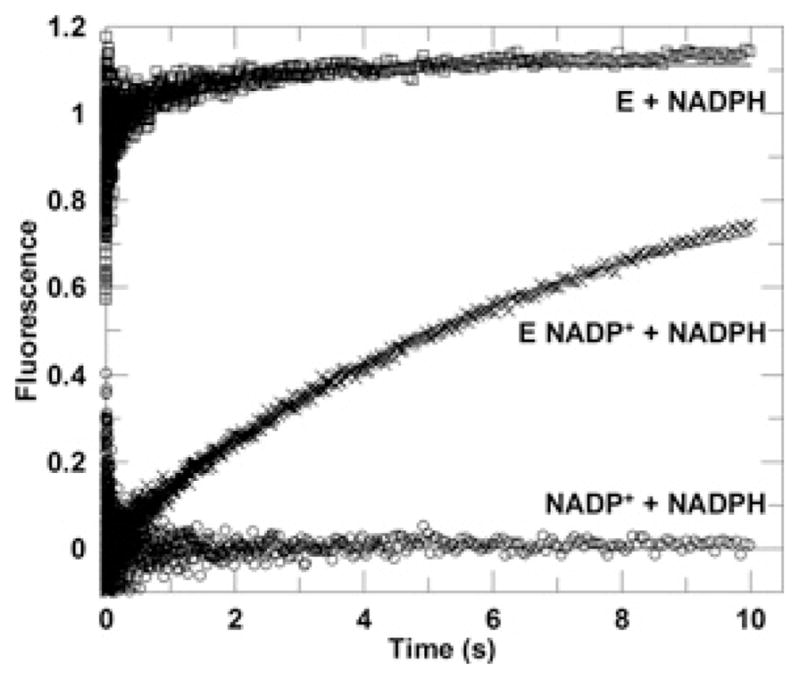
Human AKR1D1 (steroid 5β-reductase/aldo-keto reductase 1D1) catalyses the stereospecific reduction of double bonds in Δ4-3-oxosteroids, a unique reaction that introduces a 90° bend at the A/B ring fusion to yield 5β-dihydrosteroids. AKR1D1 is the only enzyme capable of steroid 5β-reduction in humans and plays critical physiological roles. In steroid hormone metabolism, AKR1D1 serves mainly to inactivate the major classes of steroid hormones. AKR1D1 also catalyses key steps of the biosynthetic pathway of bile acids, which regulate lipid emulsification and cholesterol homoeostasis. Interestingly, AKR1D1 displayed a 20-fold variation in the kcat values, with steroid hormone substrates (e.g. aldosterone, testosterone and cortisone) having significantly higher kcat values than steroids with longer side chains (e.g. 7α-hydroxycholestenone, a bile acid precursor). Transient kinetic analysis revealed striking variations up to two orders of magnitude in the rate of the chemistry step (kchem), which resulted in different rate determining steps for the fast and slow substrates. By contrast, similar Kd values were observed for representative fast and slow substrates, suggesting similar rates of release for different steroid products. The release of NADP+ was shown to control the overall turnover for fast substrates, but not for slow substrates. Despite having high kchem values with steroid hormones, the kinetic control of AKR1D1 is consistent with the enzyme catalysing the slowest step in the catabolic sequence of steroid hormone transformation in the liver. The inherent slowness of the conversion of the bile acid precursor by AKR1D1 is also indicative of a regulatory role in bile acid synthesis.
Figures
Similar articles
-
In-Depth Dissection of the P133R Mutation in Steroid 5β-Reductase (AKR1D1): A Molecular Basis of Bile Acid Deficiency.Biochemistry. 2015 Oct 20;54(41):6343-51. doi: 10.1021/acs.biochem.5b00816. Epub 2015 Oct 6. Biochemistry. 2015. PMID: 26418565 Free PMC article.
-
The rate-determining steps of aldo-keto reductases (AKRs), a study on human steroid 5β-reductase (AKR1D1).Chem Biol Interact. 2015 Jun 5;234:360-5. doi: 10.1016/j.cbi.2014.12.004. Epub 2014 Dec 11. Chem Biol Interact. 2015. PMID: 25500266 Free PMC article.
-
Crystal structure of human liver Delta4-3-ketosteroid 5beta-reductase (AKR1D1) and implications for substrate binding and catalysis.J Biol Chem. 2008 Jun 13;283(24):16830-9. doi: 10.1074/jbc.M801778200. Epub 2008 Apr 11. J Biol Chem. 2008. PMID: 18407998 Free PMC article.
-
5β-Reduced steroids and human Δ(4)-3-ketosteroid 5β-reductase (AKR1D1).Steroids. 2014 May;83:17-26. doi: 10.1016/j.steroids.2014.01.013. Epub 2014 Feb 8. Steroids. 2014. PMID: 24513054 Free PMC article. Review.
-
Role of aldo-keto reductase family 1 (AKR1) enzymes in human steroid metabolism.Steroids. 2014 Jan;79:49-63. doi: 10.1016/j.steroids.2013.10.012. Epub 2013 Nov 1. Steroids. 2014. PMID: 24189185 Free PMC article. Review.
Cited by
-
AKR1D1 regulates glucocorticoid availability and glucocorticoid receptor activation in human hepatoma cells.J Steroid Biochem Mol Biol. 2019 May;189:218-227. doi: 10.1016/j.jsbmb.2019.02.002. Epub 2019 Feb 12. J Steroid Biochem Mol Biol. 2019. PMID: 30769091 Free PMC article.
-
In-Depth Dissection of the P133R Mutation in Steroid 5β-Reductase (AKR1D1): A Molecular Basis of Bile Acid Deficiency.Biochemistry. 2015 Oct 20;54(41):6343-51. doi: 10.1021/acs.biochem.5b00816. Epub 2015 Oct 6. Biochemistry. 2015. PMID: 26418565 Free PMC article.
-
Prognostic Prediction and Immune Microenvironment Characterization in Uveal Melanoma: A Novel Mitochondrial Metabolism-Related Gene Signature.ACS Omega. 2024 Oct 10;9(42):43034-43045. doi: 10.1021/acsomega.4c06294. eCollection 2024 Oct 22. ACS Omega. 2024. PMID: 39464480 Free PMC article.
-
Regulation Network and Prognostic Significance of Aldo-Keto Reductase (AKR) Superfamily Genes in Hepatocellular Carcinoma.J Hepatocell Carcinoma. 2021 Aug 30;8:997-1021. doi: 10.2147/JHC.S323743. eCollection 2021. J Hepatocell Carcinoma. 2021. PMID: 34513744 Free PMC article.
-
Dysregulation of Δ4-3-oxosteroid 5β-reductase in diabetic patients: Implications and mechanisms.Mol Cell Endocrinol. 2018 Jul 15;470:127-141. doi: 10.1016/j.mce.2017.10.005. Epub 2017 Oct 9. Mol Cell Endocrinol. 2018. PMID: 29024782 Free PMC article.
References
-
- Jez JM, Flynn TG, Penning TM. A new nomenclature for the aldo-keto reductase superfamily. Biochem Pharmacol. 1997;54:639–647. - PubMed
-
- Kondo KH, Kai MH, Setoguchi Y, Eggertsen G, Sjoblom P, Setoguchi T, Okuda KI, Bjorkhem I. Cloning and expression of cDNA of human Δ4–3-oxosteroid 5β-reductase and substrate specificity of the expressed enzyme. Eur J Biochem. 1994;219:357–363. - PubMed
-
- Roberts S, Szego CM. Biochemistry of the steroid hormones. Annu Rev Biochem. 1955;24:543–596. - PubMed
-
- Tomkins GM. Enzymatic mechanisms of hormone metabolism. I Oxidation-reduction of the steroid nucleus. Recent Prog Horm Res. 1956;12:125–133. - PubMed
-
- Belelli D, Lambert JJ. Neurosteroids: endogenous regulators of the GABAA receptor. Nat Rev Neurosci. 2005;6:565–575. - PubMed
Publication types
MeSH terms
Substances
Grants and funding
LinkOut - more resources
Full Text Sources
Other Literature Sources
Medical