. 2014 Jul 25;289(30):20543-58.
doi: 10.1074/jbc.M114.549220.

Poly(ADP-ribose) polymerase inhibitors sensitize cancer cells to death receptor-mediated apoptosis by enhancing death receptor expression

Poly(ADP-ribose) polymerase inhibitors sensitize cancer cells to death receptor-mediated apoptosis by enhancing death receptor expression

X Wei Meng et al. J Biol Chem. .

Abstract

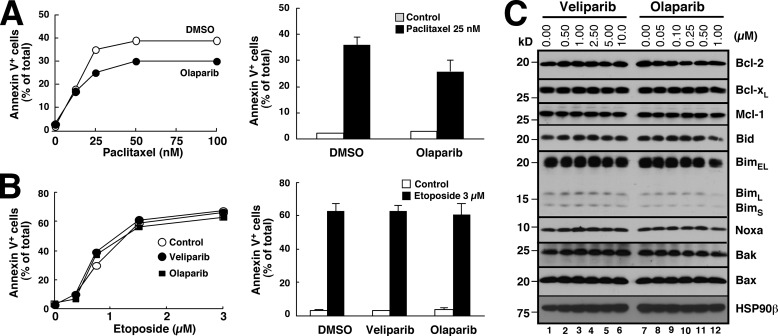
Recombinant human tumor necrosis factor-α-related apoptosis inducing ligand (TRAIL), agonistic monoclonal antibodies to TRAIL receptors, and small molecule TRAIL receptor agonists are in various stages of preclinical and early phase clinical testing as potential anticancer drugs. Accordingly, there is substantial interest in understanding factors that affect sensitivity to these agents. In the present study we observed that the poly(ADP-ribose) polymerase (PARP) inhibitors olaparib and veliparib sensitize the myeloid leukemia cell lines ML-1 and K562, the ovarian cancer line PEO1, non-small cell lung cancer line A549, and a majority of clinical AML isolates, but not normal marrow, to TRAIL. Further analysis demonstrated that PARP inhibitor treatment results in activation of the FAS and TNFRSF10B (death receptor 5 (DR5)) promoters, increased Fas and DR5 mRNA, and elevated cell surface expression of these receptors in sensitized cells. Chromatin immunoprecipitation demonstrated enhanced binding of the transcription factor Sp1 to the TNFRSF10B promoter in the presence of PARP inhibitor. Knockdown of PARP1 or PARP2 (but not PARP3 and PARP4) not only increased expression of Fas and DR5 at the mRNA and protein level, but also recapitulated the sensitizing effects of the PARP inhibition. Conversely, Sp1 knockdown diminished the PARP inhibitor effects. In view of the fact that TRAIL is part of the armamentarium of natural killer cells, these observations identify a new facet of PARP inhibitor action while simultaneously providing the mechanistic underpinnings of a novel therapeutic combination that warrants further investigation.


Figures

FIGURE 1.
FIGURE 1.
PARP inhibitors synergistically enhance TRAIL-induced apoptosis in ML-1 cells. A, ML-1 cells were pretreated with the indicated PARP inhibitor for 24 h followed by the addition of diluent or 12.5 ng/ml TRAIL for an additional 24 h. At the completion of incubation, cells were stained with APC-conjugated annexin V and analyzed by flow microfluorimetry. The percentage of annexin V-positive cells is indicated in each histogram. B and D, summary of experiments performed with veliparib (B) and olaparib (D) as depicted in panel A. Left panels show results of single experiments using varying concentrations of TRAIL along with varying concentrations of veliparib (top) or olaparib (bottom). Right panels, CI values calculated by the method of Chou and Talalay (44) from results shown in the left hand graphs. Note that CI < 1.0 indicates synergy. C and E, summarized results obtained with varying concentrations of each PARP inhibitor at 6.25 ng/ml TRAIL. Error bars, ±S.D. of three independent experiments. *, p < 0.01 compared with TRAIL treatment without PARP inhibitor. Values at intermediate PARP inhibitor concentrations approached but did not reach p < 0.05 after Bonferroni correction.
FIGURE 2.
FIGURE 2.
PARP inhibitors enhance killing by multiple death ligands and in multiple cell lines. A and B, ML-1 cells were pretreated with the indicated PARP inhibitor for 24 h followed by the addition of diluent or varying concentrations of agonistic anti-DR5 antibody for 24 h (A) or CH.11 agonistic anti-Fas antibody for 48 h (B). Bar graphs show summarized results from cells treated with 500 ng/ml DR5 agonistic antibody (A) or 100 ng/ml agonistic anti-Fas antibody (B). *, p < 0.02 relative to TRAIL treatment without PARP inhibitor. Values with veliparib approached but did not reach p < 0.05 after Bonferroni correction. C, K562 cells were pretreated with veliparib (left) or olaparib (middle) for 24 h followed by the addition of diluent or varying concentrations of TRAIL for additional 24 h. The bar graph (right) shows summarized results from cells treated with 25 ng/ml TRAIL in the absence or presence of PARP inhibitors. *, p < 0.03 relative to TRAIL treatment without PARP inhibitor. Values with olaparib approached but did not reach p < 0.05 with Bonferroni correction. D, A549 cells were treated with 0.5 μm olaparib for 24 h followed with diluent or 60 ng/ml TRAIL for an additional 24 h. Cells were stained with propidium iodide (PI), and the percentage of subdiploid cells was quantified by flow microfluorimetry. Histograms (left) show cell cycle distributions and the appearance of subdiploid cells. Bar graph (right) shows the summarized results. E, PEO1 cells were pretreated with diluent or 1 μm olaparib for 24 h followed by the addition of diluent or varying concentrations of TRAIL for additional 24 h. Apoptosis was assayed by propidium iodide staining as illustrated in panel D. *, p < 0.05 relative to TRAIL treatment without PARP inhibitor. F, HCT116 cells were pretreated with diluent or 0.5 μm olaparib for 24 h followed by the addition of diluent or varying concentrations of TRAIL for additional 3.5 h. Apoptosis was assayed by propidium iodide staining as illustrated in panel D. Bar graph (right) shows summarized results at the indicated TRAIL concentrations. Error bars in A–F, ±S.D. of three (A-C, E, and F) or four (D) independent experiments.
FIGURE 3.
FIGURE 3.
PARP inhibitors do not affect apoptosis triggered by paclitaxel or etoposide. A and B, ML-1 cells were pretreated with diluent, 0.5 μm olaparib, or 5 μm veliparib as indicated for 24 h followed by the addition of varying concentrations of paclitaxel (A) or etoposide (B) for an additional 24 h. Apoptosis was assayed by annexin V binding assay. The right panels show summarized results obtained with 25 nm paclitaxel (A) or 3 μm etoposide (B). Error bars, ±S.D. of three independent experiments. C, ML-1 cells were treated with PARP inhibitors for 48 h. Whole cell lysates (50 μg of protein) were subjected to SDS-PAGE, transferred to nitrocellulose, and probed for the indicated antigens. HSP90β served as a loading control. Numbers at the left of all blots indicate migration of molecular mass markers (kDa).
FIGURE 4.
FIGURE 4.
PARP inhibitors increase death ligand-induced procaspase-8 cleavage upstream of caspase-3 activation. A, the same whole cell lysates shown in Fig. 3C were also probed with antibodies to the indicated DISC components. B, ML-1 cells were pretreated with diluent, 0.5 μm olaparib, or 5 μm veliparib for 24 h followed by the addition of diluent or 6.25 ng/ml TRAIL for additional 24 h in the presence of 20 μm DEVD-fmk. C, ML-1 cells were pretreated with diluent or 0.5 μm olaparib for 24 h followed by the addition of diluent or 100 ng/ml CH.11 for an additional 24 h in the presence (C, lanes 3 and 4) or absence (C, lanes 5 and 6) of 20 μm DEVD-fmk.
FIGURE 5.
FIGURE 5.
PARP inhibitor up-regulates Fas and DR5 expression. A, ML-1 cells were pretreated with 0.5 μm olaparib for 48 h followed by the addition of diluent or 75 ng/ml CH.11 for an additional 16 h in the presence of 5 μm Q-VD-OPh. After cells were lysed, Fas DISC was immunoprecipitated from 27 mg of cell lysates using anti-mouse IgM precoupled to protein A and protein G beads. Immunoprecipitates were subjected to SDS-PAGE and immunoblotting with the antibodies indicated. The bar graph (right) shows the relative signal densities obtained from densitometric analysis of multiple blots using Image J software. Error bars, ±S.D. from three independent experiments with blots exposed in the linear range. *, p < 0.025 compared with cells treated with DMSO. B, after ML-1 cells were treated with 0.5 μm olaparib for 48 h, procaspase-8 was immunoprecipitated. Non-immune mouse IgG (mIgG) served as a control. Also included on gels were cell lysates (50 μg of protein) from ML-1 cells treated with diluent or 1 mm methyl methanesulfonate (MMS) for 15 min to induce formation of pADPr. The dashed line indicates juxtaposition of nonadjacent lanes from the same pieces of x-ray film. *, nonspecific band. C, after ML-1 cells were treated with DMSO (filled), 5 μm veliparib (dotted line), or 0.5 μm olaparib (solid line) for 48 h, cell surface Fas and DR5 were assayed as described under “Experimental Procedures.” D and E, cell surface Fas (D) or DR5 (E) was assayed on ML-1 cells treated with diluent or varying concentrations of PARP inhibitors for 48 h. Data are presented as the corrected mean fluorescence intensity (MFI) calculated by subtracting the MFI of isotype-matched IgG control from that of APO-1 or anti-DR5 stained cells. Bar graphs (mean ± S.D. of three independent experiments) show results from cells treated with DMSO, 5 μm veliparib, or 0.5 μm olaparib. * and **, p < 0.05 and p = 0.06 relative to diluent-treated cells after Bonferroni correction. F and G, FAS expression was assayed on ML-1 cells isolated after growth as xenografts in mice treated with either vehicle or olaparib in vivo for 54 h (6 h after the 3rd daily dose) using antibodies that react only with human death receptors. Histograms show CH.11 or APO-1 binding. Filled, samples from vehicle-treated mice (black, isotype controls; gray, CH.11 or APO-1); Open, samples from olaparib-treated mice (gray, isotype controls; black, CH.11 or APO-1). Bar graphs show summarized corrected Fas MFIs. Error bars, ±S.D. from 4 mice in each group. p values were calculated by 2-tailed, unpaired Student's t test.
FIGURE 6.
FIGURE 6.
Increased detection of cell surface Fas does not require ligand-induced receptor retention on the cell surface. A, histograms show the CH.11 binding at 37 °C from ML-1 cells that were pretreated with diluent or 0.5 μm olaparib for 48 h followed by the addition of IgM control or 200 ng/ml CH.11 in the presence of 5 μm Q-VD-OPH for an additional 16 h at 37 °C. B, CH.11 binding was assayed as shown in A after ML-1 cells were pretreated with diluent or 0.5 μm olaparib for 48 h followed by varying CH.11 concentrations for an additional 16 h in the presence of 5 μm Q-VD-OPh to prevent CH.11-induced apoptosis. The bar graph (right) shows the summarized results (mean ± S.D.) from three independent experiments. * and **, p < 0.03 and p = 0.003, respectively, relative to diluent-treated cells. C, after pretreatment with DMSO, 5 μm veliparib or 0.5 μm olaparib for 48-h ML-1 cells were assayed for binding of CH.11 (200 ng/5 × 105 cells) or CD71 (1 μg/5 × 105 cells) at 4 °C. Error bars, ±S.D. of three independent experiments. *, p < 0.002 relative to diluent-treated cells. MFI, mean fluorescence intensity.
FIGURE 7.
FIGURE 7.
PARP inhibition increases Fas and DR5 promoter activity. A, after ML-1 cells were treated with 0.5 μm olaparib for 48 h, FAS and DR5 mRNA levels were quantified by qRT-PCR and normalized to GAPDH mRNA. B and C, ML-1 cells were treated with DMSO or 0.5 μm olaparib for 48 h followed by the addition of 2.4 μm actinomycin D in the presence of 5 μm Q-VD-OPh for the indicated lengths of time. Fas (B) and DR5 (C) mRNA were quantified by qRT-PCR and normalized to GAPDH mRNA. D, 12 h after transfection with Fas or DR5 promoter-luciferase reporter plasmid (10 μg) in the presence of 5 μm Q-VD-OPh, ML-1 cells were treated with 0.5 μm olaparib for additional 20 h. Luciferase activity was assayed and normalized to protein concentrations. Error bars in A and D, ±S.D. of at least four independent experiments.
FIGURE 8.
FIGURE 8.
PARP1 and PARP2 suppress death receptor expression. A, qRT-PCR shows the efficiency of knockdown PARP isoforms by the indicated PARP shRNA. mRNA levels were normalized to GAPDH mRNA. B, relative cell surface DR5 expression on ML-1 cells with stable PARP family member knockdown was assessed as depicted in Fig. 5C. *, p < 0.01 relative to control shRNA, PARP3 and PARP4 shRNA after Bonferroni correction. C, ML-1 cells with stable knockdown of the indicated PARP family member were treated with the indicated concentrations of TRAIL for 24 h. Annexin V-positive cells were assayed as illustrated in Fig. 1A. Left panel, representative experiment. Right panel, summarized results of three independent experiments with the indicated TRAIL concentrations. *, p < 0.025 after Bonferroni correction relative to cells expressing control shRNA, PARP3 shRNA, or PARP4 shRNA treated with the same TRAIL concentration. D, relative cell surface Fas expression on ML-1 cells with stable PARP family member knockdown was assayed using CH.11 (left) or APO-1 (right) as a probe. *, p ≤ 0.001 relative to control shRNA, PARP3 shRNA, or PARP4 shRNA after Bonferroni correction. E, after ML-1 cells stably transfected with the indicated PARP family shRNA were treated with the indicated concentrations of CH.11 for 48 h, annexin V-positive cells were assayed as illustrated in Fig. 1A. *, p < 0.005 after Bonferroni correction relative to cells expressing control shRNA, PARP3 shRNA, or PARP4 shRNA treated the same CH.11 concentration. F, beginning 24 h after transfection with plasmid encoding EGFP-histone H2B along with PARP1 siRNA or control siRNA, K562 cells were incubated with the indicated TRAIL concentration for an additional 24 h and stained with APC-annexin V as illustrated in Fig. 1A. Data are presented as the percentage of EGFP+ cells that are also annexin V+. The bar graph (right) shows summarized results at 25 ng/ml TRAIL. Inset, 48 h after transfection cell lysates were prepared. Aliquots containing 50 μg of protein were subjected to SDS-PAGE, transferred to nitrocellulose, and probed with the indicated antibodies. G, Fas or DR5 mRNA levels were quantified by qRT-PCR and normalized to GAPDH mRNA in ML-1 cells with stable PARP1 or PARP2 knockdown. *, p < 0.05 after Bonferroni correction relative to control shRNA. H, ML-1 cells expressing nontargeting shRNA (Control shRNA) or PARP1 and PARP2 shRNA were pretreated with diluent or 0.5 μm olaparib for 24 h followed by the addition of diluent or CH.11 (50 ng/ml) for an additional 48 h. Annexin V-positive cells were assessed as illustrated in Fig. 1A. Error bars in all panels, ±S.D. of at least three independent transfections with siRNA (panel F) or three independent transductions with lentivirus (all other panels).
FIGURE 9.
FIGURE 9.
Sp1 plays a critical role in PARP inhibitor/TRAIL synergy. A, relative cell surface DR5 expression on ML-1 cells with stable Sp1 knockdown assayed using anti-DR5 antibody as a probe. Inset, immunoblot of Sp1 stable knockdown. HSP90 serves as a loading control. B (from top to bottom), after ML-1 cells stably expressing the indicated shRNA construct were treated with TRAIL for 24 h, subdiploid cells were assayed as illustrated in Fig. 2D. Bar graph at bottom, summarized results of three independent experiments with diluent or 12.5 ng/ml TRAIL. Error bars, ±S.D. of at least three independent experiments. C, after ML-1 cells were treated with diluent or 1 μm olaparib for 40 h, ChIP with control IgG or Sp1 antibody and subsequent semi-quantitative PCR for the 165-bp region of the DR5 promoter containing Sp1 binding site were performed as described under “Experimental Procedure.” D, after ML-1 cells were treated with diluent or 1 μm olaparib for 48 h, nuclei were fractionated using 200 mm NaCl into extractable proteins (Supernatant) and salt-resistant proteins (Pellet). 30 μg of whole cell lysates, 10 μg of supernatant, and 20 μg of nuclear pellet were subjected to SDS-PAGE, transferred to nitrocellulose, and probed with the indicated antibodies. Proliferating cell nuclear antigen (PCNA) served as a loading control. WCL, whole cell lysates. E, after ML-1 cells were treated with diluent or 1 μm olaparib for 48 h, immunoprecipitates (IP) prepared with anti-pADPr antibody (clone 10H) or murine IgG control were subjected to SDS-PAGE and immunoblotting with the indicated antibodies. Cells treated with 1 mm methyl methanesulfonate (MMS) for 10 min served as a positive control for pADPr formation.
FIGURE 10.
FIGURE 10.
PARP inhibitor sensitizes AML samples to TRAIL-induced reduction of colony formation. Three different AML samples (A–C) and normal marrow (D) were plated in Methocult® methylcellulose containing 120 ng/ml TRAIL, 0.5 mm olaparib, or 120 ng/ml TRAIL + 0.5 μm olaparib. Leukemic (A–C) and normal myeloid colonies (D) were counted (42) at 14 days and compared with samples containing diluent. Numbers above each bar graph correspond to sample numbers in Table 1. Note that the ability of olaparib to sensitize to TRAIL without having any effect by itself meets the definition of synergy (45). CFU-L, leukemic cell colony-forming unit.

Similar articles

Cited by

References

    1. Siegel R., Naishadham D., Jemal A. (2012) Cancer statistics, 2012. CA Cancer J. Clin. 62, 10–29 - PubMed
    1. Ozören N., El-Deiry W. S. (2003) Cell surface Death Receptor signaling in normal and cancer cells. Semin. Cancer Biol. 13, 135–147 - PubMed
    1. Yang A., Wilson N. S., Ashkenazi A. (2010) Proapoptotic DR4 and DR5 signaling in cancer cells: toward clinical translation. Curr. Opin. Cell Biol. 22, 837–844 - PubMed
    1. Wilson N. S., Yang A., Yang B., Couto S., Stern H., Gogineni A., Pitti R., Marsters S., Weimer R. M., Singh M., Ashkenazi A. (2012) Proapoptotic activation of death receptor 5 on tumor endothelial cells disrupts the vasculature and reduces tumor growth. Cancer Cell 22, 80–90 - PubMed
    1. Taylor R. C., Cullen S. P., Martin S. J. (2008) Apoptosis: controlled demolition at the cellular level. Nat. Rev. Mol. Cell biology 9, 231–241 - PubMed

Publication types

MeSH terms

Substances