. 2014 Sep;22(9):1665-77.
doi: 10.1038/mt.2014.98. Epub 2014 Jun 4.

miR-148a- and miR-216a-regulated oncolytic adenoviruses targeting pancreatic tumors attenuate tissue damage without perturbation of miRNA activity

Affiliations

miR-148a- and miR-216a-regulated oncolytic adenoviruses targeting pancreatic tumors attenuate tissue damage without perturbation of miRNA activity

Xavier Bofill-De Ros et al. Mol Ther. 2014 Sep.

Abstract

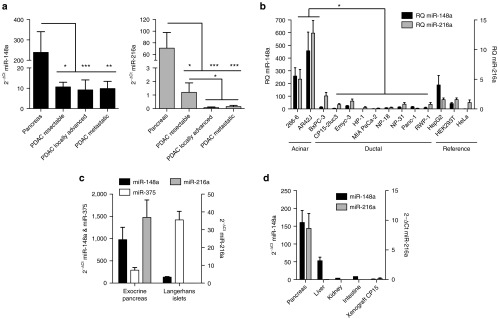
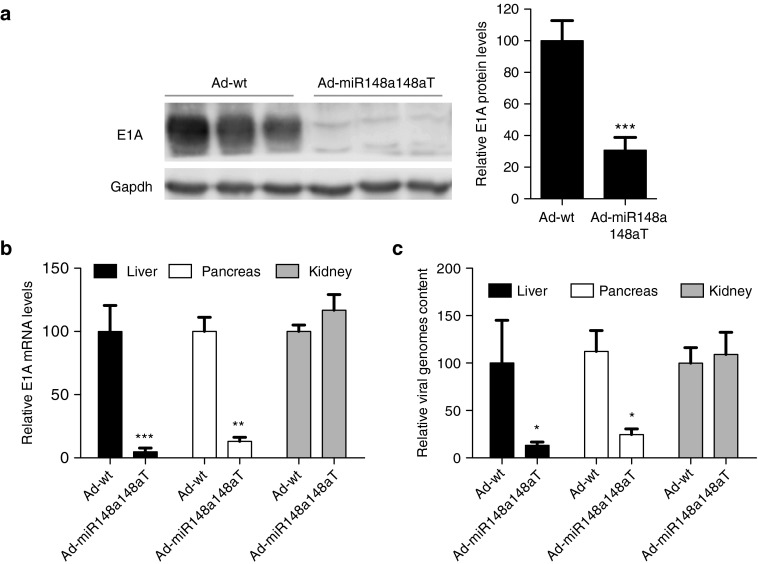
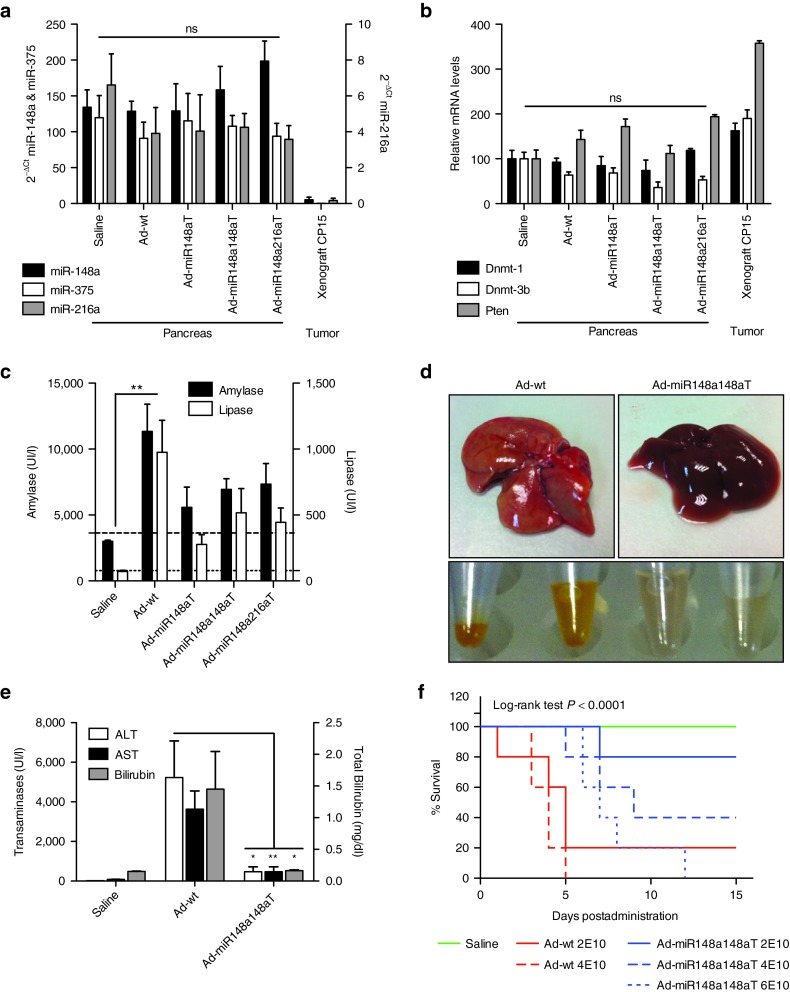
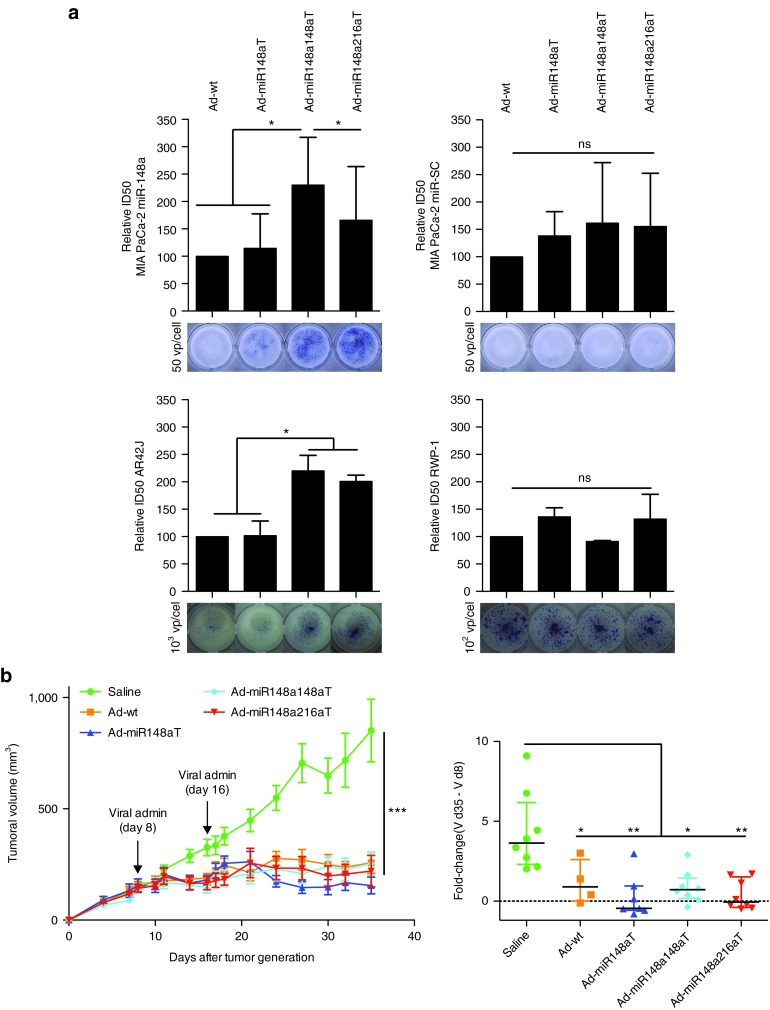
Oncolytic virotherapy shows promise for pancreatic ductal adenocarcinoma (PDAC) treatment, but there is the need to minimize associated-toxicities. In the current work, we engineered artificial target sites recognized by miR-216a and/or miR-148a to provide pancreatic tumor-selectivity to replication-competent adenoviruses (Ad-miRTs) and improve their safety profile. Expression analysis in PDAC patients identified miR-148a and miR-216a downregulated in resectable (FC(miR-148a) = 0.044, P < 0.05; FC(miR-216a) = 0.017, P < 0.05), locally advanced (FC(miR-148a) = 0.038, P < 0.001; FC(miR-216a) = 0.001, P < 0.001) and metastatic tumors (FC(miR-148a) = 0.041, P < 0.01; FC(miR-216a) = 0.002, P < 0.001). In mouse tissues, miR-216a was highly specific of the exocrine pancreas whereas miR-148a was abundant in the exocrine pancreas, Langerhans islets, and the liver. In line with the miRNA content and the miRNA target site design, we show E1A gene expression and viral propagation efficiently controlled in Ad-miRT-infected cells. Consequently, Ad-miRT-infected mice presented reduced pancreatic and liver damage without perturbation of the endogenous miRNAs and their targets. Interestingly, the 8-miR148aT design showed repressing activity by all miR-148/152 family members with significant detargeting effects in the pancreas and liver. Ad-miRTs preserved their oncolytic activity and triggered strong antitumoral responses. This study provides preclinical evidences of miR-148a and miR-216a target site insertions to confer adenoviral selectivity and proposes 8-miR148aT as an optimal detargeting strategy for genetically-engineered therapies against PDAC.


Figures

Figure 1
Figure 1
miR-216a and miR-148a are downregulated in Pancreatic Ductal Adenocarcinoma (PDAC). (a). RT-qPCR expression of miR-148a (left panel) and miR-216a (right panel) in a cohort of patients with resectable (n = 9), locally advanced (n = 8) or metastatic tumors (n = 9) at diagnosis. Control pancreas was obtained from non-tumor areas of the same individuals or from healthy individuals (n = 11). * and *** denote P < 0.05 and P < 0.001, respectively. (b) RT-qPCR expression of miR-216a and miR-148a in a set of pancreatic and reference cell lines. Values represent mean ± SEM of four independent samples. * denote P < 0.05. (c) RT-qPCR expression of miR-375, miR-216a, and miR-148a in mice isolated exocrine pancreas and Langerhans islets. Values represent mean ± SEM of four independent samples. (d) RT-qPCR expression of miR-148a, miR-216a in mouse tissues (pancreas, liver, kidney, intestine) and in a xenograft model of PDAC. Samples were obtained from three individuals and values represent mean ± SEM.
Figure 2
Figure 2
E1A expression and viral production are regulated by miR-148a and/or miR-216a content in cells infected with the engineered Ad-miRT. (a) Scheme of sequence alignment of miR-148a and miR-216a to the corresponding miR target sites engineered in the luciferase vectors. (b) Luciferase activity in HeLa cells cotransfected with the reporter plasmids and miR-216a and miR-148a expression vectors. Values represent mean ± SEM of four independent experiments. * denote P < 0.05. (c) Schematic representation of engineered adenoviruses, Ad-miR148aT, Ad-miR148a148aT, Ad-miR148a216aT. (d) Representative Western blots of E1A from cells infected with the different viruses at 10 vp/cell (MIA PaCa-2 miR-148a, MIA PaCa-2 miR-SC, and RWP-1), 100 vp/cell (266-6) and 1,000 vp/cell (AR42J). (e) Quantification of viral production in cells infected with the different viruses at the above indicated doses. Data is shown as the mean ± SEM of four independent experiments. * and ns denote P < 0.05 and no significant difference, respectively.
Figure 3
Figure 3
Ad-miR148aT, Ad-miR148a148aT, Ad-miR148a216aT activities are controlled by pancreatic miR-148a and miR-216a after intraductal delivery. (a) Representative western blots of E1A in pancreatic tissue extracts from wild type mice intraductally injected with 2.1010 vp/mice of the different viruses. Quantification of E1A signal normalized to Gapdh expression (n = 6). Values are expressed relative to E1A content from Ad-wt treated mice. (b) Representative images of E1A immunostaining in infected pancreas. Quantification of E1A-positive cells per area in exocrine pancreas (n = 30 sections/treatment) and Langerhans islets (n = 30 islets/treatment). ** denote P < 0.01. (c) Relative expression of E1A compared to Ad-wt assessed by RT-qPCR in total pancreatic tissue extracts of injected mice (n = 6). * and ** denote P < 0.05 and P < 0.01, respectively. (d) Viral replication in pancreas assessed by genomic qPCR of the L3 gene (n = 6). ** denote P < 0.01.
Figure 4
Figure 4
Ad-miR148a148aT activity is controlled by miR-148a in liver and pancreas after systemic delivery. (a) Representative western blots of E1A in liver extracts from wild type mice intravenously injected with Ad-wt (n = 10) and Ad-miR148a148aT at 2.1010 vp/mice (n = 10). *** denote P < 0.001. (b) Relative expression of E1A compared to Ad-wt assessed by RT-qPCR in liver, pancreas and kidneys (n = 10/treatment). * and ** denote P < 0.05 and P < 0.01, respectively. (c). Relative viral replication compared to Ad-wt assessed by genomic qPCR of the L3 gene in liver, pancreas and kidneys (n = 10/treatment). * denote P < 0.05.
Figure 5
Figure 5
Target site recognition by miR-148 family members. (a) Scheme of sequence alignment of miR-148 family members (miR-148a, miR-148b, and miR-152) to miR-148a artificial target sites and its associated minimum free energy. Energies were calculated using RNAhybrid. (b) Minimum free energy and complementarity displayed in the miRNA:target sites hybridizations: miRT family members (recognition of artificial miR-148a target sites by miR-148a, miR-148b, and miR-152), validated seeds (recognition of 27 miR-148a experimentally validated target sites by miR-148a, miR-148b, and miR-152 or an unrelated miRNA), rand seq (recognition of 100 completely random sequences of 22 nucleotides by miR-148a), rand seq + fixed seed (recognition of 100 random sequences of 22 nucleotides with fixed miR-148 family seed region by miR-148a). (c) Luciferase activity in HeLa and MIA PaCa-2 cells cotransfected with the reporter plasmids pLuc-miR-148a148aT and miRNA expression vectors (p-miR-SC, p-miR-148a, miRVEC-148a, miRVEC-148b, and miRVEC-152). Dashed lines correspond to the values obtained with p-miR-SC. Values represent mean ± SEM of four independent experiments. *, **, and *** denote P < 0.05, P < 0.01, and P < 0.001, respectively.
Figure 6
Figure 6
Improved safety profile of Ad-miR148aT, Ad-miR148a148aT, Ad-miR148a216aT. (a) miR-148a, miR-216a, and miR-375a expression in the pancreas of mice intraductally injected with the different viruses (n = 6/treatment). A saline group (n = 6) and a xenograft tumor (n = 6) were included as positive and negative controls respectively. ns denote no significant difference. (b) Expression of the validated targets for miR-148a (Dnmt-1, Dnmt-3b, Pten) and miR-216a (Pten) analyzed by RT-qPCR in the pancreas of mice intraductally injected with the different viruses as indicated above. (c) Assessment of pancreas toxicity. Determination of amylase and lipase in the serum of mice treated with Ad-wt, Ad-miR148aT, Ad-miR148a148aT, Ad-miR148a216aT for 3 days following intraductal administration of 2.1010vp/mice (n = 6). Data expressed as enzyme activity in international units (IU) per liter. Dashed lines correspond to the reference values for C57BL/6 mice. ** denote P < 0.01. (d) Representative macroscopic appearance of livers and blood serums (upper and lower panels) treated with Ad-wt and Ad-miR148a148aT. (e) Assesment of hepatotoxicity. Determination of AST, ALT, and total bilirubin in the serum of mice treated with Ad-wt and Ad-miR148a148aT for 3 days following intravenous administration of 2.1010vp/mice (n = 10). Data expressed as enzyme activity in international units (IU) per liter. * and ** denote P < 0.05 and P < 0.01, respectively. (f) Kaplan-Meier survival curves of mice treated with saline, Ad-wt and Ad-miR148a148aT at different doses (2.1010, 4.1010, and 6.1010 vp/mice) (n = 5/treatment). *** denote P < 0.001
Figure 7
Figure 7
Ad-miR148aT, Ad-miR148a148aT, and Ad-miR148a216aT show oncolytic potency in vitro and strong antitumoral activity in MIA PaCa-2 xenografts. (a) Cytotoxicity assays in the indicated cell lines. Half growth inhibitory concentration (IC50) was calculated for each cell line from dose–response curves. Mixed models were used for statistical analysis of dose-response curves. Data is shown as the mean ± SEM of four independent experiments. * and ns denote P < 0.05 and no significant difference, respectively. Representative cytotoxic effects at fixed viral doses were obtained by methylene blue staining (under each panel). (b) Follow-up of tumor volumes treated with Ad-miR148aT (n = 8), Ad-miR148a148aT (n = 8), Ad-miR148a216aT (n = 8), and Ad-wt (n = 4) at days 8 and 16 postcell inoculation. *** denote P < 0.001. Fold-change in tumor volume at day 35 in relation to the tumor volume at the time of the first viral administration. Fold-changes below 0, indicate tumor regression. * and ** denote P < 0.05 and P < 0.01, respectively.

References

    1. Khan S, Ansarullah, Kumar D, Jaggi M, Chauhan SC. Targeting microRNAs in pancreatic cancer: microplayers in the big game. Cancer Res. 2013;73:6541–6547. - PMC - PubMed
    1. Sayed D, Abdellatif M. MicroRNAs in development and disease. Physiol Rev. 2011;91:827–887. - PubMed
    1. Bloomston M, Frankel WL, Petrocca F, Volinia S, Alder H, Hagan JP, et al. MicroRNA expression patterns to differentiate pancreatic adenocarcinoma from normal pancreas and chronic pancreatitis. JAMA. 2007;297:1901–1908. - PubMed
    1. Cutts RJ, Gadaleta E, Hahn SA, Crnogorac-Jurcevic T, Lemoine NR, Chelala C. The pancreatic expression database: 2011 update. Nucleic Acids Res. 2011;39 Database issue:D1023–D1028. - PMC - PubMed
    1. Lee EJ, Gusev Y, Jiang J, Nuovo GJ, Lerner MR, Frankel WL, et al. Expression profiling identifies microRNA signature in pancreatic cancer. Int J Cancer. 2007;120:1046–1054. - PMC - PubMed

Publication types

MeSH terms