

Ultimate use of two-photon fluorescence microscopy to map orientational behavior of fluorophores
- PMID: 24896112
- PMCID: PMC4052276
- DOI: 10.1016/j.bpj.2014.04.011
Ultimate use of two-photon fluorescence microscopy to map orientational behavior of fluorophores
Abstract
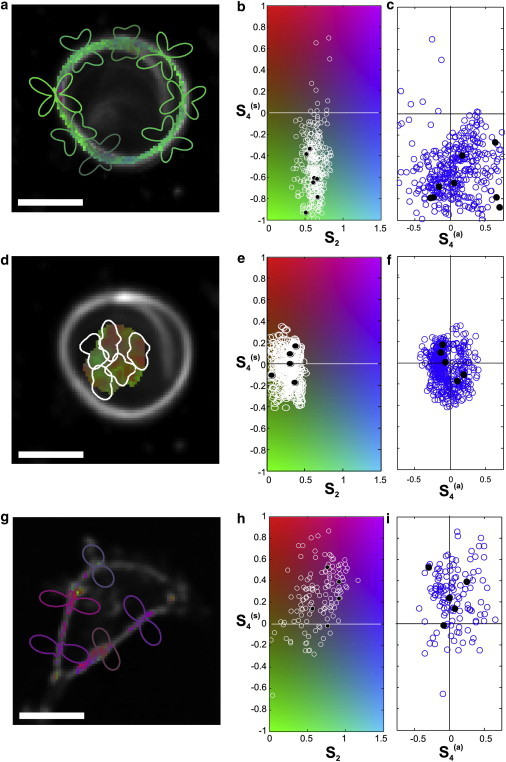
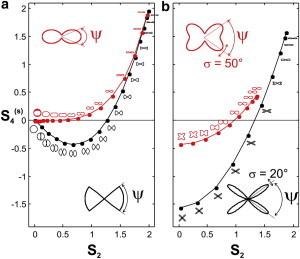
The orientational distribution of fluorophores is an important reporter of the structure and function of their molecular environment. Although this distribution affects the fluorescence signal under polarized-light excitation, its retrieval is limited to a small number of parameters. Because of this limitation, the need for a geometrical model (cone, Gaussian, etc.) to effect such retrieval is often invoked. In this work, using a symmetry decomposition of the distribution function of the fluorescent molecules, we show that polarized two-photon fluorescence based on tunable linear dichroism allows for the retrieval of this distribution with reasonable fidelity and without invoking either an a priori knowledge of the system to be investigated or a geometrical model. We establish the optimal level of detail to which any distribution can be retrieved using this technique. As applied to artificial lipid vesicles and cell membranes, the ability of this method to identify and quantify specific structural properties that complement the more traditional molecular-order information is demonstrated. In particular, we analyze situations that give access to the sharpness of the angular constraint, and to the evidence of an isotropic population of fluorophores within the focal volume encompassing the membrane. Moreover, this technique has the potential to address complex situations such as the distribution of a tethered membrane protein label in an ordered environment.
Copyright © 2014 Biophysical Society. Published by Elsevier Inc. All rights reserved.
Figures
Similar articles
-
Quantitative imaging of molecular order in lipid membranes using two-photon fluorescence polarimetry.Biophys J. 2009 Nov 18;97(10):2854-62. doi: 10.1016/j.bpj.2009.08.052. Biophys J. 2009. PMID: 19917241 Free PMC article.
-
Probing the orientational distribution of dyes in membranes through multiphoton microscopy.Biophys J. 2012 Sep 5;103(5):907-17. doi: 10.1016/j.bpj.2012.08.003. Biophys J. 2012. PMID: 23009840 Free PMC article.
-
A two-photon fluorescence probe for cell membrane imaging under temporal-focusing multiphoton excitation microscopy (TFMPEM).Chem Commun (Camb). 2021 Dec 7;57(97):13118-13121. doi: 10.1039/d1cc04962c. Chem Commun (Camb). 2021. PMID: 34807218
-
Label-Free Multiphoton Microscopy: The Origin of Fluorophores and Capabilities for Analyzing Biochemical Processes.Biochemistry (Mosc). 2019 Jan;84(Suppl 1):S69-S88. doi: 10.1134/S0006297919140050. Biochemistry (Mosc). 2019. PMID: 31213196 Review.
-
Deep insights: intravital imaging with two-photon microscopy.Pflugers Arch. 2016 Sep;468(9):1505-16. doi: 10.1007/s00424-016-1832-7. Epub 2016 Jun 28. Pflugers Arch. 2016. PMID: 27352273 Review.
Cited by
-
Porphyrin Dyes for Nonlinear Optical Imaging of Live Cells.iScience. 2018 Jun 29;4:153-163. doi: 10.1016/j.isci.2018.05.015. Epub 2018 May 26. iScience. 2018. PMID: 30240737 Free PMC article.
-
High-dimensional super-resolution imaging reveals heterogeneity and dynamics of subcellular lipid membranes.Nat Commun. 2020 Nov 18;11(1):5890. doi: 10.1038/s41467-020-19747-0. Nat Commun. 2020. PMID: 33208737 Free PMC article.
-
Spatio-angular fluorescence microscopy III. Constrained angular diffusion, polarized excitation, and high-NA imaging.J Opt Soc Am A Opt Image Sci Vis. 2020 Sep 1;37(9):1465-1479. doi: 10.1364/JOSAA.389217. J Opt Soc Am A Opt Image Sci Vis. 2020. PMID: 32902437 Free PMC article.
-
Lipid Order Degradation in Autoimmune Demyelination Probed by Polarized Coherent Raman Microscopy.Biophys J. 2017 Oct 3;113(7):1520-1530. doi: 10.1016/j.bpj.2017.07.033. Biophys J. 2017. PMID: 28978445 Free PMC article.
-
Dynamic Mode Decomposition of Multiphoton and Stimulated Emission Depletion Microscopy Data for Analysis of Fluorescent Probes in Cellular Membranes.Sensors (Basel). 2024 Mar 25;24(7):2096. doi: 10.3390/s24072096. Sensors (Basel). 2024. PMID: 38610307 Free PMC article.
References
-
- Steinbach G., Pomozi I., Garab G. Confocal fluorescence detected linear dichroism imaging of isolated human amyloid fibrils. Role of supercoiling. J. Fluoresc. 2011;21:983–989. - PubMed
-
- Lazar J., Bondar A., Firestein S.J. Two-photon polarization microscopy reveals protein structure and function. Nat. Methods. 2011;8:684–690. - PubMed
Publication types
MeSH terms
Substances
LinkOut - more resources
Full Text Sources
Other Literature Sources
Research Materials
