

Lipopolysaccharide-induced dynamic lipid membrane reorganization: tubules, perforations, and stacks
- PMID: 24896118
- PMCID: PMC4052278
- DOI: 10.1016/j.bpj.2014.04.016
Lipopolysaccharide-induced dynamic lipid membrane reorganization: tubules, perforations, and stacks
Abstract
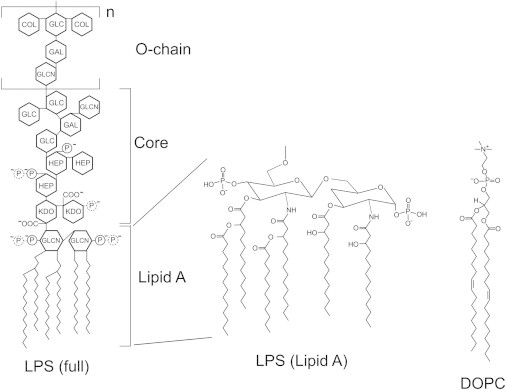
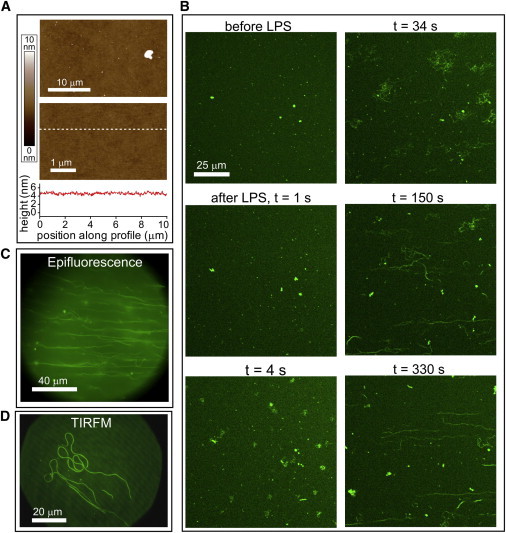
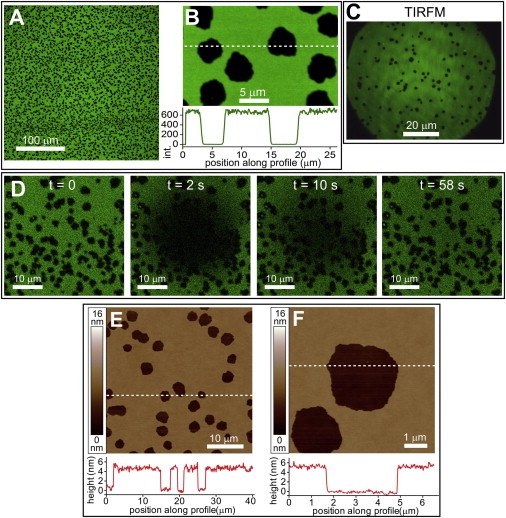
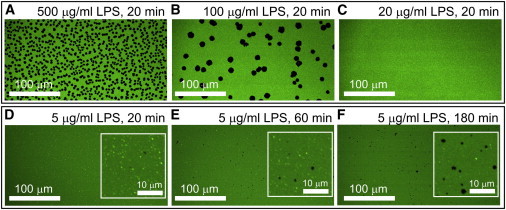
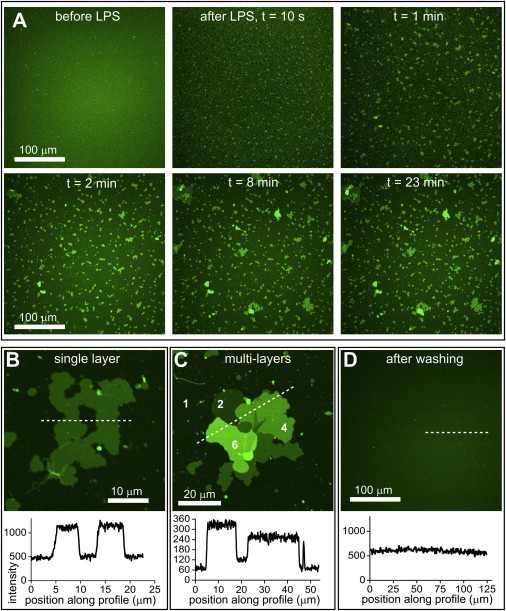
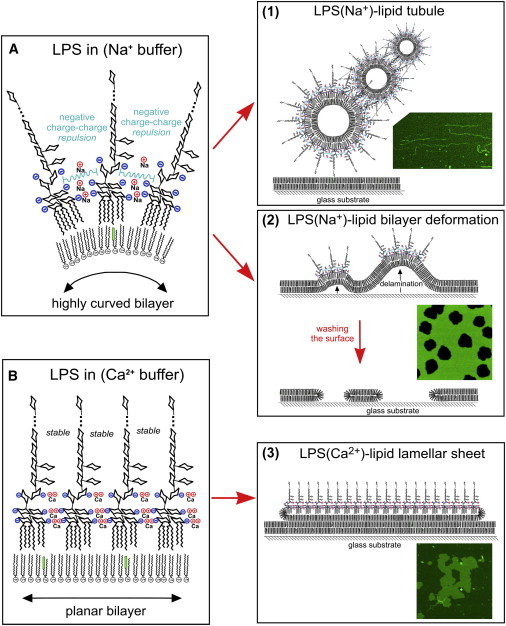
Lipopolysaccharide (LPS) is a unique lipoglycan, with two major physiological roles: 1), as a major structural component of the outer membrane of Gram-negative bacteria and 2), as a highly potent mammalian toxin when released from cells into solution (endotoxin). LPS is an amphiphile that spontaneously inserts into the outer leaflet of lipid bilayers to bury its hydrophobic lipidic domain, leaving the hydrophilic polysaccharide chain exposed to the exterior polar solvent. Divalent cations have long been known to neutralize and stabilize LPS in the outer membrane, whereas LPS in the presence of monovalent cations forms highly mobile negatively-charged aggregates. Yet, much of our understanding of LPS and its interactions with the cell membrane does not take into account its amphiphilic biochemistry and charge polarization. Herein, we report fluorescence microscopy and atomic force microscopy analysis of the interaction between LPS and fluid-phase supported lipid bilayer assemblies (sLBAs), as model membranes. Depending on cation availability, LPS induces three remarkably different effects on simple sLBAs. Net-negative LPS-Na(+) leads to the formation of 100-μm-long flexible lipid tubules from surface-associated lipid vesicles and the destabilization of the sLBA resulting in micron-size hole formation. Neutral LPS-Ca(2+) gives rise to 100-μm-wide single- or multilamellar planar sheets of lipid and LPS formed from surface-associated lipid vesicles. Our findings have important implications about the physical interactions between LPS and lipids and demonstrate that sLBAs can be useful platforms to study the interactions of amphiphilic virulence factors with cell membranes. Additionally, our study supports the general phenomenon that lipids with highly charged or bulky headgroups can promote highly curved membrane architectures due to electrostatic and/or steric repulsions.
Copyright © 2014 Biophysical Society. Published by Elsevier Inc. All rights reserved.
Figures
Similar articles
-
Lipopolysaccharides in bacterial membranes act like cholesterol in eukaryotic plasma membranes in providing protection against melittin-induced bilayer lysis.Biochemistry. 2003 Feb 4;42(4):1101-8. doi: 10.1021/bi026932s. Biochemistry. 2003. PMID: 12549932
-
Membrane Insertion for the Detection of Lipopolysaccharides: Exploring the Dynamics of Amphiphile-in-Lipid Assays.PLoS One. 2016 May 26;11(5):e0156295. doi: 10.1371/journal.pone.0156295. eCollection 2016. PLoS One. 2016. PMID: 27227979 Free PMC article.
-
Interactions between Mutant Bacterial Lipopolysaccharide (LPS-Ra) Surface Layers: Surface Vesicles, Membrane Fusion, and Effect of Ca2+and Temperature.Langmuir. 2019 Dec 3;35(48):15739-15750. doi: 10.1021/acs.langmuir.9b02609. Epub 2019 Oct 24. Langmuir. 2019. PMID: 31604373
-
Lipopolysaccharides at Solid and Liquid Interfaces: Models for Biophysical Studies of the Gram-negative Bacterial Outer Membrane.Adv Colloid Interface Sci. 2022 Mar;301:102603. doi: 10.1016/j.cis.2022.102603. Epub 2022 Jan 23. Adv Colloid Interface Sci. 2022. PMID: 35093846 Review.
-
Lipid Self-Assemblies under the Atomic Force Microscope.Int J Mol Sci. 2021 Sep 18;22(18):10085. doi: 10.3390/ijms221810085. Int J Mol Sci. 2021. PMID: 34576248 Free PMC article. Review.
Cited by
-
Changes in Cellular Elasticities and Conformational Properties of Bacterial Surface Biopolymers of Multidrug-Resistant Escherichia coli (MDR-E. coli) Strains in Response to Ampicillin.Cell Surf. 2019 Dec;5:100019. doi: 10.1016/j.tcsw.2019.100019. Epub 2019 Mar 4. Cell Surf. 2019. PMID: 31179402 Free PMC article.
-
Factors Promoting Lipopolysaccharide Uptake by Synthetic Lipid Droplets.bioRxiv [Preprint]. 2024 Oct 19:2024.10.19.619182. doi: 10.1101/2024.10.19.619182. bioRxiv. 2024. Update in: ACS Omega. 2025 Feb 10;10(6):5866-5873. doi: 10.1021/acsomega.4c09599. PMID: 39464097 Free PMC article. Updated. Preprint.
-
Integrative structural analysis of Pseudomonas phage DEV reveals a genome ejection motor.Res Sq [Preprint]. 2024 Feb 21:rs.3.rs-3941185. doi: 10.21203/rs.3.rs-3941185/v1. Res Sq. 2024. Update in: Nat Commun. 2024 Oct 1;15(1):8482. doi: 10.1038/s41467-024-52752-1. PMID: 38463957 Free PMC article. Updated. Preprint.
-
Propranolol induces large-scale remodeling of lipid bilayers: tubules, patches, and holes.RSC Adv. 2023 Mar 8;13(11):7719-7730. doi: 10.1039/d3ra00319a. eCollection 2023 Mar 1. RSC Adv. 2023. PMID: 36908547 Free PMC article.
-
Leveraging microfluidic dielectrophoresis to distinguish compositional variations of lipopolysaccharide in E. coli.Front Bioeng Biotechnol. 2023 Feb 16;11:991784. doi: 10.3389/fbioe.2023.991784. eCollection 2023. Front Bioeng Biotechnol. 2023. PMID: 36873367 Free PMC article.
References
Publication types
MeSH terms
Substances
LinkOut - more resources
Full Text Sources
Other Literature Sources
