. 2014 Jul 17;511(7509):348-52.
doi: 10.1038/nature13294. Epub 2014 Jun 1.

Engineering a memory with LTD and LTP

Affiliations

Engineering a memory with LTD and LTP

Sadegh Nabavi et al. Nature. .

Abstract

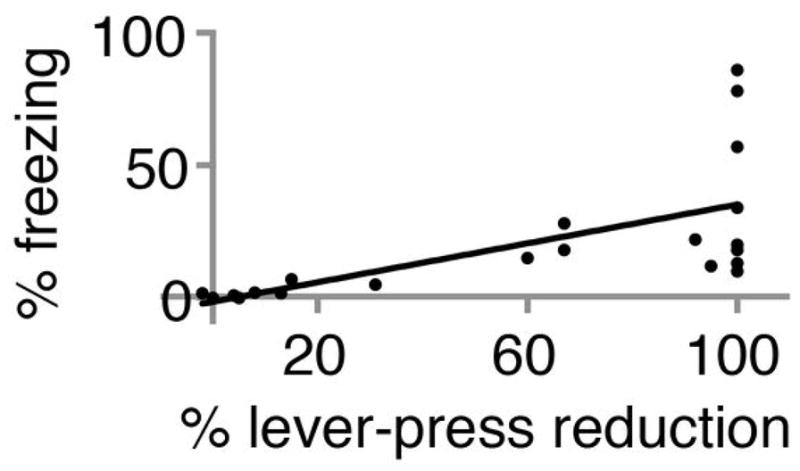
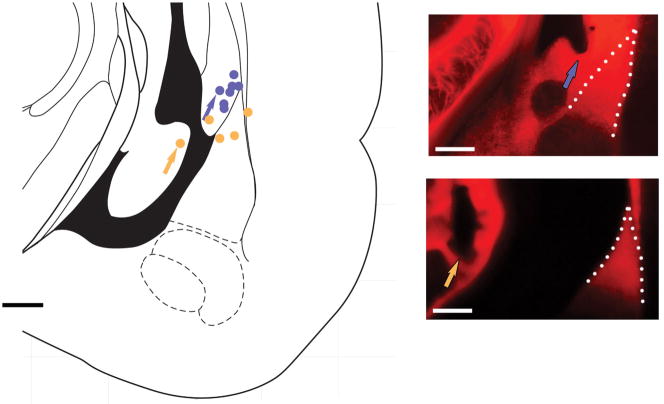
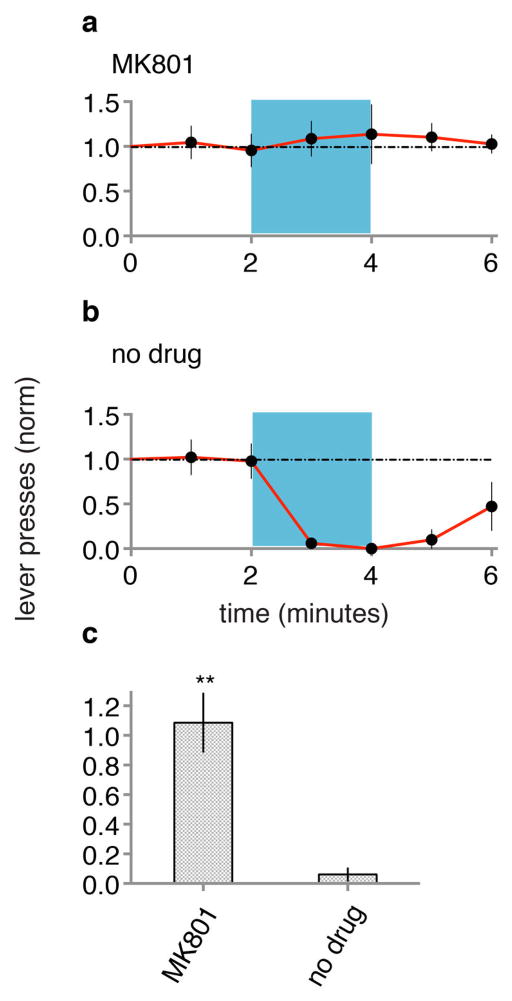
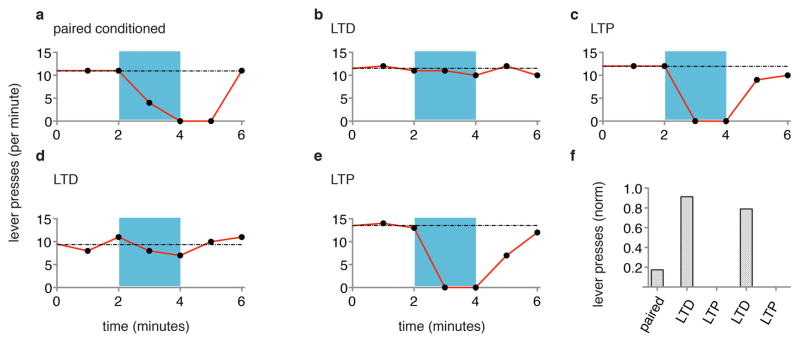
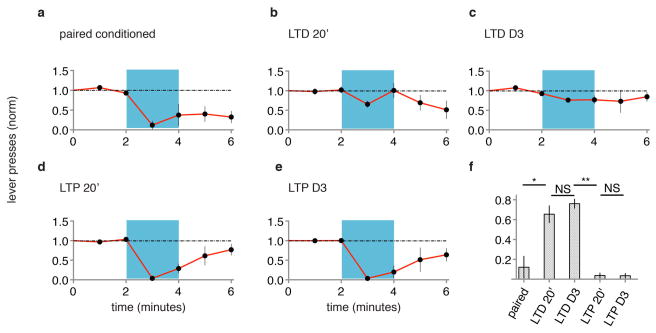
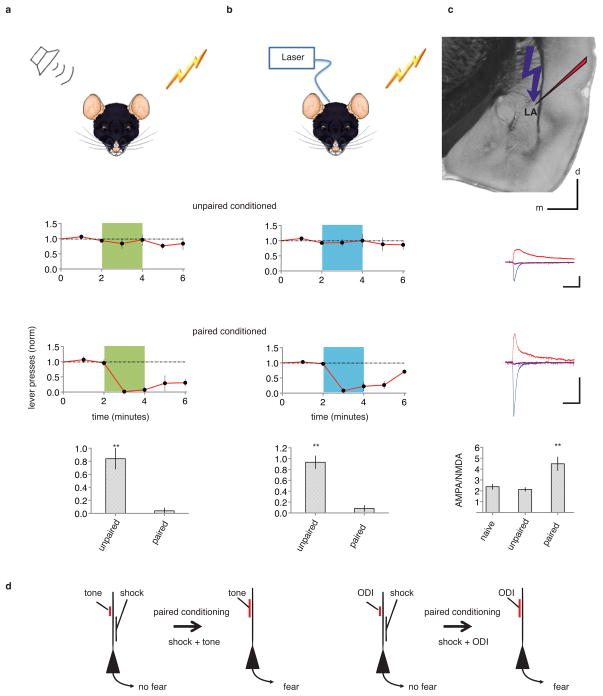
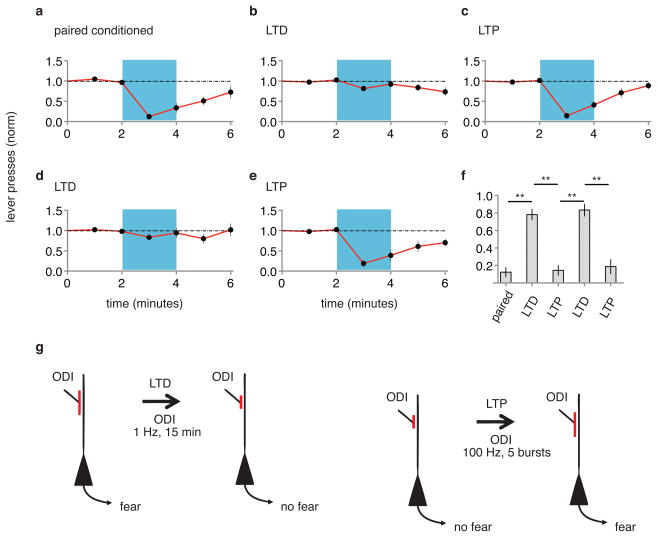
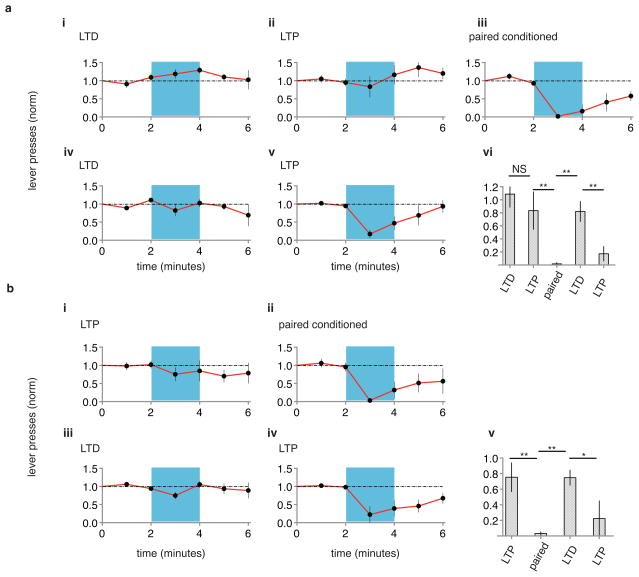
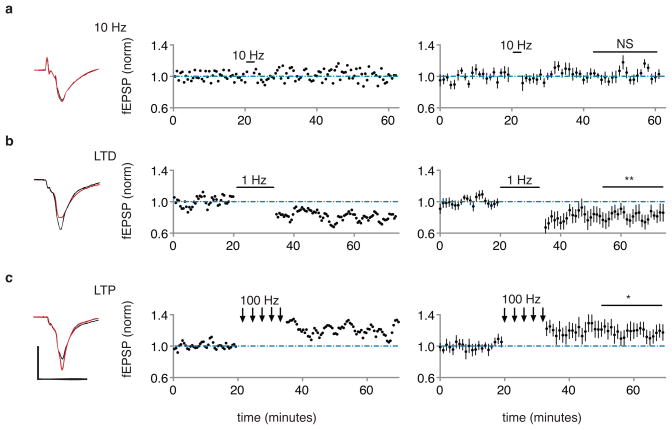
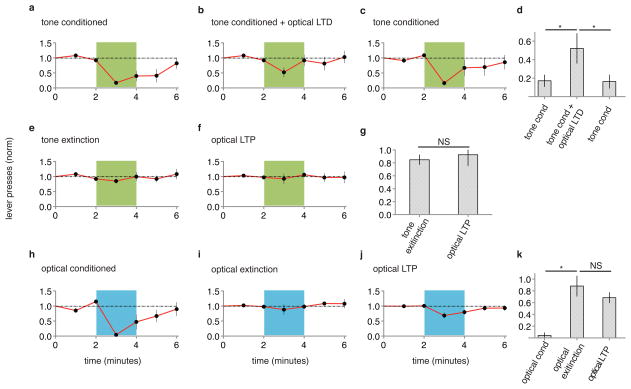
It has been proposed that memories are encoded by modification of synaptic strengths through cellular mechanisms such as long-term potentiation (LTP) and long-term depression (LTD). However, the causal link between these synaptic processes and memory has been difficult to demonstrate. Here we show that fear conditioning, a type of associative memory, can be inactivated and reactivated by LTD and LTP, respectively. We began by conditioning an animal to associate a foot shock with optogenetic stimulation of auditory inputs targeting the amygdala, a brain region known to be essential for fear conditioning. Subsequent optogenetic delivery of LTD conditioning to the auditory input inactivates memory of the shock. Then subsequent optogenetic delivery of LTP conditioning to the auditory input reactivates memory of the shock. Thus, we have engineered inactivation and reactivation of a memory using LTD and LTP, supporting a causal link between these synaptic processes and memory.


Figures

Extended Data Figure 1
Extended Data Figure 1. Freezing correlates well with reduction in lever presses to previously learned task
Plot of percent freezing versus percent reduction in lever presses to previously learned task. Best fit line indicates significant positive correlation (R2 = 0.4; p < 0.01; F-test). Data includes results from 3 manipulations (paired optical CS-shock conditioning, optical LTD and optical LTP). The percent change in lever presses to previously learned task (60% ± 9%) was significantly greater than change in percent freezing (20% ± 5%; N = 21; p < 0.001, paired Students t-test)
Extended Data Figure 2
Extended Data Figure 2. In vivo, optically evoked synaptic responses in lateral amygdala
Field responses to 10 Hz (top) and 100 Hz optical stimulation (middle, bottom), obtained from animal infected with AAV-oChIEF in auditory regions four weeks prior to recording. Note that responses follow stimulation faithfully.
Extended Data Figure 3
Extended Data Figure 3. Expression of oChIEF in auditory regions reaches lateral amygdala
Diagram (left) and epifluorescent image (right) of coronal section of rat brain indicating areas expressing AAV-oChIEF-tdTomato 3–4 weeks after in vivo injection in auditory cortex (a) and medial geniculate nucleus (b). c, axonal expression of AAV-oChIEF-tdTomato in lateral amygdala (dashed white line); approximate placement of cannula and light (blue) indicated. Scale bars, 500 μm.
Extended Data Figure 4
Extended Data Figure 4. Optic fiber locations in representative group of rats used in the behavioral assays
Histologically assessed optic fiber tip location for rats which responded (blue circles; upper panel, right, is one example) or did not respond (orange circles; lower panel, right, is one example) to optical conditioning. The arrow on the panels shows the location of the tip of optic fiber. Lateral amygdala is indicated by dashed line. Note that the ventricle opened during tissue sectioning in the lower image. Scale bars, 500 μm.
Extended Data Figure 5
Extended Data Figure 5. 10 Hz test protocol does not produce CR
Test for CR (blue) in naïve animals (N=8), as measured by changes in lever presses normalized to baseline period. Subsequent delivery of paired optical CS and shock produced CR in these animals (not shown). Each point represents data collected over 1 minute.
Extended Data Figure 6
Extended Data Figure 6. Systemic NMDA receptor blockade during conditioning blocks ODI-induced conditioned response
Animals (N = 5) were injected with MK801 (see methods) and given optical CS paired with foot shock and subsequently tested one day later for CR (a). The same group of animals was then given optical CS paired with foot shock (in the absence of MK801) and subsequently tested one day later for CR (b). c, MK801 signifcantly blocked conditioning.
Extended Data Figure 7
Extended Data Figure 7. LTD and LTP remove and reactivate memory
Data from individual rat, measuring lever presses per minute before, during (blue) and after optical CS, one day after paired conditioning of optical CS and shock (a), one day after subsequent optical LTD protocol (b), one day after subsequent optical LTP protocol (c), one day after subsequent second optical LTD protocol (d) and one day after subsequent second optical LTP protocol (e). f, Graph of lever presses during first minute into optical CS one day after delivery of indicated conditioning protocols.
Extended Data Figure 8
Extended Data Figure 8. The effects of LTD and LTP are rapid and long-lasting
Animals (n=5) were tested for CR one day following pairing of optical CS with shock (a). Within one hour of testing animals received optical LTD protocol and were tested for CR 20 minutes (b) and three days (c) later. Following day three testing animals received optical LTP protocol and were tested for CR 20 minutes (d) and three days (e) later. f, Graph of normalized lever presses for first minute of optical CS following indicated protocols.
Extended Data Figure 9
Extended Data Figure 9. Optically evoked in vivo and in vitro stimuli produce similar electrophysiological responses
Animals were injected in vivo with AAV-oChIEF-tdTomato in auditory regions 4 weeks prior to recordings. Left, in vivo electrophysiological response obtained from glass electrode placed in lateral amygdala and evoked by light pulse delivered through fiber optic cable placed 500 μm above tip of glass electrode. Right, in vitro brain slice electrophysiological response obtained from glass electrode placed in lateral amygdala and evoked by light pulse delivered through fiber optic cable placed above the brain slice. Black trace is before and red trace after bath application of 10 μM NBQX. Scale bars, 1 mV, 10 ms.
Extended Data Figure 10
Extended Data Figure 10. LTD reverses LTP and LTP reverses LTD of in vivo optical responses in amygdala
a, plot of baseline normalized fEPSP in vivo optically evoked responses (N = 5) following optical LTP (100 Hz) and optical LTD (1 Hz). b, same as a for a separate group of recordings (N = 5) following optical LTD (1 Hz) and optical LTP (100 Hz). All comparisons to baseline period.
Figure 1
Figure 1. Fear conditioning with tone or optogenetics
a, Top, diagram of rat receiving tone and shock during conditioning. Rats exposed to unpaired (N=5, middle) or temporally paired (N=5, bottom) tone and shock were tested one day later by a tone (green). Time plots: normalized number of lever presses (1 minute bins) to a previously learned cued lever-press task. Bar graph: normalized number of lever presses during the first minute of tone. b, Top, diagram of rat receiving optogenetically driven input (ODI) stimulation and shock during conditioning. Rats (N=8) received unpaired (middle) and one day later temporally paired (bottom) ODI and shock. Time graphs as in a, except animals were tested by 10 Hz ODI (blue). Bar graph as in a for 10 Hz ODI. c, top, experimental design; averaged optically-driven synaptic responses obtained at −60 mV (blue), +40 mV (red) and 0 mV holding potential for cells from animals that received unpaired (top) or paired (bottom) conditioning. Traces were scaled to match NMDA-mediated currents. Bar graph plots average AMPA/NMDA (no conditioning, 2.4±0.2, N=11; unpaired conditioning 2.1±0.2, N=10; paired conditioning 4.4±0.6, N=8). Scale bars, 100 pA, 50 ms, 1 mm. d, Synaptic modification model. Temporally pairing of tone (left) or ODI (right) and shock inputs to lateral amygdala neurons leads to potentiation of tone (left) or ODI (right) input, which can contribute in triggering CR. Here and throughout: NS, non significance; *, p<0.05; **, P<0.01; error bars, SEM. See methods for details.
Figure 2
Figure 2. LTD inactivates and LTP reactivates memory
A single group of rats (N = 12) was tested for CR two days following paired conditioning of ODI and shock (a). Graphs as in Fig. 1. After testing, animals were delivered an optical LTD protocol and tested for CR one day later (b). After testing, animals were delivered an optical LTP protocol and tested for CR one day later (c). After testing, animals were delivered another optical LTD protocol and tested for CR one day later (d). After testing, animals were delivered another optical LTP and tested for CR one day later (e). f, Normalized lever presses one minute into optical CS after different protocols (as indicated). g, Cellular models of synaptic modifications occurring in the lateral amygdala that may contribute to behavioral responses following LTD (left) or LTP (right) protocols delivered to ODI.
Figure 3
Figure 3. LTP produces conditioned response only after prior paired conditioning
A naïve group of animals (a, N=4) was tested for CR one day after LTD protocol (i), one day after subsequent LTP protocol (ii), one day after subsequent paired optical CS-shock conditioning (iii), one day after subsequent LTD protocol (iv) and one day after subsequent LTP protocol (v). vi, Graph of normalized lever presses one minute into optical CS one day following indicated protocols. A separate naïve group of animals (b, N = 5) was tested for CR one day after LTP protocol (i), one day after paired optical CS-shock conditioning (ii), one day after subsequent LTD protocol (iii) and one day after subsequent LTP protocol (iv). v, Graph of normalized lever presses one minute into optical CS one day following indicated protocols. Note that CR is seen following LTP protocol only after prior paired conditioning.
Figure 4
Figure 4. In vivo electrophysiological responses to 10Hz, LTD and LTP protocols
a, b, c, Left, in vivo field response (average of 20 responses) in lateral amygdala to single optical stimulus before (black) and after (red) indicated conditioning protocol. Plot of individual experiment (middle) or average of 10 experiments (right) of field EPSP slope (normalized to baseline period) before and after indicated stimulation. Average baseline normalized value 30–40 minutes following conditioning: 10 Hz, 102.2 ± 5%; 1 Hz, 82 ± 8%; 100 Hz, 118 ± 9%. Scale bars, 1 mV, 10 ms.
Figure 5
Figure 5. Optical LTD protocol significantly reduces auditory fear conditioning; optical LTP does not reverse auditory extinction
Separate groups of animals were exposed to (a) paired tone and shock conditioning (N = 5), or (b) paired tone and shock conditioning followed by optical LTD protocol, and subsequently tested for CR with tone (green). c, Animals shown in (b) were subsequently exposed to paired tone and shock conditioning and tested for CR. d, optical LTD significantly reduces auditory fear conditioning. e, Animals shown in (c) were exposed to auditory extinction protocol and tested for CR; f, animals received optical LTP and tested for CR. g, optical LTP did not reverse auditory extinction. A naïve group of animals (N=5) received paired optical conditioning and tested for CR (h); then received optical extinction protocol (see methods) and tested for CR (i); then received optical LTP protocol and tested for CR (j). k, optical LTP did not reverse optical extinction.

Similar articles

Cited by

References

    1. Squire LR, Kandel ER. Memory : from mind to molecules. 2. Roberts & Co; 2009.
    1. Stevens CF. A million dollar question: does LTP = memory? Neuron. 1998;20:1–2. - PubMed
    1. LeDoux JE. Emotion circuits in the brain. Annu Rev Neurosci. 2000;23:155–184. doi: 10.1146/annurev.neuro.23.1.155. - DOI - PubMed
    1. Fanselow MS, Poulos AM. The neuroscience of mammalian associative learning. Annual review of psychology. 2005;56:207–234. doi: 10.1146/annurev.psych.56.091103.070213. - DOI - PubMed
    1. Maren S, Quirk GJ. Neuronal signalling of fear memory. Nat Rev Neurosci. 2004;5:844–852. doi: 10.1038/nrn1535. - DOI - PubMed

Publication types