Review
. 2014 Jun 1;19(6):967-85.
doi: 10.2741/4261.

Analysis of energy expenditure in diet-induced obese rats

Affiliations
Review

Analysis of energy expenditure in diet-induced obese rats

Houssein Assaad et al. Front Biosci (Landmark Ed). .

Abstract

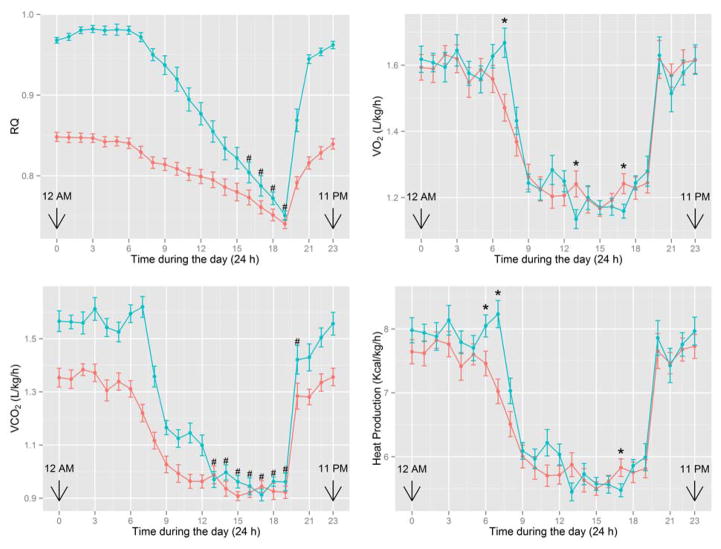
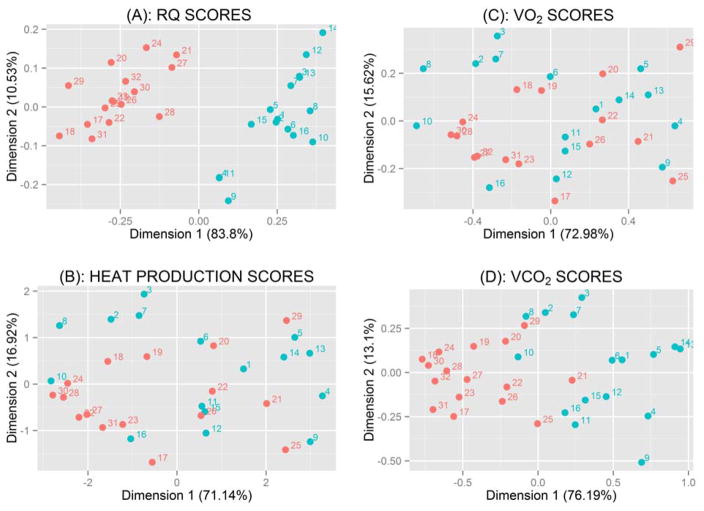
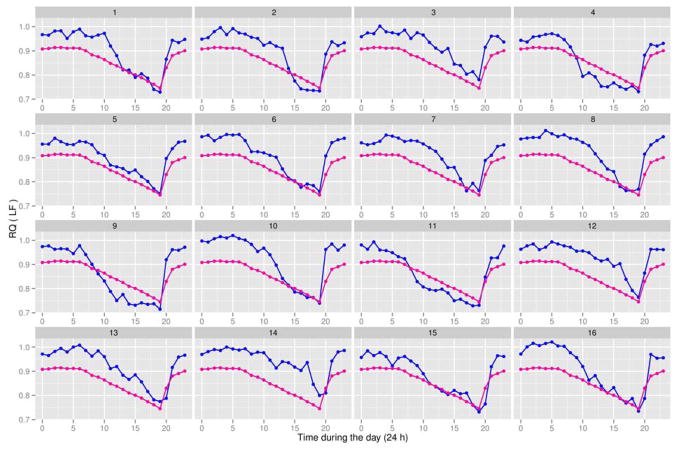
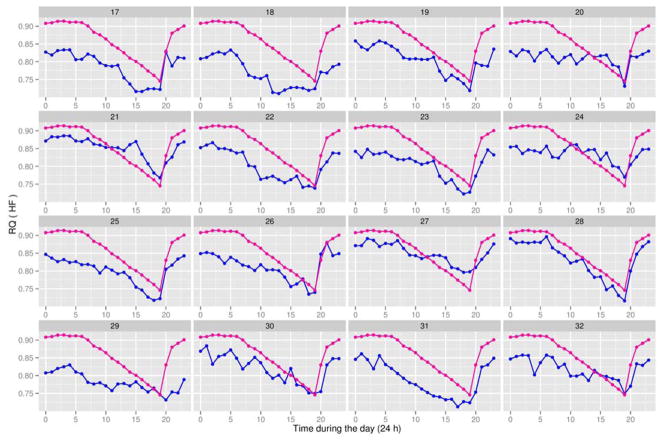
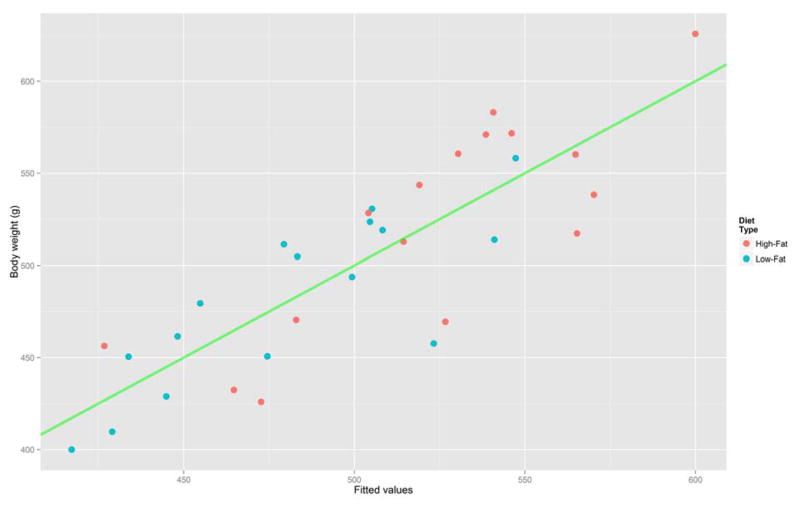
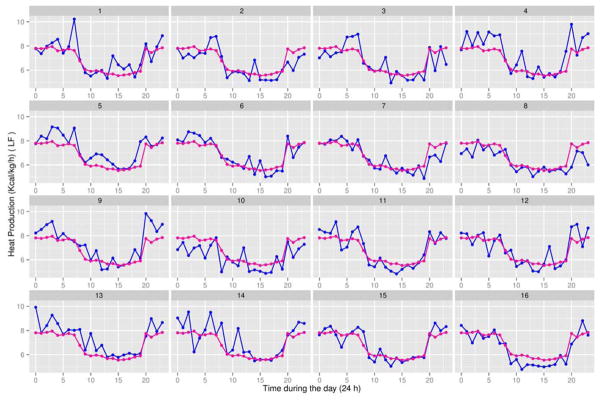
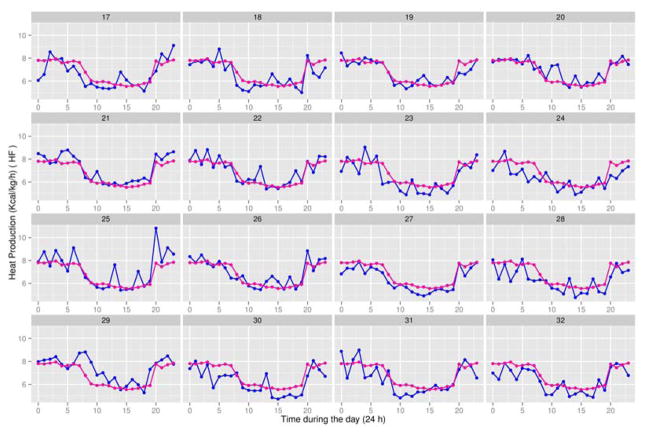
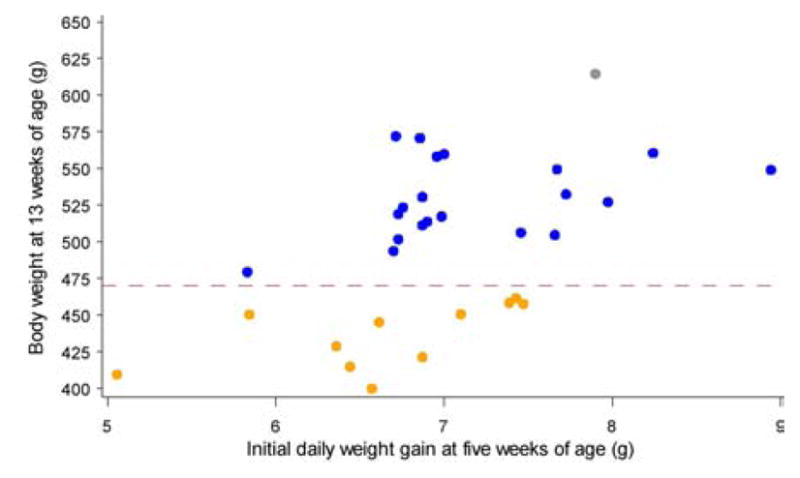
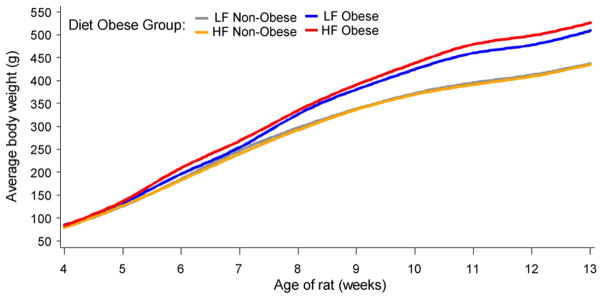
Development of obesity in animals is affected by energy intake, dietary composition, and metabolism. Useful models for studying this metabolic problem are Sprague-Dawley rats fed low-fat (LF) or high-fat (HF) diets beginning at 28 days of age. Through experimental design, their dietary intakes of energy, protein, vitamins, and minerals per kg body weight (BW) do not differ in order to eliminate confounding factors in data interpretation. The 24-h energy expenditure of rats is measured using indirect calorimetry. A regression model is constructed to accurately predict BW gain based on diet, initial BW gain, and the principal component scores of respiratory quotient and heat production. Time-course data on metabolism (including energy expenditure) are analyzed using a mixed effect model that fits both fixed and random effects. Cluster analysis is employed to classify rats as normal-weight or obese. HF-fed rats are heavier than LF-fed rats, but rates of their heat production per kg non-fat mass do not differ. We conclude that metabolic conversion of dietary lipids into body fat primarily contributes to obesity in HF-fed rats.


Figures

Figure 1
Figure 1
Energy metabolism of male Sprague-Dawley rats (Charles River Laboratories) fed a LF (blue line) or HF (red line) diet. Rats were fed a LF or HF diet between 4 and 13 weeks of age. See Table 2 for experimental detail. At 13 weeks of age, rats were placed in a computer-controlled Oxymax instrument (an open circuit calorimeter; Columbus Instruments, OH) to measure 24-h O2 consumption, CO2 production, RQ and heat production (34). Values are mean ± SEM during the day (24 h) at the end of the study. There were 16 rats per diet group. Results were analyzed using a mixed effect model that fits both fixed and random effects (35, 36). The sign “*” denotes a significant effect of diet at the indicated time point. The sign “#” denotes no significant effect of diet at the indicated time point. RQ: P (diet); P (diet x time); P (time); P (time x time) and P (time x time x time) are all less than 0.001. VO2: P (diet) = 0.75; P (diet x time) = 0.12; P (time); P (time x time) and P (time x time x time) are all less than 0.001. VCO2: P (diet); P (diet x time); P (time); P (time x time) and P (time x time x time) are all less than 0.001. HP: P (diet) = 0.138; P (diet x time) = 0.018; P (time); P (time x time) and P (time x time x time) are all less than 0.001.
Figure 2
Figure 2
Plots of the first two principal-component scores for rat energy metabolism. Male Sprague-Dawley rats (Charles River Laboratories) were fed a LF (blue circle) or HF (red circle) diet between 4 and 13 weeks of age. There were 16 rats per diet group. See Table 2 for experimental detail. At 13 weeks of age, rats were placed in a computer-controlled Oxymax instrument (an open circuit calorimeter; Columbus Instruments, OH) to measure 24-h O2 consumption, CO2 production, RQ, and heat production (34). The 24 hourly observations for each measured variable were reduced into two dimensions (two principal-component scores): “dimension 1” and “dimension 2”. The principal-component analysis is considered as a data reduction technique. (A) RQ scores; (B) HP scores; (C) VO2 scores; and (D) VCO2 scores.
Figure 3
Figure 3
Respiratory quotients (RQ) for 13-week-old male Sprague-Dawley rats (Charles River Laboratories) fed a low-fat (LF) diet (blue line) between 4 and 13 weeks of age. There were 16 rats in the LF group, with the animal identification number (#1 to #16) being shown at the top of each subplot. The experiment also involved 16 male Sprague-Dawley rats (Charles River Laboratories) fed a high-fat (HF) diet between 4 and 13 weeks of age. See Table 2 for experimental detail. At 13 weeks of age, rats were placed in a computer-controlled Oxymax instrument (an open circuit calorimeter; Columbus Instruments, OH) to measure 24-h O2 consumption, CO2 production, and RQ (34). The overall average trajectory (magenta line) for RQ values of the 32 rats (16 in the LF group and 16 in the HF group) at each time point is shown in each subplot. This aids in identifying which rats in the LF group had RQ values above or below the average and, therefore in interpreting data on the principal scores. The x-axis represents time during 24 h of the day, where time point “0” = 12 AM and time point “23” = 11 PM.
Figure 4
Figure 4
Respiratory quotients (RQ) for 13-week-old male Sprague-Dawley rats (Charles River Laboratories) fed a high-fat (HF) diet (blue line) between 4 and 13 weeks of age. There were 16 rats in the HF group, with the animal identification number (#17 to #32) being shown at the top of each subplot. The experiment also involved 16 male Sprague-Dawley rats (Charles River Laboratories) fed a low-fat (LF) diet between 4 and 13 weeks of age. See Table 2 for experimental detail. At 13 weeks of age, rats were placed in a computer-controlled Oxymax instrument (an open circuit calorimeter; Columbus Instruments, OH) to measure 24-h O2 consumption, CO2 production, and RQ (34). The overall average trajectory (magenta line) for RQ values of the 32 rats (16 in the LF group and 16 in the HF group) at each time point is shown in each subplot. This aids in identifying which rats in the HF group had RQ values above or below the average and, therefore in interpreting data on the principal scores. The x-axis represents time during 24 h of the day, where time point “0” = 12 AM and time point “23” = 11 PM.
Figure 5
Figure 5
Plot of predicted BW response (x-axis) versus observed BW values (y-axis). See Table 2 for experimental detail. Male Sprague-Dawley rats (Charles River Laboratories) were fed a LF (blue circle) or HF (red circle) diet between 4 and 13 week of age. Body weights of rats were measured weekly. The line y = x (in green) is added to assess the adequacy of the model’s fit.
Figure 6
Figure 6
Rates of heat production (HP) in 13-week-old male Sprague-Dawley rats (Charles River Laboratories) fed a high-fat (LF) diet (blue line) between 4 and 13 weeks of age. There were 16 rats in the LF group, with the animal identification number (#1 to # 16) being shown at the top of each subplot. The experiment also involved 16 male Sprague-Dawley rats (Charles River Laboratories) fed a high-fat (HF) diet between 4 and 13 weeks of age. See Table 2 for experimental detail. At 13 weeks of age, rats were placed in a computer-controlled Oxymax instrument (an open circuit calorimeter; Columbus Instruments, OH) to measure 24-h O2 consumption, CO2 production, and HP (34). HP is calculated according to the Brouwer equation (61): HP (Kcal) = 3.82 × VO2 (in L) + 1.15 × VCO2 (in L). The overall average trajectory (magenta line) for HP of the 32 rats (16 in the LF group and 16 in the HF group) at each time point is shown in each subplot. This aids in identifying which rats in the LF group had HP values above or below the average and, therefore in interpreting data on the principal scores. The x-axis represents time during 24 h of the day, where time point “0” = 12 AM and time point “23” = 11 PM.
Figure 7
Figure 7
Rates of heat production (HP) in 13-week-old male Sprague-Dawley rats (Charles River Laboratories) fed a high-fat (HF) diet (blue line) between 4 and 13 weeks of age. There were 16 rats in the HF group, with the animal identification number (#17 to # 32) being shown at the top of each subplot. The experiment also involved 16 male Sprague-Dawley rats (Charles River Laboratories) fed a low-fat (LF) diet between 4 and 13 weeks of age. See Table 2 for experimental detail. At 13 weeks of age, rats were placed in a computer-controlled Oxymax instrument (an open circuit calorimeter; Columbus Instruments, OH) to measure 24-h O2 consumption, CO2 production, and HP (34). HP is calculated according to the Brouwer equation (61): HP (Kcal) = 3.82 × VO2 (in L) + 1.15 × VCO2 (in L). The overall average trajectory (magenta line) for HP of the 32 rats (16 in the LF group and 16 in the HF group) at each time point is shown in each subplot. This aids in identifying which rats in the HF group had HP values above or below the average and, therefore in interpreting data on the principal scores. The x-axis represents time during 24 h of the day, where time point “0” = 12 AM and time point “23” = 11 PM.
Figure 8
Figure 8
Cluster analysis of body weights for 13-week-old male Sprague-Dawley rats (Charles River Laboratories) fed a low-fat (LF) or high-fat (HF) diet between 4 and 13 weeks of age. See Table 2 for experimental detail. Some rats in the LF group were obese, and some rats in the HF were resistant to the development of obesity. Two clusters of animals are clearly found in the plot based on the initial weight gain during the first week of HF feeding and the body weight at week 13. The rats weighing ≤ 470 and ≥ 470 g at 13 weeks of age are classified as normal-weight (yellow circle) and obese (blue circle), respectively. The mean body-weight in the obese group is 23% greater than that in the normal-weight group (536 vs 436 g).
Figure 9
Figure 9
Body weights of male Sprague-Dawley rats (Charles River Laboratories) fed a low-fat (LF) or high-fat (HF) diet between 4 and 13 of age. See Table 2 for experimental detail. Based on the cluster analysis, 16 rats in each diet group were subdivided into either normal-weight or obese. Among the 32 rats, 12 of them (7 in the LF group and 5 in the HF group) are classified as normal-weight, while 20 of them (9 in the LF group and 11 in the HF group) are classified as obese. Values of the body weights are the means for each subgroup of rats at an indicated age, with the SEM being < 2.2% of the means.

Similar articles

Cited by

References

    1. Speakman JR. Evolutionary perspectives on the obesity epidemic: adaptive, maladaptive, and neutral viewpoints. Annu Rev Nutr. 2013;33:289–317. - PubMed
    1. Hill JO, Peters JC. Environmental contributions to the obesity epidemic. Science. 1998;280:1371–1374. - PubMed
    1. McKnight JR, Satterfield MC, Li XL, Gao HJ, Wang JJ, Li DF, Wu G. Obesity in pregnancy: problems and potential solutions. Front Biosci. 2011;E3:442–452. - PubMed
    1. Aballay LR, Eynard AR, del Díaz MP, Navarro A, Muñoz SE. Overweight and obesity: a review of their relationship to metabolic syndrome, cardiovascular disease, and cancer in South America. Nutr Rev. 2013;71:168–79. - PubMed
    1. Vucenik I, Stains JP. Obesity and cancer risk: evidence, mechanisms, and recommendations. Ann N Y Acad Sci. 2012;1271:37–43. - PMC - PubMed

Publication types