. 2014 Aug;34(8):1258-69.
doi: 10.1038/jcbfm.2014.100. Epub 2014 Jun 4.

The cross-talk between canonical and non-canonical Wnt-dependent pathways regulates P-glycoprotein expression in human blood-brain barrier cells

Affiliations

The cross-talk between canonical and non-canonical Wnt-dependent pathways regulates P-glycoprotein expression in human blood-brain barrier cells

Martha L Pinzón-Daza et al. J Cereb Blood Flow Metab. 2014 Aug.

Abstract

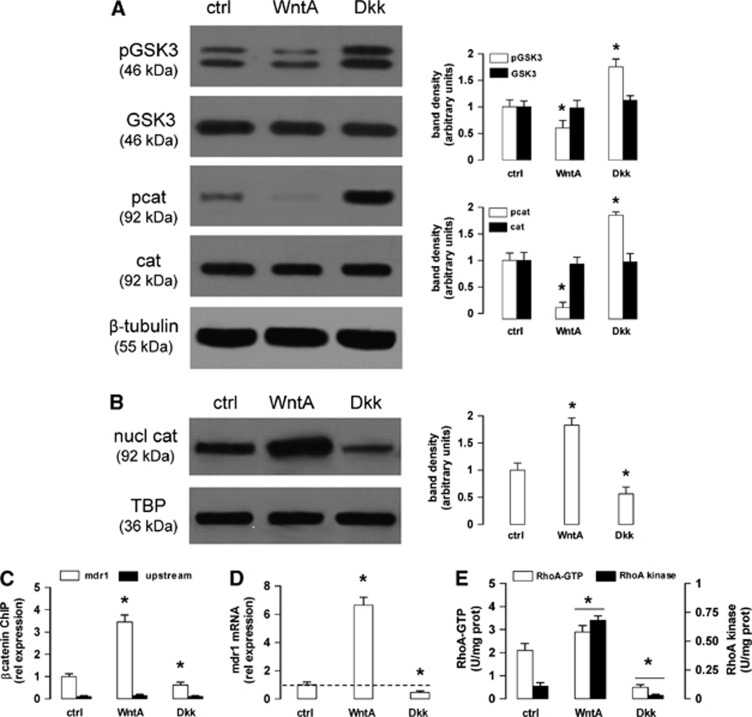
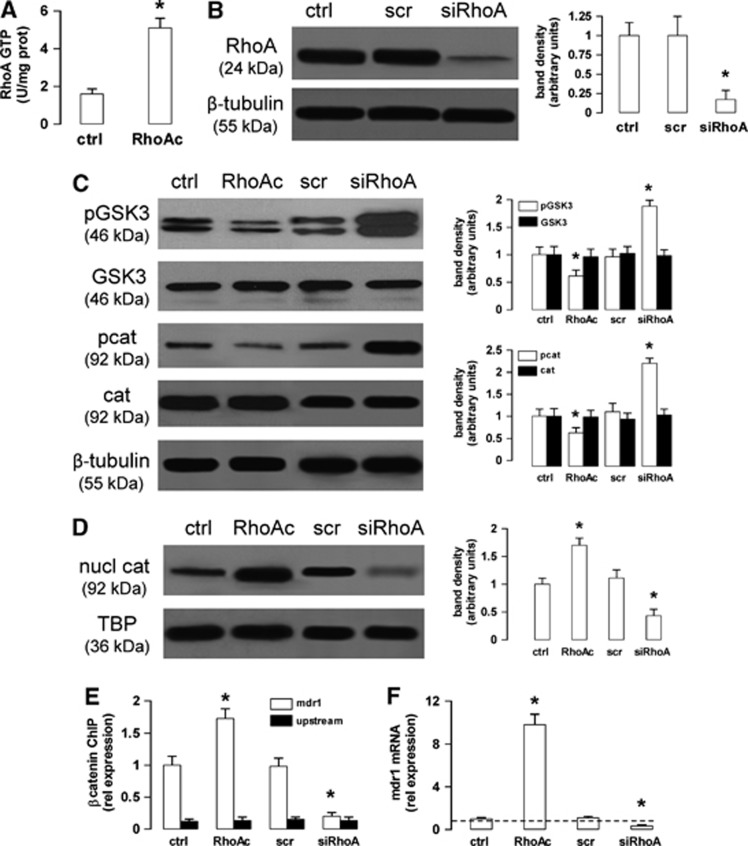
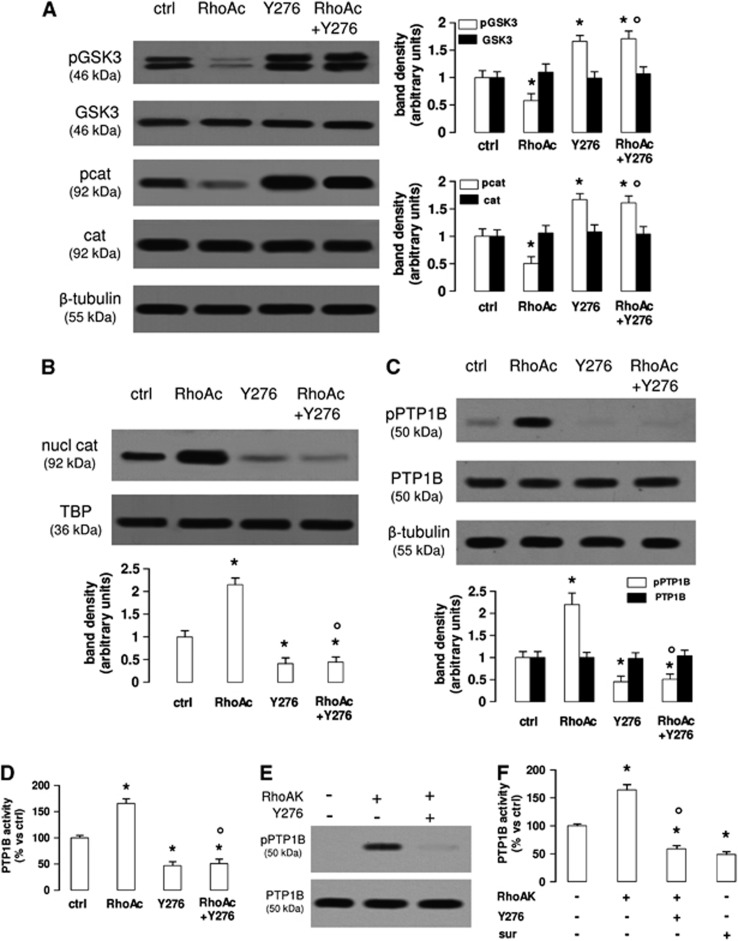
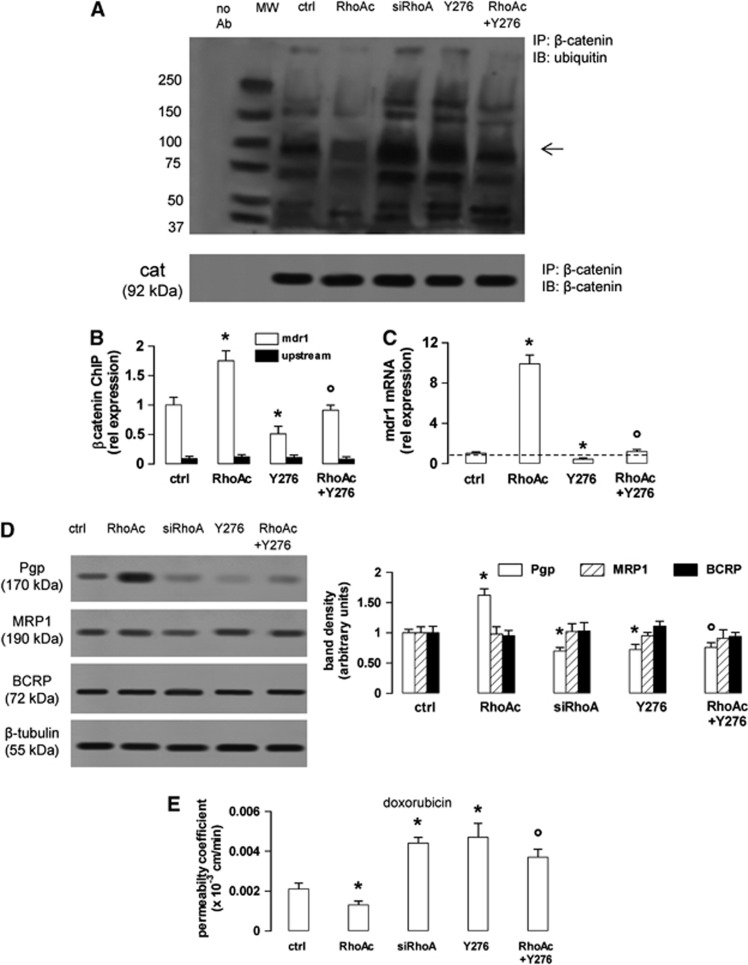
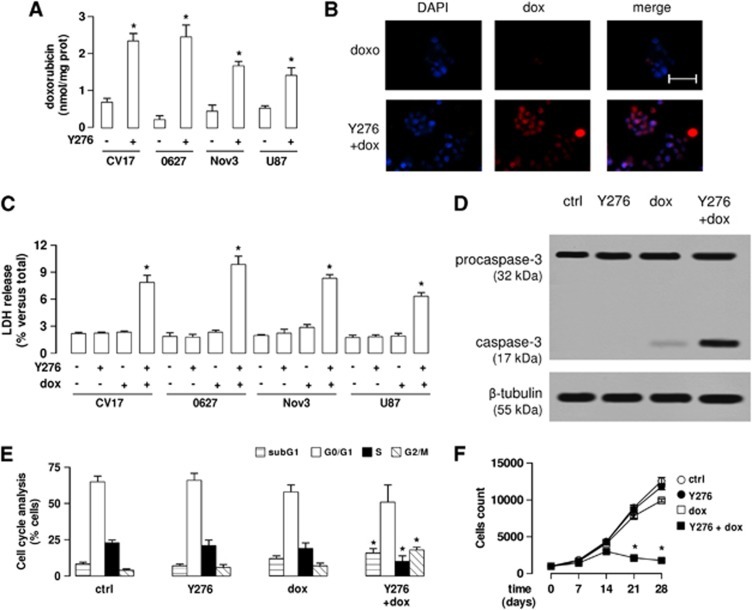
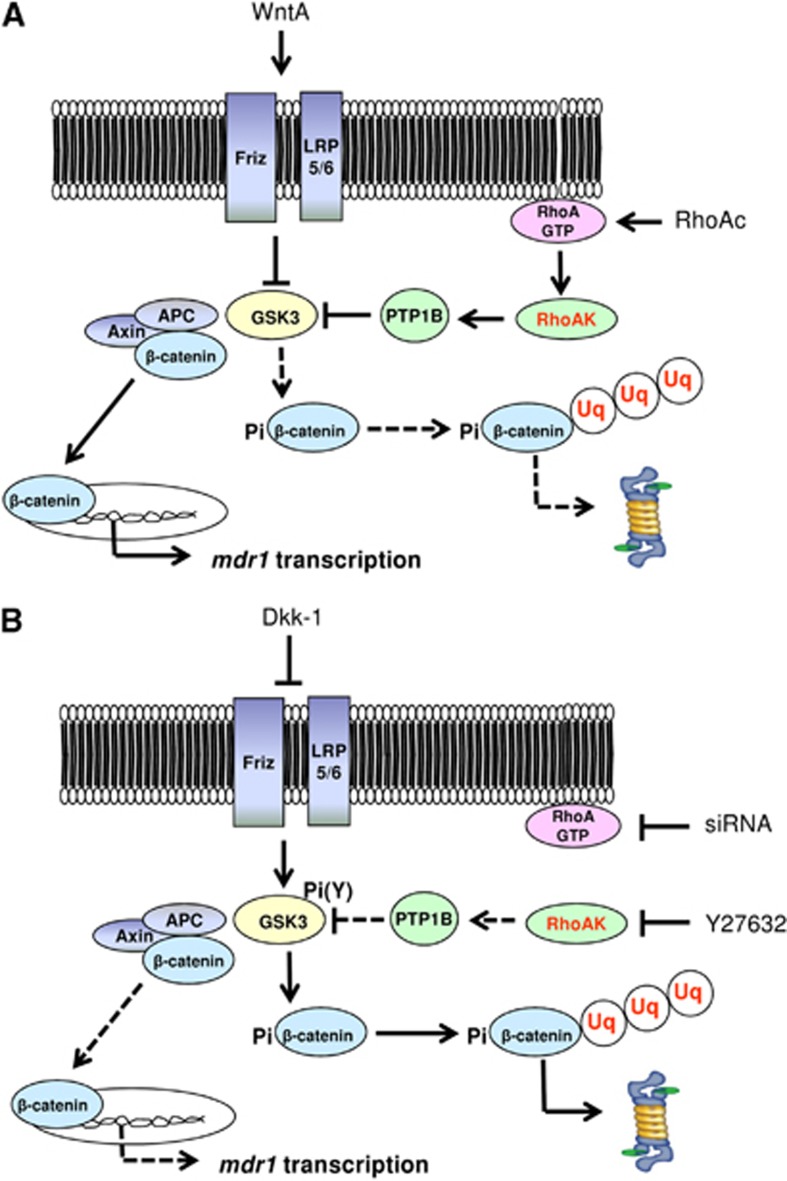
In this work, we investigate if and how transducers of the 'canonical' Wnt pathway, i.e., Wnt/glycogen synthase kinase 3 (GSK3)/β-catenin, and transducers of the 'non-canonical' Wnt pathway, i.e., Wnt/RhoA/RhoA kinase (RhoAK), cooperate to control the expression of P-glycoprotein (Pgp) in blood-brain barrier (BBB) cells. By analyzing human primary brain microvascular endothelial cells constitutively activated for RhoA, silenced for RhoA or treated with the RhoAK inhibitor Y27632, we found that RhoAK phosphorylated and activated the protein tyrosine phosphatase 1B (PTP1B), which dephosphorylated tyrosine 216 of GSK3, decreasing the GSK3-mediated inhibition of β-catenin. By contrast, the inhibition of RhoA/RhoAK axis prevented the activation of PTP1B, enhanced the GSK3-induced phosphorylation and ubiquitination of β-catenin, and reduced the β-catenin-driven transcription of Pgp. The RhoAK inhibition increased the delivery of Pgp substrates like doxorubicin across the BBB and improved the doxorubicin efficacy against glioblastoma cells co-cultured under a BBB monolayer. Our data demonstrate that in human BBB cells the expression of Pgp is controlled by a cross-talk between canonical and non-canonical Wnt pathways. The disruption of this cross-talk, e.g., by inhibiting RhoAK, downregulates Pgp and increases the delivery of Pgp substrates across the BBB.


Figures

Figure 1
Figure 1
Wnt controls the β-catenin-induced transcription of P-glycoprotein (Pgp) and RhoA activity in human blood–brain barrier cells. The hCMEC/D3 cells were grown in fresh medium (ctrl), with the Wnt activator 2-amino-4-(3,4-(methylenedioxy)benzylamino)-6-(3-methoxyphenyl)pyrimidine (WntA; 20 μmol/L for 24 hours) or the Wnt inhibitor Dickkopf-1 (Dkk-1) protein (Dkk; 1 μg/mL for 24 hours). (A) Western blot analysis of phospho(Tyr216)GSK3 (glycogen synthase kinase 3) (pGSK3), GSK3, phospho(Ser33/Ser37/Thr41)β-catenin (pcat), β-catenin (cat) in whole-cell lysates. The β-tubulin expression was used as a control of equal protein loading. The figure is representative of three experiments with similar results. The band density ratio between each protein and β-tubulin was expressed as arbitrary units. Versus ctrl cells: *P<0.02. (B) Nuclear extracts were analyzed for the amount of β-catenin (nucl cat). The expression of TATA-binding protein (TBP) was used as a control of equal protein loading. The figure is representative of three experiments with similar results. The band density ratio between each protein and TBP was expressed as arbitrary units. Versus ctrl cells: *P<0.02. (C) Chromatin Immunoprecipitation assay. The genomic DNA was extracted, immunoprecipitated with an anti-β-catenin antibody and analyzed by quantitative real-time PCR (qRT–PCR), using primers for the β-catenin binding site on mdr1 promoter (open bars) or for an upstream region (black bars), chosen as a negative control. Results are presented as means±s.d. (n=4). Versus ctrl: *P<0.05. (D) The mdr1 expression was detected by qRT–PCR. Data are presented as means±s.d. (n=4). Versus ctrl: *P<0.02. (E) RhoA/RhoA kinase (RhoAK) activity. The samples were subjected to enzyme-linked immunosorbent assays to measure the amount of RhoA-GTP (open bars) and the activity of RhoAK (black bars). Data are presented as means±s.d. (n=4). Versus ctrl: *P<0.05.
Figure 2
Figure 2
The RhoA activity controls the glycogen synthase kinase 3 (GSK3)/β-catenin-driven transcription of P-glycoprotein (Pgp) in human blood–brain barrier cells. (A) The hCMEC/D3 cells were grown in fresh medium in the absence (ctrl) or in the presence of the RhoA activator II (RhoAc; 5 μg/mL for 3 hours), then the activity of RhoA was measured by an enzyme-linked immunosorbent assay. Data are presented as means±s.d. (n=4). Versus ctrl: *P<0.005. (B) The cells were cultured for 48 hours with fresh medium (ctrl), treated with a non-targeting scrambled small interfering RNA (siRNA) (scr) or a RhoA-targeting specific siRNA pool (siRhoA). The expression of RhoA was measured in whole-cell lysates by western blotting. The β-tubulin expression was used as a control of equal protein loading. The figure is representative of three experiments with similar results. The band density ratio between each protein and β-tubulin was expressed as arbitrary units. Versus ctrl cells: *P<0.005. (C) Western blot analysis of phospho(Tyr216)GSK3 (pGSK3), GSK3, phospho(Ser33/Ser37/Thr41)β-catenin (pcat), β-catenin (cat) in whole-cell lysates of hCMEC/D3 cells treated as described in (A and B). The β-tubulin expression was used as a control of equal protein loading. The figure is representative of three experiments with similar results. The band density ratio between each protein and β-tubulin was expressed as arbitrary units. Versus ctrl cells: *P<0.05. (D) Nuclear extracts from cells treated as described in (A and B) were analyzed for the amount of β-catenin (nucl cat). The expression of TATA-binding protein (TBP) was used as a control of equal protein loading. The band density ratio between each protein and TBP was expressed as arbitrary units. Versus ctrl cells: *P<0.005. (E) Cells were cultured as reported in (A and B). After 3 hours (for the RhoAc II-treated cells) or 48 hours (for the scrambled- and RhoA-targeting siRNA-treated cells), the genomic DNA was extracted, immunoprecipitated with an anti-β-catenin antibody and analyzed by quantitative real-time PCR (qRT–PCR), using primers for the β-catenin binding site on the mdr1 promoter (open bars) or for an upstream region (black bars), chosen as a negative control. The ctrl bars in the figure correspond to the DNA extracted after 48 hours from hCMEC/D3 cells; the results were superimposable for the DNA extracted after 3 hours (not shown in the figure). Results are expressed as means±s.d. (n=4). Versus ctrl: *P<0.01. (F) The cells were treated as detailed in (A and B). After 3 hours (for the RhoAc II-treated cells) or 48 hours (for the scrambled- and RhoA-targeting siRNA-treated cells), the mdr1 expression was detected by qRT–PCR. Data are presented as means±s.d. (n=4). Versus ctrl *P<0.005.
Figure 3
Figure 3
The RhoA kinase (RhoAK) inhibition increases the activation of glycogen synthase kinase 3 (GSK3), by decreasing the activity of protein tyrosine phosphatase 1B (PTP1B) in human blood–brain barrier cells. The hCMEC/D3 cells were grown in fresh medium (ctrl) or in medium containing the RhoA activator II (RhoAc; 5 μg/mL for 3 hours) or the RhoAK inhibitor Y27632 (Y276; 10 μmol/L for 3 hours), alone or co-incubated. (A) Western blot analysis of phospho(Tyr216)GSK3 (pGSK3), GSK3, phospho(Ser33/Ser37/Thr41)β-catenin (pcat), β-catenin (cat) in whole-cell lysates. The β-tubulin expression was used as a control of equal protein loading. The figure is representative of three experiments with similar results. The band density ratio between each protein and β-tubulin was expressed as arbitrary units. Versus ctrl cells: *P<0.05; versus RhoAc alone: °P<0.001. (B) The nuclear extracts were analyzed for the amount of β-catenin (nucl cat). The expression of TATA-binding protein (TBP) was used as a control of equal protein loading. The band density ratio between each protein and TBP was expressed as arbitrary units. Versus ctrl cells: *P<0.002; versus RhoAc alone: °P<0.001. (C) Western blot analysis of phospho(Ser50)PTP1B (pPTP1B) and PTP1B. The β-tubulin expression was used as a control of equal protein loading. The figure is representative of three experiments with similar results. The band density ratio between each protein and β-tubulin was expressed as arbitrary units. Versus ctrl cells: *P<0.005; versus RhoAc alone: °P<0.001. (D) The activity of endogenous PTP1B was measured in cell lysates, as reported under Materials and Methods. Data are presented as means±s.d. (n=3). Versus ctrl: *P<0.002; versus RhoAc alone: °P<0.001. (E) In vitro phosphorylation of PTP1B in the presence of RhoAK and Y27632. 5 U of human recombinant PTP1B were incubated in the absence (−) or in the presence of 10 U of human recombinant RhoAK, alone or in the presence of the RhoAK inhibitor Y27632 (Y276; 10 μmol/L) for 30 minutes at 37°C, in a reaction buffer containing 25 mmol/L ATP. At the end of this incubation time, samples were resolved by SDS–PAGE and probed with anti-phospho(Ser50)PTP1B (pPTP1B) or anti-PTP1B antibodies. The figure is representative of three experiments with similar results. (F) The activity of purified PTP1B was measured in a cell-free system, using a recombinant phospho(Tyr 216)GSK3 peptide as substrate. When indicated, 10 U of RhoAK, alone or in the presence of Y27632 (Y276; 10 μmol/L), were added in the reaction mix 30 minutes before adding the phospho(Tyr 216)GSK3 peptide. Suramin (sur; 10 μmol/L), a known inhibitor of PTP1B, was added together with the phospho(Tyr 216)GSK3 peptide, as internal control. Data are presented as means±s.d. (n=3). Versus PTP1B alone (): *P<0.002; versus RhoAK: °P<0.001.
Figure 4
Figure 4
The RhoA kinase (RhoAK) inhibition enhances the ubiquitination of β-catenin, downregulates the β-catenin-induced transcription of P-glycoprotein (Pgp) and increases the doxorubicin permeability in human blood–brain barrier cells. The hCMEC/D3 cells were grown in fresh medium (ctrl), or in medium containing the RhoA activator II (RhoAc; 5 μg/mL for 3 hours) or the RhoAK inhibitor Y27632 (Y276; 10 μmol/L for 3 hours), alone or co-incubated. When indicated, the cells were treated with a non-targeting scrambled small interfering RNA (siRNA) or a RhoA-targeting specific siRNA (siRhoA) for 48 hours (panel A) or 72 hours (panels D and E). (A) Whole-cell lysates were immunoprecipitated (IP) with an anti-β-catenin antibody, then immunoblotted (IB) with an anti-mono/polyubiquitin antibody or with an anti-β-catenin antibody. Cells treated with non-targeting scrambled siRNA had the same level of ubiquitination than untreated (ctrl) cells (not shown). The figure is representative of three experiments with similar results. no Ab: samples immunoprecipitated without anti-β-catenin antibody. MW, molecular weight markers. The 92 kDa band corresponding to the native β-catenin protein is indicated by the arrow. (B) Chromatin immunoprecipitation assay. The genomic DNA was extracted, immunoprecipitated with an anti-β-catenin antibody and analyzed by qRT–PCR, using primers for the β-catenin-binding site on the mdr1 promoter (open bars) or for an upstream region (black bars), chosen as a negative control. Results are expressed as means±s.d. (n=4). Versus ctrl: *P<0.05; versus RhoAc: °P<0.01. (C) The mdr1 expression was detected by qRT–PCR. Data are presented as means±s.d. (n=4). Versus ctrl: *P<0.005; versus RhoAc: °P<0.001. (D) Western blot analysis of Pgp, multidrug resistance-related protein 1 (MRP1) and breast cancer resistance protein (BCRP) in the whole-cell lysates of hCMEC/D3 cells treated as described above. The β-tubulin expression was used as a control of equal protein loading. The figure is representative of three experiments with similar results. The band density ratio between each protein and β-tubulin was expressed as arbitrary units. Versus ctrl cells: *P<0.02; versus RhoAc: °P< 0.005. (E) Doxorubicin permeability. The cells were grown for 7 days up to confluence in Transwell inserts and incubated as reported above. At the end of the incubation period, doxorubicin (5 μmol/L) was added in the upper chamber. After 3 hours the amount of drug recovered from the lower chamber was measured fluorimetrically. The permeability coefficient was calculated as reported under Materials and Methods. In cells treated with the non-targeting scrambled siRNA the permeability coefficient was 0.0018±0.0002 (not significant versus ctrl cells). Measurements were performed in duplicate and data are presented as means±s.d. (n=3). Versus ctrl: *P<0.05; versus RhoAc: °P<0.02.
Figure 5
Figure 5
The RhoA kinase (RhoAK) inhibitor Y27632 increases the doxorubicin delivery and cytotoxicity in glioblastoma cells co-cultured with blood–brain barrier cells. The hCMEC/D3 cells were grown for 7 days up to confluence in Transwell inserts; CV17, 01010627, Nov3, and U87-MG cells were seeded at day 4 in the lower chamber. After 3 days of co-culture, the supernatant in the upper chamber was replaced with fresh medium without ( or ctrl) or with Y27632 (Y276; 10 μmol/L for 3 hours). After this incubation time, doxorubicin (dox; 5 μmol/L) was added in the upper chamber for 3 hours (panels A and B) or 24 hours (panels CF), then the following investigations were performed. (A) Fluorimetric quantification of intracellular doxorubicin in glioblastoma cells. Data are presented as means±s.d. (n=4). Versus untreated (−) cells: *P<0.001. (B) The 01010627 cells were seeded on sterile glass coverslips, treated as reported above, then stained with 4′,6-diamidino-2-phenylindole dihydrochloride (DAPI) and analyzed by fluorescence microscopy to detect the intracellular accumulation of doxorubicin. Magnification: × 63 objective (1.4 numerical aperture); × 10 ocular lens. The micrographs are representative of three experiments with similar results. Scale bar, 20 μm. (C) The glioblastoma cells were checked spectrophotometrically for the extracellular release of lactate dehydrogenase (LDH) activity. Data are presented as means±s.d. (n=4). Versus untreated (−) cells: *P<0.001. (D) The whole-cell lysates from 01010627 cells were resolved by SDS–PAGE and immunoblotted with an anti-caspase 3 antibody (recognizing both pro-caspase and cleaved active caspase). The β-tubulin expression was used as a control of equal protein loading. The figure is representative of three experiments with similar results. (E) Cell cycle analysis. The distribution of the 01010627 cells in sub-G1, G0/G1, S, G2/M phase was analyzed by flow cytometry, as detailed under Materials and Methods. Data are presented as means±s.d. (n=4). Versus ctrl: *P<0.005. (F). After 3 days of co-culture between hCMEC/D3 and 01010627 cells, the medium of the upper chamber was replaced with fresh medium (open circles) or medium containing Y27632 (Y276; 10 μmol/L for 3 hours, solid circles), doxorubicin (dox; 5 μmol/L for 24 hours, open squares), Y27632 (Y276; 10 μmol/L for 3 hours) followed by doxorubicin (doxo; 5 μmol/L for 24 hours, solid squares). Drug treatments were repeated every 7 days, as reported in the Materials and Methods section. The proliferation of glioblastoma cells was monitored weekly by crystal violet staining. Measurements were performed in triplicate and data are presented as means±s.d. (n=4). Versus ctrl: *P<0.001.
Figure 6
Figure 6
Cross-talk between Wnt/GSK3 pathway and Wnt/RhoA/RhoA kinase (RhoAK) pathway and effects on P-glycoprotein (Pgp) expression in human blood–brain barrier (BBB) cells. (A) The Wnt activators (WntA) reduce the glycogen synthase kinase 3 (GSK3)-mediated phosphorylation and ubiquitination of β-catenin, decreasing its proteasomal degradation. In these conditions, β-catenin is released from the APC/axin complex, translocates into the nucleus, and activates the transcription of mdr1 gene, which encodes for Pgp. The RhoA activation reduces as well the activity of GSK3: the active RhoA increases the activity of RhoAK, which induces the phosphorylation on serine 50 of protein tyrosine phosphatase 1B (PTP1B). After this phosphorylation, PTP1B dephosphorylates GSK3 on tyrosine 216 and inactivates it. Overall, the activation of the RhoA/RhoAK axis contributes to the transcription of β-catenin target genes, like mdr1. (B) The Wnt inhibitors (e.g., Dickkopf-1 (Dkk-1)) increase the GSK3-mediated phosphorylation and ubiquitination of β-catenin, priming it for the proteasomal degradation. The inhibition of RhoA (e.g., by RhoA small interfering RNA (siRNA)) or RhoAK (e.g., by Y27632) increases the GSK3 activity, by reducing the RhoAK-mediated phosphorylation of PTP1B on serine 50 and preventing the dephosphorylation of GSK3 on tyrosine 216. As a result, the nuclear translocation of β-catenin and its transcriptional activity are reduced, whereas the ubiquitination and proteasomal degradation of β-catenin are increased. These data lead to hypothesize the existence of a cross-talk between the Wnt/GSK3 canonical pathway and the Wnt/RhoA/RhoAK non-canonical pathway in human BBB cells. APC, adenomatous polyposis coli; Friz, Frizzled; LRP5/6, low density lipoprotein receptor-related protein 5/6; Pi, phosphate; Pi(Y), phosphotyrosine; RhoAc, RhoA activator II; RhoAK, RhoAK; Uq, ubiquitin. Continuous arrows indicate activated pathways; dotted arrows indicate inhibited pathways.

Comment in

Similar articles

Cited by

References

    1. Agarwal S, Sane R, Oberoi R, Ohlfest JR, Elmquist WF. Delivery of molecularly targeted therapy to malignant glioma, a disease of the whole brain. Expert Rev Mol Med. 2011;13:e17. - PMC - PubMed
    1. Lim JC, Kania KD, Wijesuriya H, Chawla S, Sethi JK, Pulaski L, et al. Activation of β-catenin signalling by GSK-3 inhibition increases p-glycoprotein expression in brain endothelial cells. J Neurochem. 2008;106:1855–1865. - PMC - PubMed
    1. Kania KD, Wijesuriya HC, Hladky SB, Barrand MA. Beta amyloid effects on expression of multidrug efflux transporters in brain endothelial cells. Brain Res. 2011;1418:1–11. - PubMed
    1. Katoh M, Katoh M. WNT signalling pathway and stem cells signaling network. Clin Cancer Res. 2007;13:4042–4045. - PubMed
    1. MacDonald BT, Tamai K, He X. Wnt/β-catenin signaling: components, mechanisms, and diseases. Dev Cell. 2009;17:9–26. - PMC - PubMed

Publication types

MeSH terms