

Consequences of kriging and land use regression for PM2.5 predictions in epidemiologic analyses: insights into spatial variability using high-resolution satellite data
- PMID: 24896768
- PMCID: PMC4758216
- DOI: 10.1038/jes.2014.40
Consequences of kriging and land use regression for PM2.5 predictions in epidemiologic analyses: insights into spatial variability using high-resolution satellite data
Abstract
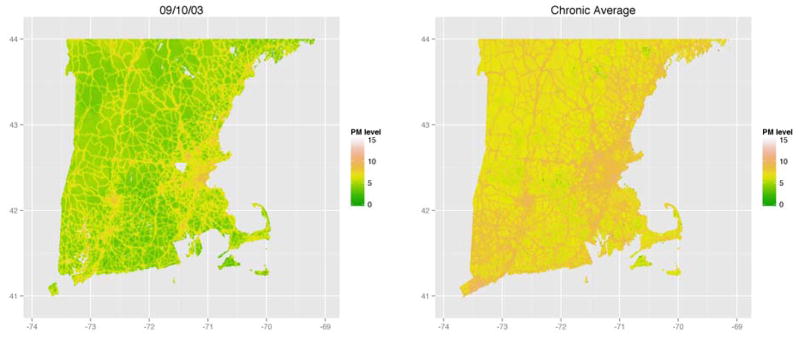
Many epidemiological studies use predicted air pollution exposures as surrogates for true air pollution levels. These predicted exposures contain exposure measurement error, yet simulation studies have typically found negligible bias in resulting health effect estimates. However, previous studies typically assumed a statistical spatial model for air pollution exposure, which may be oversimplified. We address this shortcoming by assuming a realistic, complex exposure surface derived from fine-scale (1 km × 1 km) remote-sensing satellite data. Using simulation, we evaluate the accuracy of epidemiological health effect estimates in linear and logistic regression when using spatial air pollution predictions from kriging and land use regression models. We examined chronic (long-term) and acute (short-term) exposure to air pollution. Results varied substantially across different scenarios. Exposure models with low out-of-sample R(2) yielded severe biases in the health effect estimates of some models, ranging from 60% upward bias to 70% downward bias. One land use regression exposure model with >0.9 out-of-sample R(2) yielded upward biases up to 13% for acute health effect estimates. Almost all models drastically underestimated the SEs. Land use regression models performed better in chronic effect simulations. These results can help researchers when interpreting health effect estimates in these types of studies.
Figures
References
-
- Brook RD, Rajagopalan S, Pope CA, 3rd, Brook JR, Bhatnagar A, Diez-Roux AV, et al. Particulate matter air pollution and cardiovascular disease: An update to the scientific statement from the American Heart Association. Circulation. 2010;121:2331–2378. - PubMed
-
- Brauer M, Hoek G, van Vliet P, Meliefste K, Fischer P, Gehring U, et al. Estimating long-term average particulate air pollution concentrations: application of traffic indicators and geographic information systems. Epidemiology. 2003;14:228–239. - PubMed
-
- Jerrett M, Burnett RT, Ma R, Pope CA, 3rd, Krewski D, Newbold KB, et al. Spatial analysis of air pollution and mortality in Los Angeles. Epidemiology. 2005;16:727–736. - PubMed
Publication types
MeSH terms
Substances
Grants and funding
LinkOut - more resources
Full Text Sources
Other Literature Sources
Medical
