

Integrative analysis of transcriptional regulatory network and copy number variation in intrahepatic cholangiocarcinoma
- PMID: 24897108
- PMCID: PMC4045758
- DOI: 10.1371/journal.pone.0098653
Integrative analysis of transcriptional regulatory network and copy number variation in intrahepatic cholangiocarcinoma
Abstract
Background: Transcriptional regulatory network (TRN) is used to study conditional regulatory relationships between transcriptional factors and genes. However few studies have tried to integrate genomic variation information such as copy number variation (CNV) with TRN to find causal disturbances in a network. Intrahepatic cholangiocarcinoma (ICC) is the second most common hepatic carcinoma with high malignancy and poor prognosis. Research about ICC is relatively limited comparing to hepatocellular carcinoma, and there are no approved gene therapeutic targets yet.
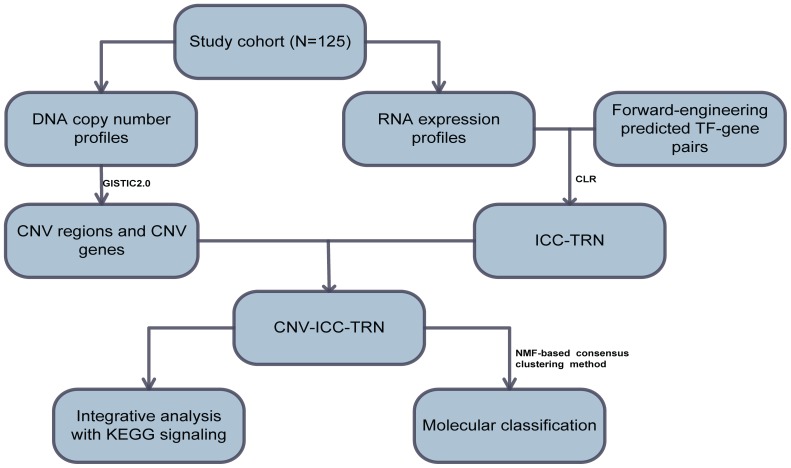
Method: We first constructed TRN of ICC (ICC-TRN) using forward-and-reverse combined engineering method, and then integrated copy number variation information with ICC-TRN to select CNV-related modules and constructed CNV-ICC-TRN. We also integrated CNV-ICC-TRN with KEGG signaling pathways to investigate how CNV genes disturb signaling pathways. At last, unsupervised clustering method was applied to classify samples into distinct classes.
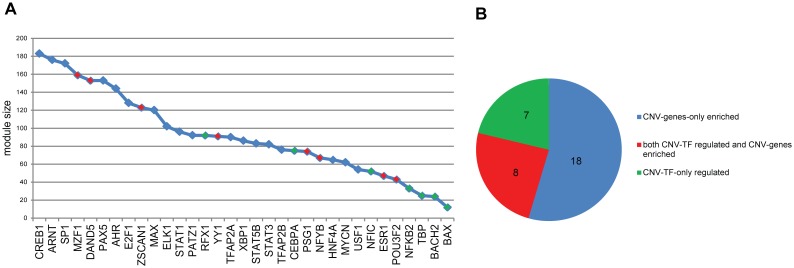
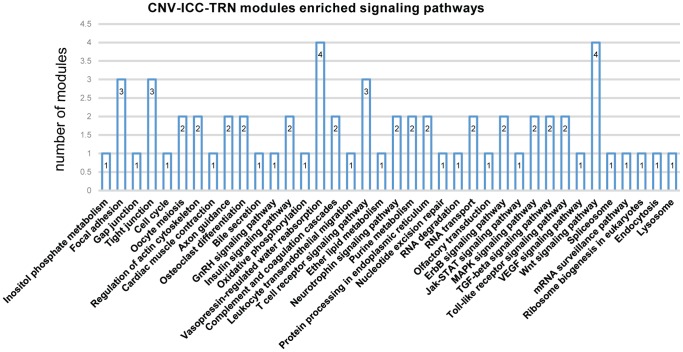
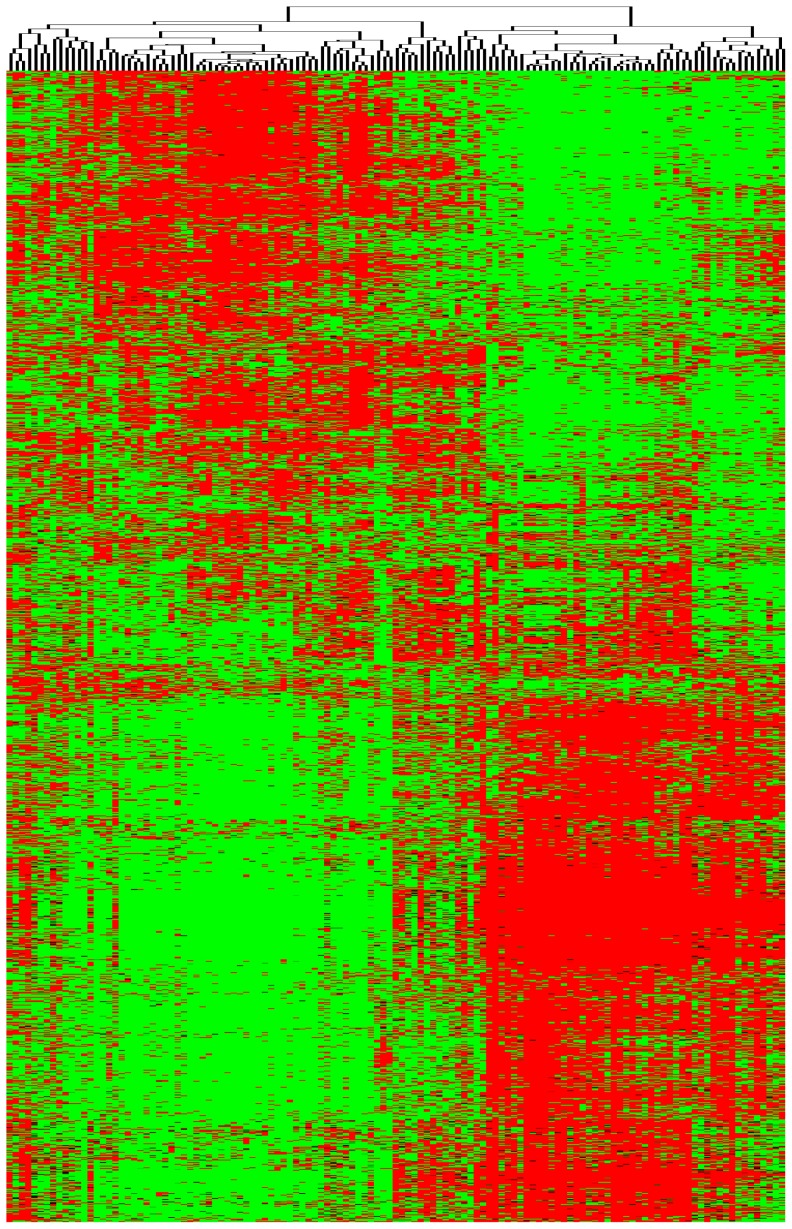
Result: We obtained CNV-ICC-TRN containing 33 modules which were enriched in ICC-related signaling pathways. Integrated analysis of the regulatory network and signaling pathways illustrated that CNV might interrupt signaling through locating on either genomic sites of nodes or regulators of nodes in a signaling pathway. In the end, expression profiles of nodes in CNV-ICC-TRN were used to cluster the ICC patients into two robust groups with distinct biological function features.
Conclusion: Our work represents a primary effort to construct TRN in ICC, also a primary effort to try to identify key transcriptional modules based on their involvement of genetic variations shown by gene copy number variations (CNV). This kind of approach may bring the traditional studies of TRN based only on expression data one step further to genetic disturbance. Such kind of approach can easily be extended to other disease samples with appropriate data.
Conflict of interest statement
Figures

Similar articles
-
Integrative molecular analysis of intrahepatic cholangiocarcinoma reveals 2 classes that have different outcomes.Gastroenterology. 2013 Apr;144(4):829-40. doi: 10.1053/j.gastro.2013.01.001. Epub 2013 Jan 4. Gastroenterology. 2013. PMID: 23295441 Free PMC article.
-
Identification of biomarkers of intrahepatic cholangiocarcinoma via integrated analysis of mRNA and miRNA microarray data.Mol Med Rep. 2017 Mar;15(3):1051-1056. doi: 10.3892/mmr.2017.6123. Epub 2017 Jan 16. Mol Med Rep. 2017. PMID: 28098904 Free PMC article.
-
Patterns of chromosomal copy-number alterations in intrahepatic cholangiocarcinoma.BMC Cancer. 2015 Mar 14;15:126. doi: 10.1186/s12885-015-1111-6. BMC Cancer. 2015. PMID: 25879652 Free PMC article.
-
Multiple cellular origins and molecular evolution of intrahepatic cholangiocarcinoma.Cancer Lett. 2016 Sep 1;379(2):253-61. doi: 10.1016/j.canlet.2016.02.038. Epub 2016 Mar 2. Cancer Lett. 2016. PMID: 26940139 Review.
-
Genetic profiling of intrahepatic cholangiocarcinoma.Curr Opin Gastroenterol. 2012 May;28(3):266-72. doi: 10.1097/MOG.0b013e3283523c7e. Curr Opin Gastroenterol. 2012. PMID: 22395571 Free PMC article. Review.
Cited by
-
Determination of WWOX Function in Modulating Cellular Pathways Activated by AP-2α and AP-2γ Transcription Factors in Bladder Cancer.Cells. 2022 Apr 19;11(9):1382. doi: 10.3390/cells11091382. Cells. 2022. PMID: 35563688 Free PMC article.
-
Differential enrichment of H3K9me3 in intrahepatic cholangiocarcinoma.BMC Med Genomics. 2022 Aug 26;15(1):185. doi: 10.1186/s12920-022-01338-1. BMC Med Genomics. 2022. PMID: 36028818 Free PMC article.
-
Meta-analysis of gene expression profiles identifies differential biomarkers for hepatocellular carcinoma and cholangiocarcinoma.Tumour Biol. 2016 Sep;37(9):12755-12766. doi: 10.1007/s13277-016-5186-8. Epub 2016 Jul 22. Tumour Biol. 2016. PMID: 27448818
-
Genetic profiling of intrahepatic cholangiocarcinoma and its clinical implication in targeted therapy.Am J Cancer Res. 2016 Feb 15;6(3):577-86. eCollection 2016. Am J Cancer Res. 2016. PMID: 27152236 Free PMC article. Review.
-
Translational Bioinformatics for Cholangiocarcinoma: Opportunities and Challenges.Int J Biol Sci. 2018 May 22;14(8):920-929. doi: 10.7150/ijbs.24622. eCollection 2018. Int J Biol Sci. 2018. PMID: 29989102 Free PMC article. Review.
References
-
- Blais A, Dynlacht BD (2005) Constructing transcriptional regulatory networks. Genes & development 19: 1499–1511. - PubMed
-
- Baum B, Craig G (2004) RNAi in a postmodern, postgenomic era. Oncogene 23: 8336–8339. - PubMed
-
- Cartharius K, Frech K, Grote K, Klocke B, Haltmeier M, et al. (2005) MatInspector and beyond: promoter analysis based on transcription factor binding sites. Bioinformatics 21: 2933–2942. - PubMed
Publication types
MeSH terms
Substances
LinkOut - more resources
Full Text Sources
Other Literature Sources
Medical
