See-saw rocking: an in vitro model for mechanotransduction research
- PMID: 24898022
- PMCID: PMC4208364
- DOI: 10.1098/rsif.2014.0330
See-saw rocking: an in vitro model for mechanotransduction research
Abstract
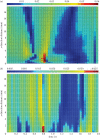
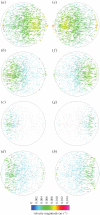
In vitro mechanotransduction studies, uncovering the basic science of the response of cells to mechanical forces, are essential for progress in tissue engineering and its clinical application. Many varying investigations have described a multitude of cell responses; however, as the precise nature and magnitude of the stresses applied are infrequently reported and rarely validated, the experiments are often not comparable, limiting research progress. This paper provides physical and biological validation of a widely available fluid stimulation device, a see-saw rocker, as an in vitro model for cyclic fluid shear stress mechanotransduction. This allows linkage between precisely characterized stimuli and cell monolayer response in a convenient six-well plate format. Models of one well were discretized and analysed extensively using computational fluid dynamics to generate convergent, stable and consistent predictions of the cyclic fluid velocity vectors at a rocking frequency of 0.5 Hz, accounting for the free surface. Validation was provided by comparison with flow velocities measured experimentally using particle image velocimetry. Qualitative flow behaviour was matched and quantitative analysis showed agreement at representative locations and time points. Maximum shear stress of 0.22 Pa was estimated near the well edge, and time-average shear stress ranged between 0.029 and 0.068 Pa. Human tenocytes stimulated using the system showed significant increases in collagen and GAG secretion at 2 and 7 day time points. This in vitro model for mechanotransduction provides a versatile, flexible and inexpensive method for the fluid shear stress impact on biological cells to be studied.
Keywords: computational fluid dynamics; cyclic fluid flow; particle image velocimetry; rocking; shear stress; tenocytes.
© 2014 The Author(s) Published by the Royal Society. All rights reserved.
Figures


Similar articles
-
Investigating the effects of fluid shear forces on cellular responses to profiled surfaces in-vitro: a computational and experimental investigation.Annu Int Conf IEEE Eng Med Biol Soc. 2007;2007:5387-90. doi: 10.1109/IEMBS.2007.4353560. Annu Int Conf IEEE Eng Med Biol Soc. 2007. PMID: 18003226
-
The imperative for controlled mechanical stresses in unraveling cellular mechanisms of mechanotransduction.Biomed Eng Online. 2006 May 3;5:27. doi: 10.1186/1475-925X-5-27. Biomed Eng Online. 2006. PMID: 16672051 Free PMC article.
-
An apparatus for studying the response of cultured endothelial cells to stresses.Australas Phys Eng Sci Med. 2006 Jun;29(2):196-202. doi: 10.1007/BF03178893. Australas Phys Eng Sci Med. 2006. PMID: 16845925
-
Macro- and microscale fluid flow systems for endothelial cell biology.Lab Chip. 2010 Jan 21;10(2):143-60. doi: 10.1039/b913390a. Epub 2009 Oct 9. Lab Chip. 2010. PMID: 20066241 Review.
-
Mechanotransduction of bone cells in vitro: mechanobiology of bone tissue.Med Biol Eng Comput. 2004 Jan;42(1):14-21. doi: 10.1007/BF02351006. Med Biol Eng Comput. 2004. PMID: 14977218 Review.
Cited by
-
β-glycerophosphate, not low magnitude fluid shear stress, increases osteocytogenesis in the osteoblast-to-osteocyte cell line IDG-SW3.Connect Tissue Res. 2024 Jul;65(4):313-329. doi: 10.1080/03008207.2024.2375065. Epub 2024 Jul 10. Connect Tissue Res. 2024. PMID: 38982804 Free PMC article.
-
Feline Adipose Derived Multipotent Stromal Cell Transdifferentiation Into Functional Insulin Producing Cell Clusters.Front Bioeng Biotechnol. 2022 Jun 8;10:904519. doi: 10.3389/fbioe.2022.904519. eCollection 2022. Front Bioeng Biotechnol. 2022. PMID: 35769100 Free PMC article.
-
In Vitro Bone Cell Models: Impact of Fluid Shear Stress on Bone Formation.Front Bioeng Biotechnol. 2016 Nov 15;4:87. doi: 10.3389/fbioe.2016.00087. eCollection 2016. Front Bioeng Biotechnol. 2016. PMID: 27896266 Free PMC article. Review.
-
3D-printed temperature and shear stress-controlled rocker platform for enhanced biofilm incubation.Sci Rep. 2025 Jun 4;15(1):19575. doi: 10.1038/s41598-025-04575-3. Sci Rep. 2025. PMID: 40467684 Free PMC article.
-
Preclinical models for in vitro mechanical loading of bone-derived cells.Bonekey Rep. 2015 Aug 19;4:728. doi: 10.1038/bonekey.2015.97. eCollection 2015. Bonekey Rep. 2015. PMID: 26331007 Free PMC article.
References
-
- Wang N, Butler JP, Ingber DE. 1993. Mechanotransduction across the cell surface and through the cytoskeleton. Science 260, 1124. - PubMed
-
- Fung Y, Cowin S. 1994. Biomechanics: mechanical properties of living tissues. J. Appl. Mech. 61, 1007 (10.1115/1.2901550) - DOI
-
- Turner C, Forwood M, Otter M. 1994. Mechanotransduction in bone: do bone cells act as sensors of fluid flow? FASEB J. 8, 875. - PubMed
Publication types
MeSH terms
LinkOut - more resources
Full Text Sources
Other Literature Sources

