. 2014 Jun 5:13:143.
doi: 10.1186/1476-4598-13-143.

Trastuzumab emtansine is active on HER-2 overexpressing NSCLC cell lines and overcomes gefitinib resistance

Affiliations

Trastuzumab emtansine is active on HER-2 overexpressing NSCLC cell lines and overcomes gefitinib resistance

Daniele Cretella et al. Mol Cancer. .

Abstract

Background: HER-2 represents a relatively new therapeutic target for non small cell lung cancer (NSCLC) patients. The incidence for reported HER-2 overexpression/amplification/mutations ranges from 2 to 20% in NSCLC. Moreover, HER-2 amplification is a potential mechanism of resistance to tyrosine kinase inhibitors of the epidermal growth factor receptor (EGFR-TKI) (about 10% of cases). T-DM1, trastuzumab emtansine is an antibody-drug conjugate composed by the monoclonal antibody trastuzumab and the microtubule polymerization inhibitor DM1. The activity of T-DM1 has been studied in breast cancer but the role of T-DM1 in lung cancer remains unexplored.

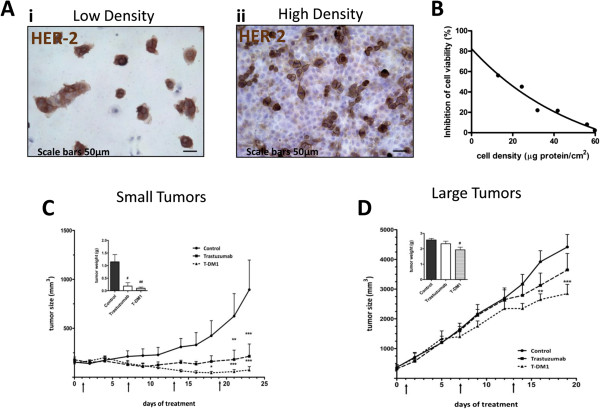
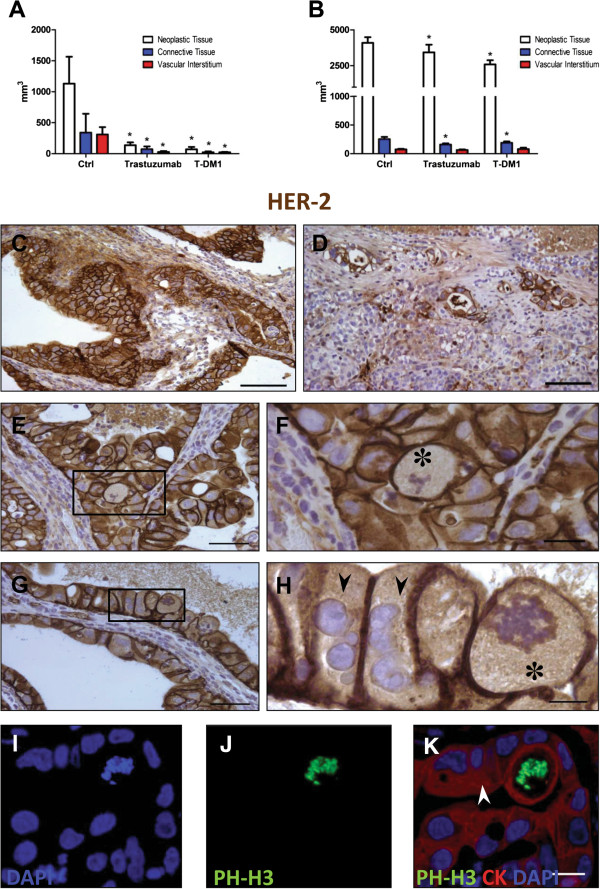
Methods: Antiproliferative and proapoptotic effects of T-DM1 have been investigated in different NSCLC cell lines by MTT, crystal violet staining, morphological study and Western blotting. HER-2 expression and cell cycle were evaluated by flow cytometry and Western blotting. Antibody dependent cell cytotoxicity (ADCC) was measured with a CytoTox assay. Xenografted mice model has been generated using a NSCLC cell line to evaluate the effect of T-DM1 on tumor growth. Moreover, a morphometric and immunohistochemical analysis of tumor xenografts was conducted.

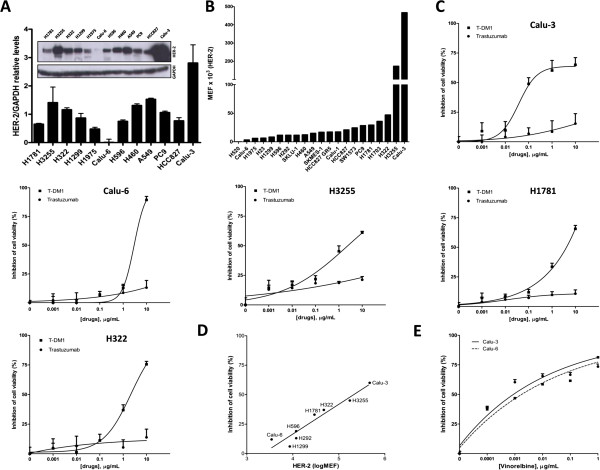
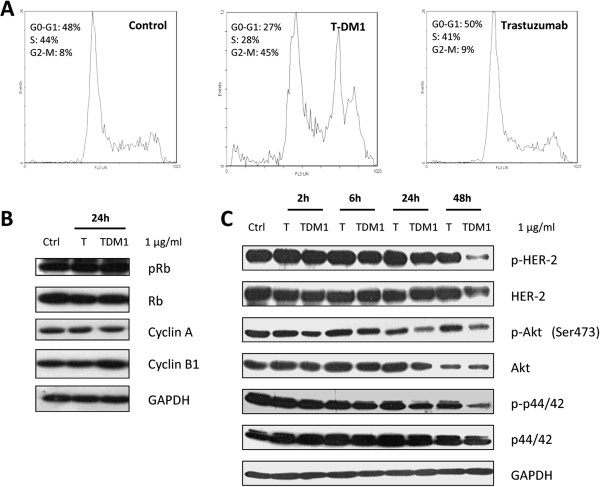
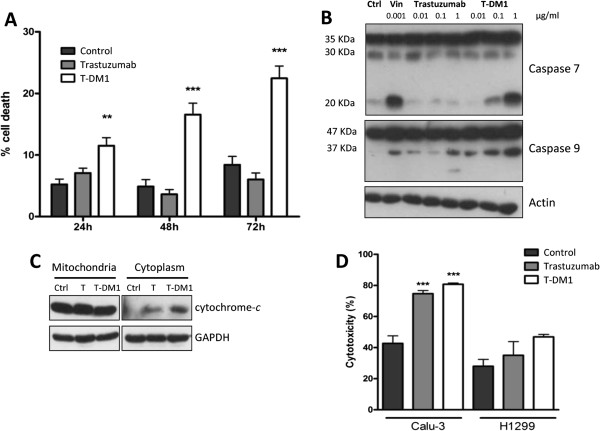
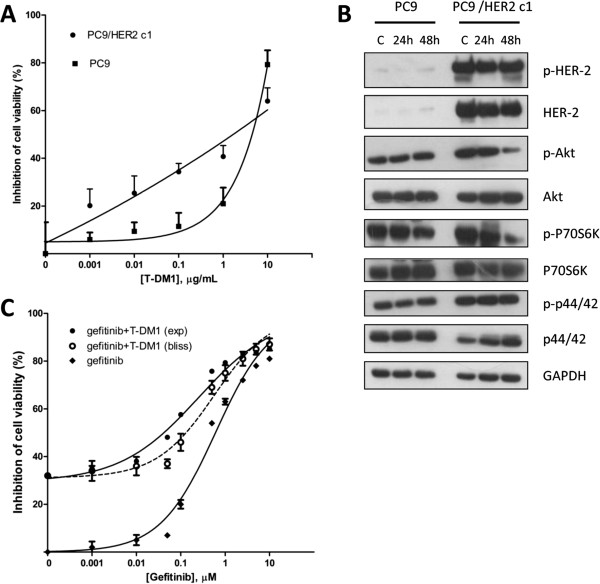
Results: In this study we investigated the effect of T-DM1 in a panel of NSCLC cell lines with different HER-2 expression levels, in H1781 cell line carrying HER-2 mutation and in gefitinib resistant HER-2 overexpressing PC9/HER2cl1 cell clone. T-DM1 efficiently inhibited proliferation with arrest in G2-M phase and induced cell death by apoptosis in cells with a significant level of surface expression of HER-2. Antibody-dependent cytotoxicity assay documented that T-DM1 maintained the same activity of trastuzumab. Our data also suggest that targeting HER-2 with T-DM1 potentially overcomes gefitinib resistance. In addition a correlation between cell density/tumor size with both HER-2 expression and T-DM1 activity was established in vitro and in an in vivo xenograft model.

Conclusions: Our results indicate that targeting HER-2 with T-DM1 may offer a new therapeutic approach in HER-2 over-expressing lung cancers including those resistant to EGFR TKIs.


Figures

Figure 1
Figure 1
HER-2 levels and effects on cell viability of T-DM1, trastuzumab and vinorelbine in NSCLC cell lines. (A) Densitometric quantification of total HER-2 protein level, detected by Western blotting, was calculated using Quantity One software. Three different Western blot experiments were performed on total cell lysate of the indicated NSCLC cell lines. A representative Western blot analysis is reported as inset. (B) HER-2 protein levels on cell surface was quantified by flow-cytometry and expressed as molecular equivalent of fluorochrome (MEF) as described in Methods section. (C) Calu-3, Calu-6, H3255, H1781 and H322 cells were exposed to increasing concentrations (0.001, 0.01, 0.1, 1 and 10 μg/ml) for 72 h and then cell viability was assessed by MTT assay. (D) Percent of inhibition of cell viability induced by T-DM1 at 1 μg/ml as a function of HER-2 level (E) Calu-3 and Calu-6 cell viability inhibition curves after treatment with increasing vinorelbine concentrations. Data are expressed as mean + SD of three different experiments.
Figure 2
Figure 2
Influence of trastuzumab and T-DM1 on cell cycle phase distribution and cell signalling. (A) Calu-3 cells were cultured in the absence of drugs or treated either with T-DM1 or trastuzumab (1 μg/ml). After 24 h cells were stained with propidium iodide an cell-cycle-phase distribution was determined by flow cytometry analysis. Cell-cycle distributions were analyzed as described in Methods section and data were expressed as percentage of distribution in each cell-cycle phase. Immunoblot analysis on protein involved in cell cycle regulation (B) or signalling pathways (C) were conducted on cell lysates obtained after treatment with trastuzumab or T-DM1 (1 μg/ml) for the indicated period of time.
Figure 3
Figure 3
Effect of trastuzumab and T-DM1 on cell death and antibody dependent cell cytotoxicity. (A) Dead cells were counted after 24, 48 and 72 h of exposure to trastuzumab or T-DM1 (1 μg/ml) and the percentage of dead cells was calculated. (**p < 0.01, ***p < 0.001 versus control, one-way ANOVA followed by Tukey’s post-test). (B) Caspases 7 and 9 activation were detected by immunoblotting on cell lysates obtained after 48 h of Calu-3 exposure to increasing concentration of trastuzumab or T-DM1. Vinorelbine 0.001 μg/ml was used as positive control. (C) Cytochrome c was detected in the cytoplasm by immunoblotting after 48 h of treatment with T-DM1 1 μg/ml as described in Methods section. (D) Trastuzumab (1 μg/ml) or T-DM1 (1 μg/ml) were added to Calu-3 and H1299 cells seeded with 100 U/ml IL-2 activated-NK cells, at the ratio of 1:50. After 4 h lactate dehydrogenase release was quantified as described in Methods section and data expressed as percentage of cytotoxicity. The results are from representative experiments. The experiment, repeated three times, yielded similar results (***P < 0.001, one-way ANOVA followed by Tukey’s post-test).
Figure 4
Figure 4
Effect of T-DM1 on EGFR-mutant PC9 cell line become resistant to gefitinib for HER-2 overexpression. (A) PC9 and PC9/HER2 c1 cells were exposed to increasing concentrations of T-DM1 for 72 h and then cell viability was assessed by MTT assay. Data are expressed as mean + SD of three different experiments. (B) Immunoblot analysis of proteins of signalling transduction pathways were conducted on cell lysates obtained after treatment with T-DM1 (1 μg/ml) for 24 or 48 h. (C) Curves of growth inhibitory effects of gefitinib and combined treatment gefitinib plus T-DM1 versus theoretical Bliss additivity curve are reported. Cells were treated with the drugs for 72 h and then cell number was assessed by MTT assy. Data are expressed as percent inhibition of cell proliferation versus control cells. The experiments, repeated three times, yielded similar results.
Figure 5
Figure 5
Cell density in vitro and tumor size in vivo influenced HER-2 expression and efficacy of T-DM1. (A) Calu-3 cells were plated at low (104cells/cm2) (i) and high (8x10⁴cells/cm2) (ii) density and after 24 h membrane HER-2 protein expression was evaluated by immunohistochemistry. (B) Calu-3 cells were plated at different density and exposed for 72 h to T-DM1 1 μg/ml and then cell number was assessed using crystal violet staining as described in Methods section. Percent inhibition of cell proliferation versus control cells was plotted as function of cell density. The experiments, repeated three times, yielded similar results. 4 × 106(C) or 8 × 106(D) Calu-3 cells were subcutaneously implanted on BALB/c-Nude mice. At the beginning of the treatments average tumor volumes were 161 ± 15 mm3 and 370 ± 50 mm3 respectively. In both settings vehicle, trastuzumab (15 mg/Kg i.p.) or T-DM1 (15 mg/Kg i.v.) were administered every six days as pointed (arrows). Tumor sizes were measured three times per week and data expressed as volume + SEM (n = 6 mice per group). (**p < 0.01, ***p < 0.001 vs control; two-way ANOVA followed by Bonferroni’s post-test). After sacrifice tumors were excised and weighted (# p < 0.05 ##p < 0.01; one-way Anova followed by Tukey’s post-test).
Figure 6
Figure 6
Neoplastic tissue composition and HER-2 expression in small and large tumors. Quantification of tissue composition in small (A) and large (B) tumour xenografts in untreated (CTRL) and Trastuzumab or T-DM1 treated mice (*p < 0.05, vs control) was evaluated as described in Methods Section. C-H: Immunoperoxidase staining of xenografts by anti-HER-2 antibodies. The sharp difference in HER-2 expression (brownish) by neoplastic cells composing small (C) and large (D) tumours is apparent. E and G illustrate sections of small T-DM1 treated tumour xenografts in which black rectangles include a microscopic field shown at higher magnification in F and H, respectively, to document giant mitotic figures (✽) on HER-2 labeled cells. Arrows indicate polynucleated HER-2 positive neoplastic cells. The lower panels show the specific immunofluorescent labeling of metaphase chromosomes (I) by phospho-Histone H3 (PH-H3, green, J) on a large cytokeratin (CK, red, K) positive cell. Arrow points to a giant polynucleated neoplastic cell. Scale bars: C, D = 100 μm; E, G = 50 μm; F, I, L, M = 20 μm and H = 10 μm.

References

    1. Oxnard GR, Lo PC, Nishino M, Dahlberg SE, Lindeman NI, Butaney M, Jackman DM, Johnson BE, Janne PA. Natural history and molecular characteristics of lung cancers harboring EGFR exon 20 insertions. J Thorac Oncol. 2013;8:179–184. doi: 10.1097/JTO.0b013e3182779d18. - DOI - PMC - PubMed
    1. Mok TS, Wu YL, Thongprasert S, Yang CH, Chu DT, Saijo N, Sunpaweravong P, Han B, Margono B, Ichinose Y, Nishiwaki Y, Ohe Y, Yang JJ, Chewaskulyong B, Jiang H, Duffield EL, Watkins CL, Armour AA, Fukuoka M. Gefitinib or carboplatin-paclitaxel in pulmonary adenocarcinoma. N Engl J Med. 2009;361:947–957. doi: 10.1056/NEJMoa0810699. - DOI - PubMed
    1. Rosell R, Carcereny E, Gervais R, Vergnenegre A, Massuti B, Felip E, Palmero R, Garcia-Gomez R, Pallares C, Sanchez JM, Porta R, Cobo M, Garrido P, Longo F, Moran T, Insa A, De Marinis F, Corre R, Bover I, Illiano A, Dansin E, de Castro J, Milella M, Reguart N, Altavilla G, Jimenez U, Provencio M, Moreno MA, Terrasa J, Muñoz-Langa J. Erlotinib versus standard chemotherapy as first-line treatment for European patients with advanced EGFR mutation-positive non-small-cell lung cancer (EURTAC): a multicentre, open-label, randomised phase 3 trial. Lancet Oncol. 2012;13:239–246. doi: 10.1016/S1470-2045(11)70393-X. - DOI - PubMed
    1. Sequist LV, Yang JC, Yamamoto N, O’Byrne K, Hirsh V, Mok T, Geater SL, Orlov S, Tsai CM, Boyer M, Su WC, Bennouna J, Kato T, Gorbunova V, Lee KH, Shah R, Massey D, Zazulina V, Shahidi M, Schuler M. Phase III study of afatinib or cisplatin plus pemetrexed in patients with metastatic lung adenocarcinoma with EGFR mutations. J Clin Oncol. 2013;31:3327–3334. doi: 10.1200/JCO.2012.44.2806. - DOI - PubMed
    1. Shaw AT, Kim DW, Nakagawa K, Seto T, Crino L, Ahn MJ, De Pas T, Besse B, Solomon BJ, Blackhall F, Wu YL, Thomas M, O'Byrne KJ, Moro-Sibilot D, Camidge DR, Mok T, Hirsh V, Riely GJ, Iyer S, Tassell V, Polli A, Wilner KD, Jänne PA. Crizotinib versus chemotherapy in advanced ALK-positive lung cancer. N Engl J Med. 2013;368:2385–2394. doi: 10.1056/NEJMoa1214886. - DOI - PubMed

Publication types

MeSH terms