. 2014 Aug;3(4):865-77.
doi: 10.1002/cam4.265. Epub 2014 Jun 4.

The impact of dietary isoflavonoids on malignant brain tumors

Affiliations

The impact of dietary isoflavonoids on malignant brain tumors

Tina Sehm et al. Cancer Med. 2014 Aug.

Abstract

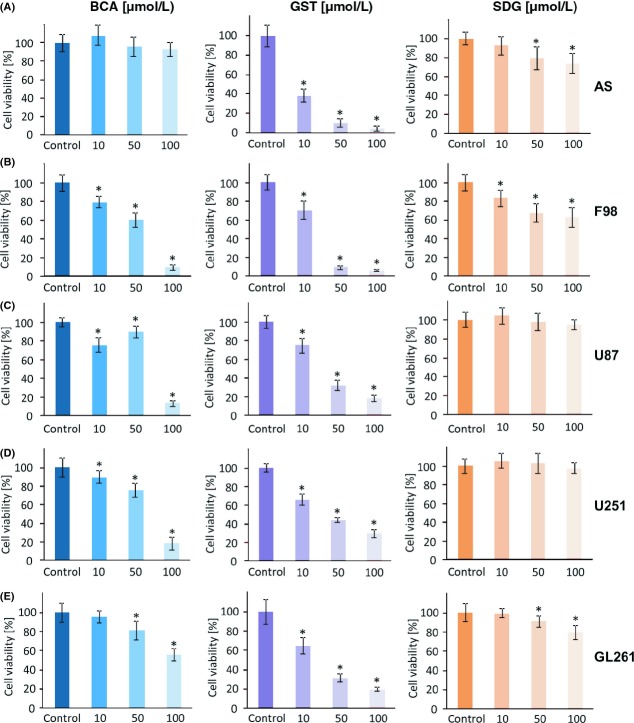
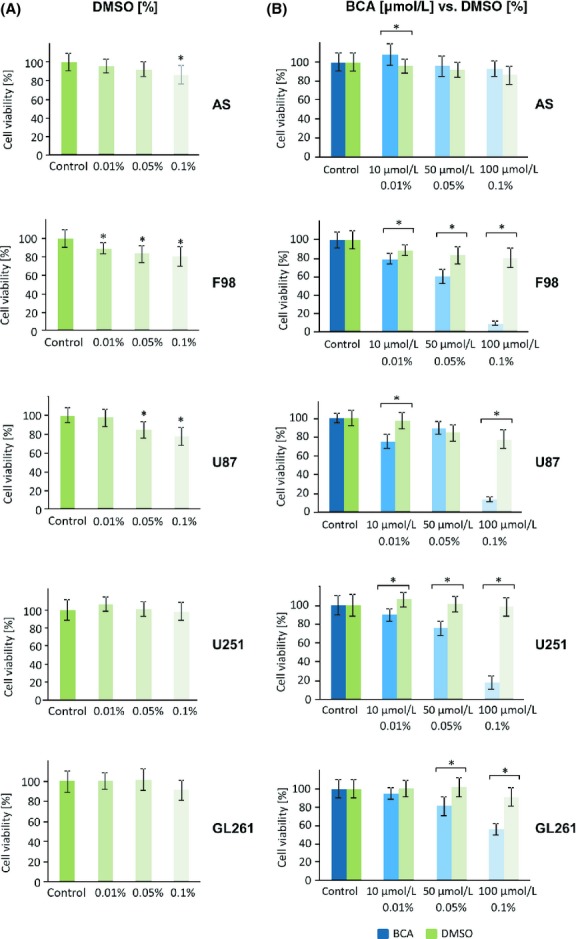
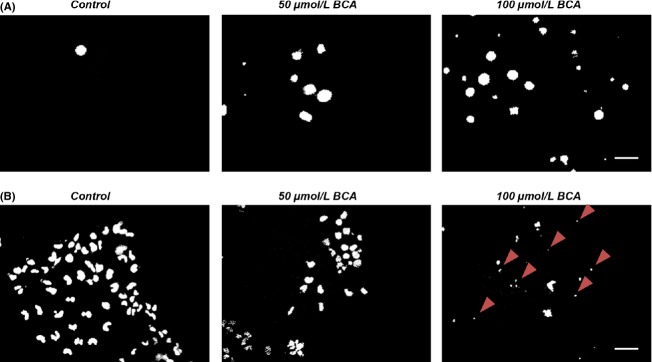
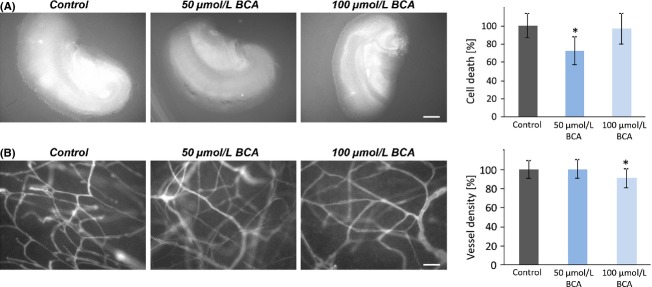
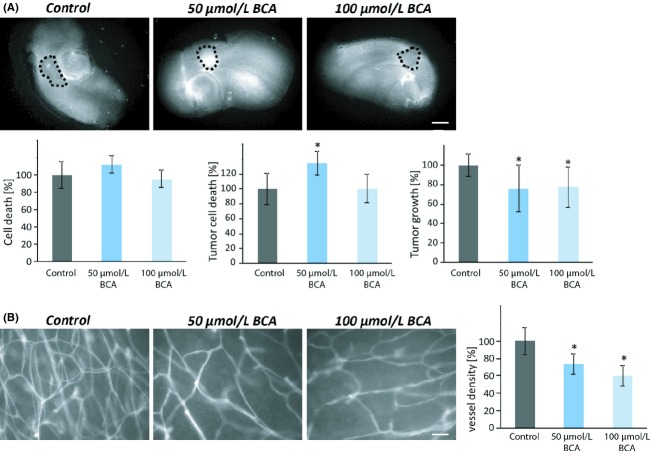
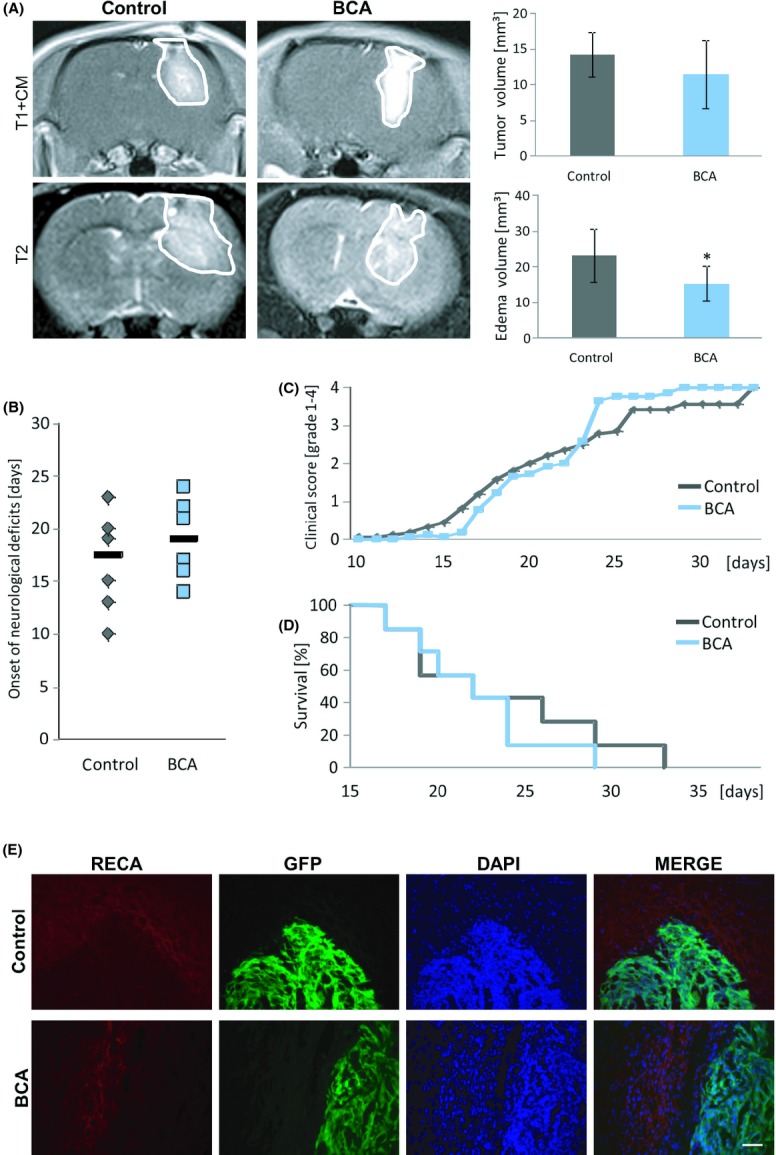
Poor prognosis and limited therapeutic options render malignant brain tumors one of the most devastating diseases in clinical medicine. Current treatment strategies attempt to expand the therapeutic repertoire through the use of multimodal treatment regimens. It is here that dietary fibers have been recently recognized as a supportive natural therapy in augmenting the body's response to tumor growth. Here, we investigated the impact of isoflavonoids on primary brain tumor cells. First, we treated glioma cell lines and primary astrocytes with various isoflavonoids and phytoestrogens. Cell viability in a dose-dependent manner was measured for biochanin A (BCA), genistein (GST), and secoisolariciresinol diglucoside (SDG). Dose-response action for the different isoflavonoids showed that BCA is highly effective on glioma cells and nontoxic for normal differentiated brain tissues. We further investigated BCA in ex vivo and in vivo experimentations. Organotypic brain slice cultures were performed and treated with BCA. For in vivo experiments, BCA was intraperitoneal injected in tumor-implanted Fisher rats. Tumor size and edema were measured and quantified by magnetic resonance imaging (MRI) scans. In vascular organotypic glioma brain slice cultures (VOGIM) we found that BCA operates antiangiogenic and neuroprotective. In vivo MRI scans demonstrated that administered BCA as a monotherapy was effective in reducing significantly tumor-induced brain edema and showed a trend for prolonged survival. Our results revealed that dietary isoflavonoids, in particular BCA, execute toxicity toward glioma cells, antiangiogenic, and coevally neuroprotective properties, and therefore augment the range of state-of-the-art multimodal treatment approach.

Keywords: Angiogenesis; experimental therapeutics; microenvironment; nutrition.


Figures

Figure 1
Figure 1
Isoflavonoids impede astrocytes and malignant glioma cell growth with differential efficiency. (A) Primary rodent astrocytes (AS) were treated with various concentrations of biochanin A (BCA), genistein (GST), and secoisolariciresinol diglucoside (SDG) and cell survival was monitored. BCA is nontoxic for primary astrocytes even at high concentrations. GST induces astrocyte cell death at low concentration. SDG is toxic to astrocytes from 50 μmol/L onward. (B) Rodent malignant gliomas (F98) were treated with various concentrations of BCA, GST, and SDG and glioma cell survival was monitored. All three isoflavonoids are toxic already at low concentrations. (C, D) Human malignant gliomas (C, U87; D, U251) were treated with various concentrations of BCA, GST, and SDG and glioma cell survival was monitored. Note that SDG does not affect human glioma growth. BCA and GST causes cell death. (E) Murine malignant gliomas (GL261) were treated with various concentrations of BCA, GST, and SDG and glioma cell viability was measured. Differences were considered statistically significant with values mean ± SD (n ≥ 3 per group; unpaired two-sided t-test, P < 0.05).
Figure 2
Figure 2
Comparative analysis of the solvent dimethylsulfoxide (DMSO) and BCA on malignant glioma cell growth. (A) Primary rodent astrocytes (AS), rodent glioma cells (F98), human glioma cells (U87, U251), and murine glioma cells (GL261) were treated with various concentrations of the solvent DMSO and cell survival was monitored. Note that a high concentration of DMSO at 0.1% (vol/vol) reduces cell growth in some cells. (B) BCA (blue bars) DMSO (green bars) solvent-matched analysis. The facilitated BCA concentration is given and compared to the respective final DMSO concentration. Differences were considered statistically significant with values mean ± SD (n ≥ 3 per group; unpaired two-sided t-test, P < 0.05).
Figure 3
Figure 3
Biochanin A induces apoptosis in human glioma cells. (A) Human glioma (U251) cell death after BCA treatment was monitored in vivo by propidium iodide (PI). Dead cells take up the PI dye and appear as white-stained nuclei. Scale bar represents 100 μm. (B) Apoptosis of human gliomas (U251) monitored by HOECHST dye. Fragmented nuclei are accumulating after BCA treatment (arrow heads). Scale bar represents 50 μm.
Figure 4
Figure 4
Biochanin A is neuro- and vasculoprotective in organotypic brain environment. (A) BCA treatment showed neuronal protective effects in rat native brain slices. After 5 days culture, cell death was evaluated (propidium iodide). A quantity of 50 μmol/L BCA showed a significant decrease in cell death. Scale bar represents 1 mm. Differences were considered statistically significant with values mean ± SD (*P < 0.01, unpaired two-sided t-test, n ≥ 14 per group). (B) Vessel density was significantly reduced at 100 μmol/L BCA treatment. Scale bar represents 50 μm. Differences were considered statistically significant with values mean ± SD (*P < 0.01, unpaired two-sided t-test, n ≥ 10 per group).
Figure 5
Figure 5
Biochanin A alleviates tumor growth and protects neurons in an organotypic brain environment. (A) 50 μmol/L BCA treatment induces tumor cells death in glioma-implanted brain slices. The dashed circle marks the tumor from the normal tissue. The normal tissue shows no cell death in the BCA-treated groups. F98 GFP expressing glioma cells were implanted in brain slices and after 8 days, cell death was evaluated. BCA reduces tumor growth. Differences were considered statistically significant with values mean ± SD (*P < 0.05, unpaired two-sided t-test, n ≥ 20). Scale bar represents 1 mm. (B) After 10 days in culture, tumor-implanted slices were fixed and stained for laminin. Vessel density in peritumoral area was obviously reduced after BCA treatment. Differences were considered statistically significant with values mean ± SD (*P < 0.01, unpaired two-sided t-test, n ≥ 10 per group). Scale bar represents 50 μm.
Figure 6
Figure 6
Biochanin A reduces brain tumor-induced edema and alleviates clinical deterioration in vivo. (A) Representative MR images 9 days after tumor implantation in male Fisher rats of control and BCA-treated gliomas. The tumor bulk (marked with continuous white line) was visualized after application of intraperitoneal contrast agent and subsequent T1-weighted imaging (T1 + CM) and corresponding T2-weighted images of brains from control and BCA-treated gliomas. The marked area indicates total tumor volume (including peritumoral and edema zone). Tumor volume was quantified from T1-weighted MR images. The edema zone was quantified by T2- and T1-weighted MR images. Tumor volume in the BCA-treated rats tends to be smaller in comparison to the control group. The edema zone is significantly smaller in the BCA-treated group compared to the control group. (B) Animals were clinically assessed on a daily basis according to their neurological status (grade 0: normal; grade 1: tail weakness or tail paralysis; grade 2: hind leg paraparesis or hemiparesis; grade 3: hind leg paralysis or hemiparalysis; grade 4: complete paralysis (tetraplegia), moribund stage or death). Therefore, the onsets of neurological symptoms were measured. Animals with BCA treatment tends to develop later neurological deficits compared to control animals. (C) Clinical progression of neurological deficits of the BCA-treated group and the control group. BCA group tends to have less neurological deficits in the first 20 days after tumor implantation. (D) Kaplan–Meier survival curves of BCA-treated animals and the control animals. Statistical significance was calculated with Student's t-test (n = 7 for the BCA group; n = 8 for the control group). (E) Representative brain images of BCA-treated rats and control group both groups bearing GFP-expressing F98 glioma cells (green) stained with the vascular endothelial cell marker RECA (red). Scale bar represents 50 μm.

Similar articles

Cited by

References

    1. Dolecek TA, Propp JM, Stroup NE. Kruchko C. CBTRUS statistical report: primary brain and central nervous system tumors diagnosed in the United States in 2005–2009. Neuro Oncol. 2012;14(Suppl. 5):v1–v49. - PMC - PubMed
    1. Kohler BA, Ward E, McCarthy BJ, Schymura MJ, Ries LA. Eheman C, et al. Annual report to the nation on the status of cancer, 1975-2007, featuring tumors of the brain and other nervous system. J. Natl. Cancer Inst. 2011;103:714–736. - PMC - PubMed
    1. Siegel R, Naishadham D. Jemal A. Cancer statistics, 2012. CA Cancer J. Clin. 2012;62:10–29. - PubMed
    1. Dunn GP, Rinne ML, Wykosky J, Genovese G, Quayle SN, Dunn IF, et al. Emerging insights into the molecular and cellular basis of glioblastoma. Genes Dev. 2012;26:756–784. - PMC - PubMed
    1. Shah U. Morrison T. A review of the symptomatic management of malignant gliomas in adults. J. Natl. Compr. Canc. Netw. 2013;11:424–429. - PubMed

Publication types

MeSH terms