

Deformability analysis of sickle blood using ektacytometry
- PMID: 24898336
- PMCID: PMC4469365
- DOI: 10.3233/BIR-140660
Deformability analysis of sickle blood using ektacytometry
Abstract
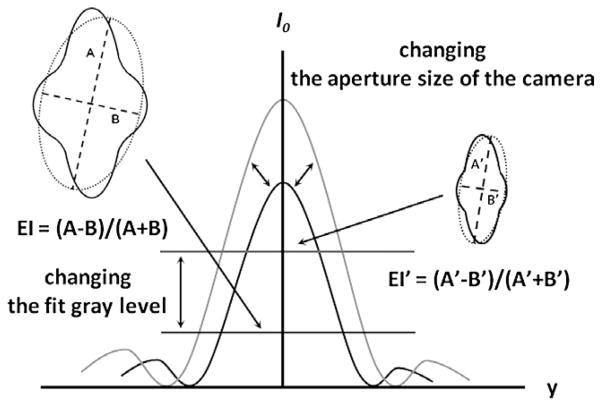
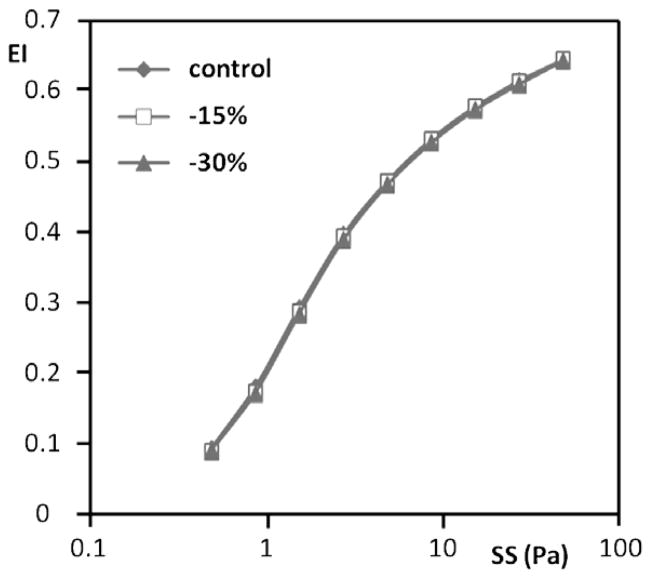
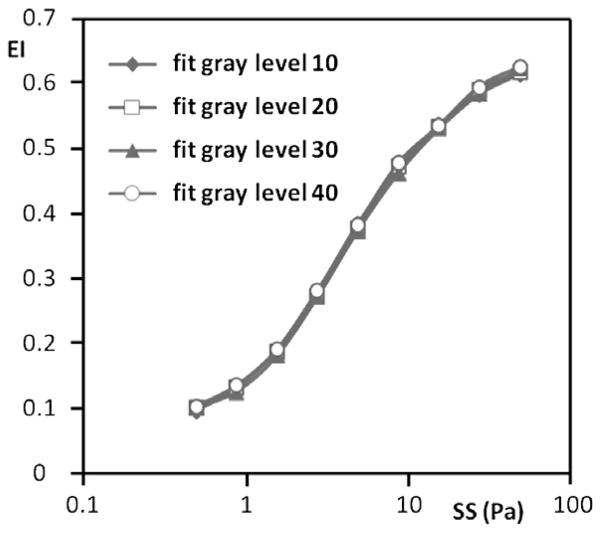
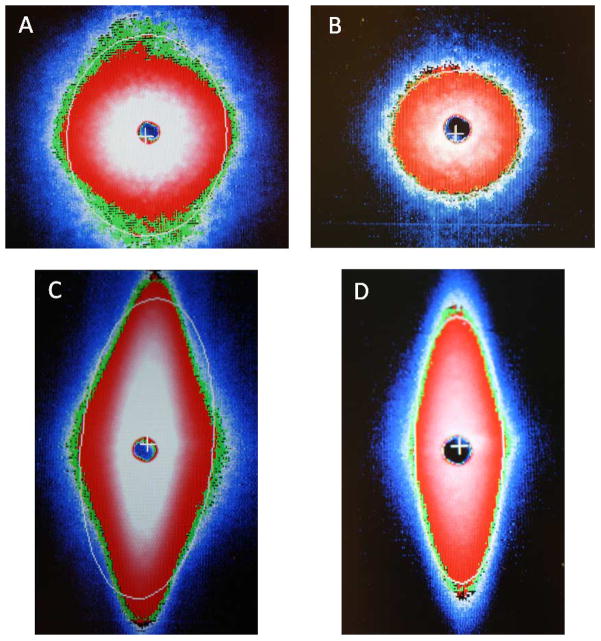
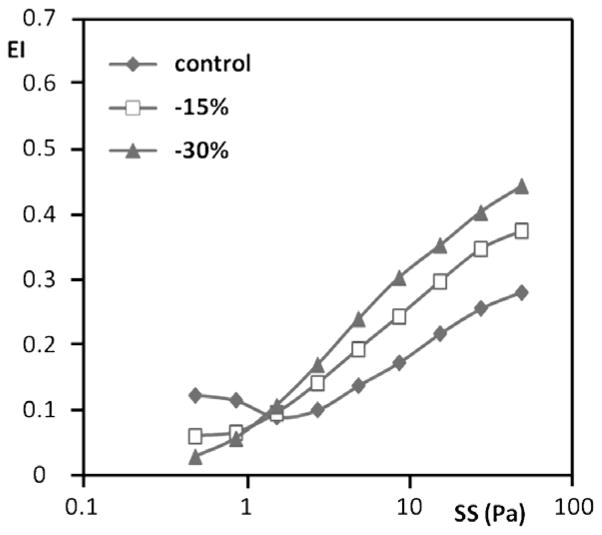
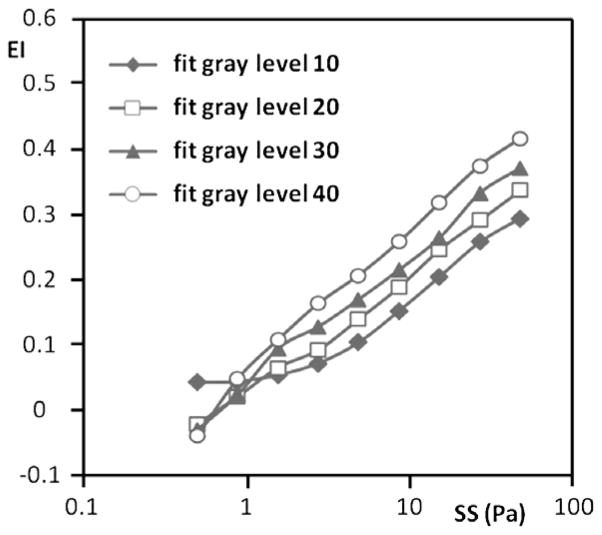
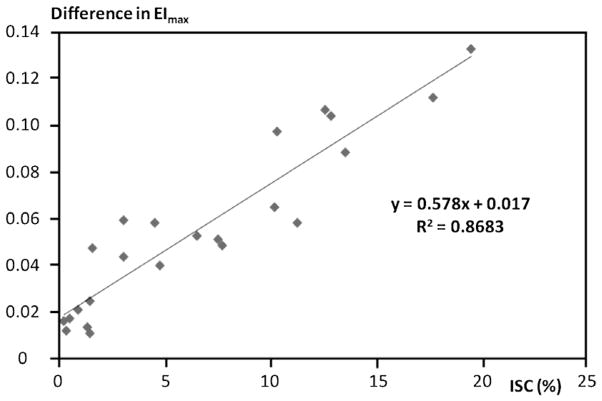
Sickle cell disease (SCD) is characterized by decreased erythrocyte deformability, microvessel occlusion and severe painful infarctions of different organs. Ektacytometry of SCD red blood cells (RBC) is made difficult by the presence of rigid, poorly-deformable irreversibly sickled cells (ISC) that do not align with the fluid shear field and distort the elliptical diffraction pattern seen with normal RBC. In operation, the computer software fits an outline to the diffraction pattern, then reports an elongation index (EI) at each shear stress based on the length and width of the fitted ellipse: EI=(length-width)/(length+width). Using a commercial ektacytometer (LORCA, Mechatronics Instruments, The Netherlands) we have approached the problem of ellipse fitting in two ways: (1) altering the height of the diffraction image on a computer monitor using an aperture within the camera lens; (2) altering the light intensity level (gray level) used by the software to fit the image to an elliptical shape. Neither of these methods affected deformability results (elongation index-shear stress relations) for normal RBC but did markedly affect results for SCD erythrocytes: (1) decreasing image height by 15% and 30% increased EI at moderate to high stresses; (2) progressively increasing the light level increased EI over a wide range of stresses. Fitting data obtained at different image heights using the Lineweaver-Burke routine yielded percentage ISC results in good agreement with microscopic cell counting. We suggest that these two relatively simple approaches allow minimizing artifacts due to the presence of rigid discs or ISC and also suggest the need for additional studies to evaluate the physiological relevance of deformability data obtained via these methods.
Keywords: Laser diffraction ellipsometry; diffraction pattern; irreversible sickled cells; sickle cell disease; sickle erythrocytes.
Conflict of interest statement
All authors have seen and agreed with the content of the manuscript and there is no financial interest to report.
Figures
References
-
- Bartolucci P, Brugnara C, Teixeira-Pinto A, Pissard S, Moradkhani K, Jouault H, et al. Erythrocyte density in sickle cell syndromes is associated with specific clinical manifestations and hemolysis. Blood. 2012;120:3136–3141. - PubMed
-
- Baskurt OK. In vivo correlates of altered blood rheology. Biorheol. 2008;45:629–638. - PubMed
-
- Baskurt OK, Farley RA, Meiselman HJ. Erythrocyte aggregation tendency and cellular properties in horse, human, and rat: a comparative study. Am J Physiol. 1997;273:H2604–H2612. - PubMed
-
- Baskurt OK, Hardeman MR, Uyuklu M, Ulker P, Cengiz M, Nemeth N, et al. Comparison of three commercially available ektacytometers with different shearing geometries. Biorheol. 2009;46:251–264. - PubMed
-
- Baskurt OK, Meiselman HJ. Susceptibility of equine erythrocytes to oxidant-induced rheologic alterations. Am J Vet Res. 1999;60:1301–1306. - PubMed
Publication types
MeSH terms
Grants and funding
LinkOut - more resources
Full Text Sources
Other Literature Sources
Medical
