. 2014 Jun 5:4:5194.
doi: 10.1038/srep05194.

Bax inhibitor-1-mediated inhibition of mitochondrial Ca2+ intake regulates mitochondrial permeability transition pore opening and cell death

Affiliations

Bax inhibitor-1-mediated inhibition of mitochondrial Ca2+ intake regulates mitochondrial permeability transition pore opening and cell death

Geum-Hwa Lee et al. Sci Rep. .

Abstract

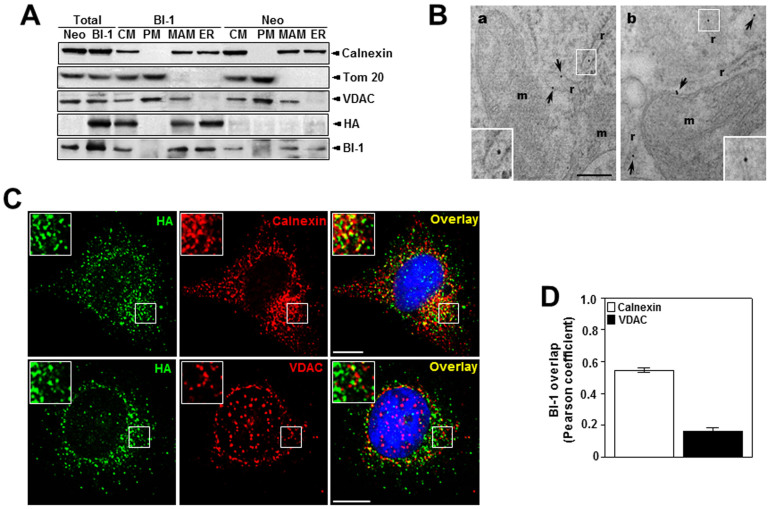
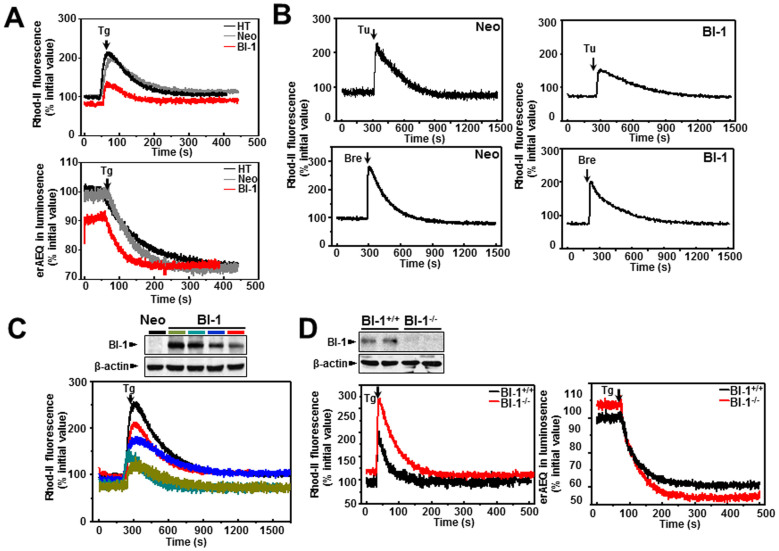
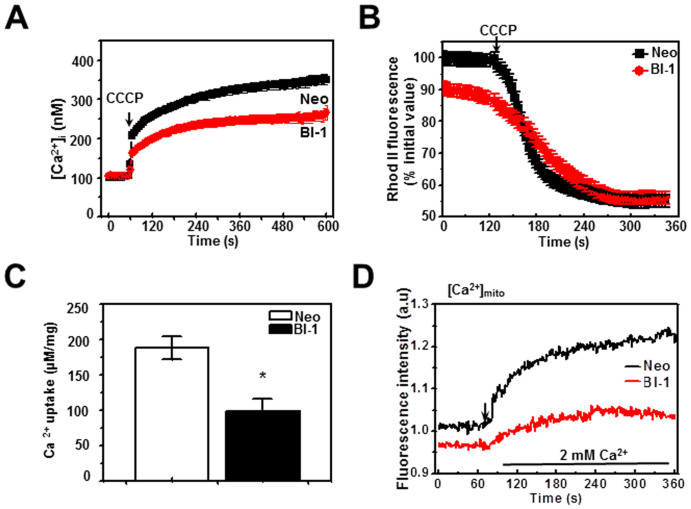
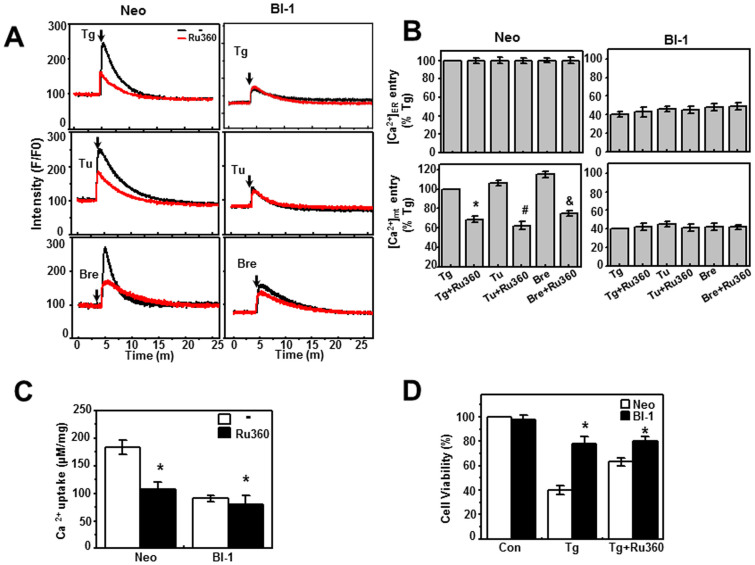
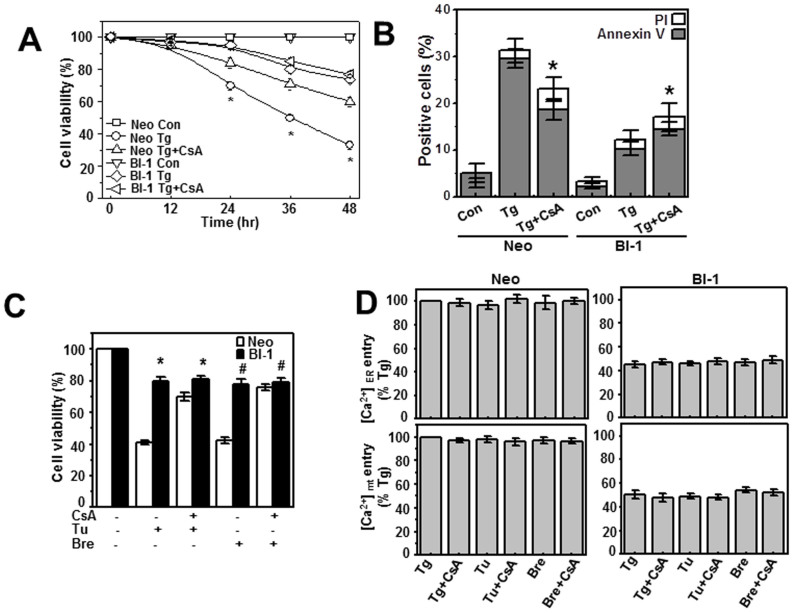
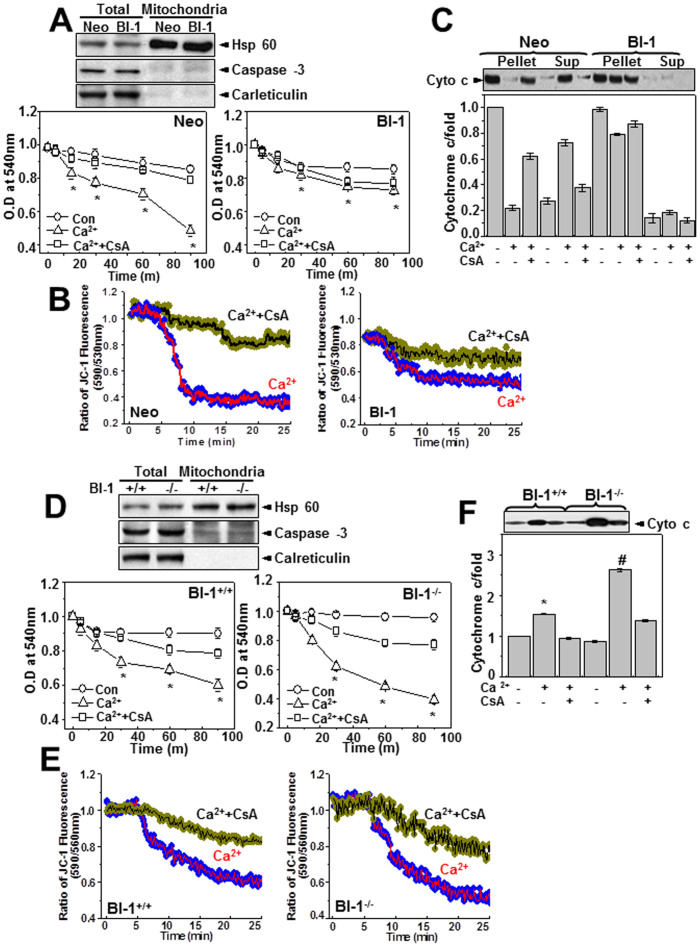
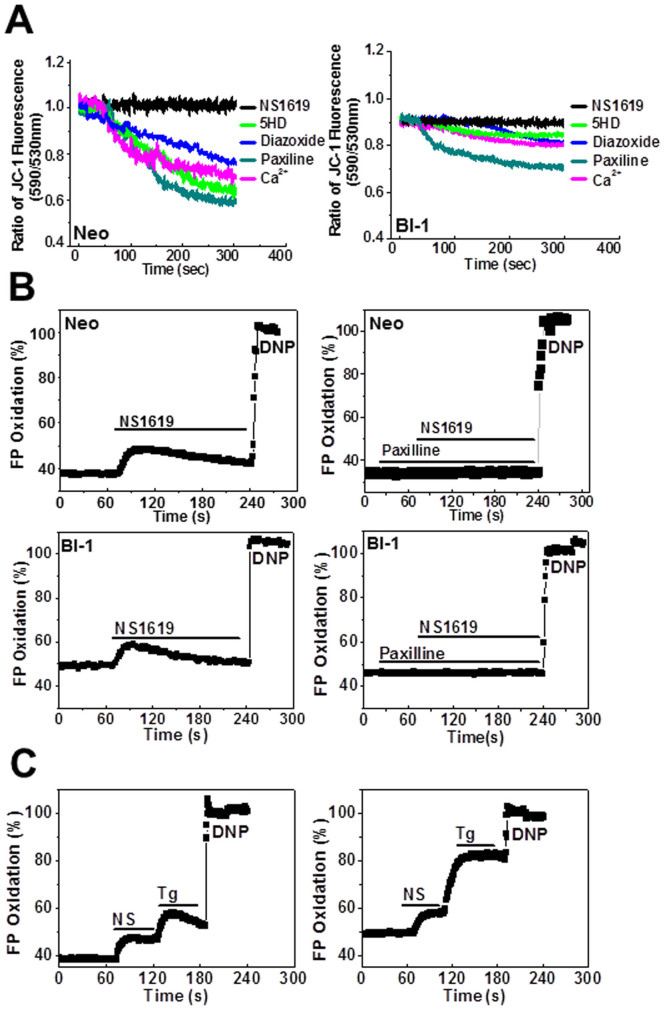
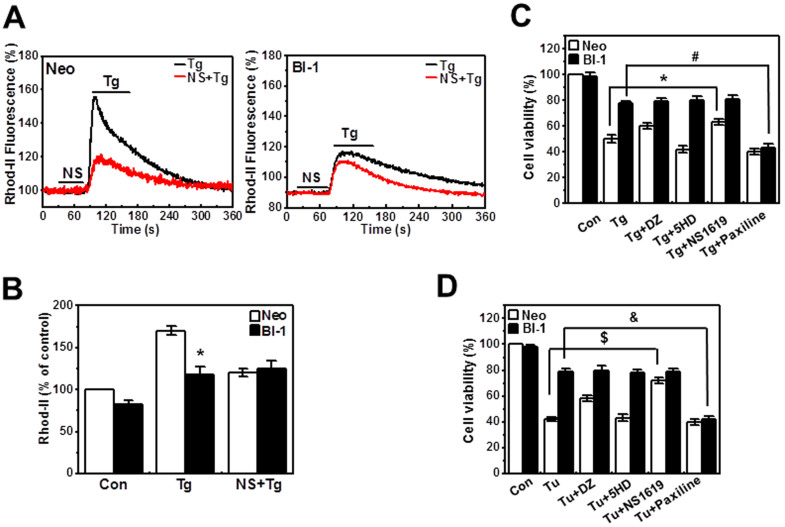
A recently studied endoplasmic reticulum (ER) stress regulator, Bax inhibitor-1 (BI-1) plays a regulatory role in mitochondrial Ca(2+) levels. In this study, we identified ER-resident and mitochondria-associated ER membrane (MAM)-resident populations of BI-1. ER stress increased mitochondrial Ca(2+) to a lesser extent in BI-1-overexpressing cells (HT1080/BI-1) than in control cells, most likely as a result of impaired mitochondrial Ca(2+) intake ability and lower basal levels of intra-ER Ca(2+). Moreover, opening of the Ca(2+)-induced mitochondrial permeability transition pore (PTP) and cytochrome c release were regulated by BI-1. In HT1080/BI-1, the basal mitochondrial membrane potential was low and also resistant to Ca(2+) compared with control cells. The activity of the mitochondrial membrane potential-dependent mitochondrial Ca(2+) intake pore, the Ca(2+) uniporter, was reduced in the presence of BI-1. This study also showed that instead of Ca(2+), other cations including K(+) enter the mitochondria of HT1080/BI-1 through mitochondrial Ca(2+)-dependent ion channels, providing a possible mechanism by which mitochondrial Ca(2+) intake is reduced, leading to cell protection. We propose a model in which BI-1-mediated sequential regulation of the mitochondrial Ca(2+) uniporter and Ca(2+)-dependent K(+) channel opening inhibits mitochondrial Ca(2+) intake, thereby inhibiting PTP function and leading to cell protection.


Figures

Figure 1
Figure 1. BI-1 localizes to mitochondria and the ER.
(A) After subcellular fractionation of HT1080/BI-1cell lysates, immunoblotting was performed with antibodies against calnexin, Tom20, VDAC, HA, and BI-1. (B) Electron microscopy analysis of BI-1 localization. Immunogold labeling of HA-BI-1 was performed as described in Materials and Methods. The right panel shows anti-rat HA antibody and the left panel shows anti-mouse HA antibody. Arrows indicate BI-1-positive ER or MAM regions. (C) Confocal laser scanning microscope images of HT1080/BI-1. HT1080/BI-1 cells were fixed, permeabilized, and immunostained with anti-HA, anti-calnexin (upper panel), or anti-VDAC (lower panel) antibodies prior to imaging on a confocal laser scanning microscope. (D) Quantification of BI-1–calnexin and BI-1–VDAC co-localization was performed. Cropped gels/blots were run under the same experimental conditions. M, mitochondria; ER, endoplasmic reticulum; CM, crude mitochondria; PM, pure mitochondria; MAM, mitochondria-associated membrane; Neo, neomycin-resistant pcDNA3-transfected HT1080 cells (HT1080/Neo); BI-1, HA-BI-1-pcDNA3-transfected HT1080 cells (HT1080/BI-1).
Figure 2
Figure 2. Low [Ca2+]ER leads to low [Ca2+]mito in HT1080/BI-1 cells.
(A) Mitochondrial and ER Ca2+ in parental HT1080, HT1080/Neo, and HT1080/BI-1 cells after treatment with 5 μM thapsigargin (arrow) was analyzed with Rhod II AM fluorescence (upper) and erAEQ luminescence (lower), respectively. (B) HT1080/Neo and HT1080/BI-1 were loaded with Rhod II AM and treated with either 5 μg/ml tunicamycin or 1 μg/ml brefeldin A (arrow). Rhod II fluorescence was monitored over time. (C) Immunoblotting of HT1080/Neo and HT1080 cells expressing different amounts of BI-1 with antibodies against BI-1 and β-actin (upper). Mitochondrial Ca2+ in HT1080/Neo and BI-1–expressing HT1080 cells upon treatment with 5 μM thapsigargin was analyzed by Rhod II AM fluorescence. Specific colors indicate cells expressing different amounts of BI-1. (D) Immunoblotting of BI-1+/+ and BI-1-/- MEF cells with antibodies against BI-1 and β-actin (upper). BI-1+/+ and BI-1-/- MEF cells were incubated with Rhod II AM to analyze mitochondrial accumulation of Ca2+ after treatment with 5 μM thapsigargin (arrow) (left). BI-1+/+ and BI-1-/- MEF cells were transfected with erAEQ. The intensity of erAEQ luminescence was monitored after treatment with 5 μM thapsigargin (arrow) (right). Results represent the mean ± SEM of five independent experiments. Tg, thapsigargin; Tu, tunicamycin; Bre, Brefeldin A; erAEQ, ER-localized aequorin; HT, parental HT1080 cells; Neo, neomycin-resistant pcDNA3-transfected HT1080 cells (HT1080/Neo); BI-1, HA-BI-1-pcDNA3-transfected HT1080 cells (HT1080/BI-1).
Figure 3
Figure 3. HT1080/BI-1 cells exhibit reduced levels of mitochondrial Ca2+ compared with control cells.
(A) HT1080/Neo and HT1080/BI-1 cells were loaded with Fura2-AM and subsequently exposed to the mitochondrial inhibitor CCCP (1 μM). Representative Ca2+ traces are shown. Individual cells were imaged (n = 20) and their fluorescence intensities (Fura2) recorded; the peaks of Ca2+ release are also shown. (B) HT1080/Neo and HT1080/BI-1 cells were loaded with Rhod II AM and subsequently treated with CCCP (1 μM). Rhod II fluorescence was monitored in individual cells (n = 15). (C) Mitochondria were analyzed for 45Ca2+ intake. *, p < 0.05 versus HT1080/Neo. (D) Mitochondria from HT1080/Neo and HT1080/BI-1 were loaded with Rhod II AM and subsequently treated with 2 mM CaCl2. Rhod II fluorescence was monitored. [Ca2+]i, intracellular Ca2+; Tg, thapsigargin; CCCP, carbonylcyanide m-chlorophenylhydrazone; Neo, neomycin-resistant pcDNA3-transfected HT1080 cells (HT1080/Neo); BI-1, HA-BI-1-pcDNA3-transfected HT1080 cells (HT1080/BI-1).
Figure 4
Figure 4. Mitochondrial Ca2+ intake through the Ca2+ uniporter is reduced in HT1080/BI-1 cells.
(A) HT1080/Neo and HT1080/BI-1 were loaded with Rhod II-AM and subsequently treated with 5 μM thapsigargin, 5 μg/ml tunicamycin, or 1 μM brefeldin A in the presence or absence of 1 μM RU360. Rhod II fluorescence was analyzed. (B) HT1080/Neo and HT1080/BI-1 were transfected with erAEQ or loaded with Rhod II, and treated with 5 μM thapsigargin, 5 μg/ml tunicamycin, or 1 μg/ml brefeldin A in the presence or absence of 1 μM RU360. The intensity of erAEQ luminescence or Rhod II fluorescence was quantified. *, p < 0.05 versus thapsigargin-treated HT1080/Neo; #, p < 0.05 versus tunicamycin-treated HT1080/Neo; &, p < 0.05 versus brefeldin A-treated HT1080/Neo. (C) Mitochondrial 45Ca2+ intake was analyzed in HT1080/Neo and HT1080/BI-1 in the presence or absence of RU360. *, p < 0.05 versus HT1080/Neo without RU360. (D) Viability of HT1080/Neo and HT1080/BI-1 cells after treatment with 5 μM thapsigargin in the presence or absence of RU360 was determined by trypan blue staining. *, p < 0.05 versus thapsigargin-treated HT1080/Neo Tg, thapsigargin; Tu, tunicamycin; Bre, brefeldin; Con, Control; Neo, neomycin-resistant pcDNA3-transfected HT1080 cells (HT1080/Neo); BI-1, HA-BI-1-pcDNA3-transfected HT1080 cells (HT1080/BI-1).
Figure 5
Figure 5. BI-1 regulates ER stress-induced apoptosis by inhibiting opening of the permeability transition pore.
(A) HT1080/Neo and HT1080/BI-1 were treated with thapsigargin in the presence or absence of 5 μM CsA. Cell viability was determined by trypan blue exclusion at 0, 12, 24, 36, and 48 hrs. Data shown represent means ± S.E. (n = 4). (B) HT1080/Neo and HT1080/BI-1 cells were treated with 5 μM thapsigargin in the presence or absence of 5 μM CsA for 24 hrs. Annexin V/PI-stained cells were analyzed by flow cytometry. Data shown represent means ± S.E. (n = 4). *, p < 0.05 versus thapsigargin-treated HT1080/Neo. (C) Cell viability was determined by trypan blue exclusion after treatment with 5 μg/ml tunicamycin or 1 μg/ml brefeldin A in the presence or absence of CsA for 48 hrs. *, p < 0.05 versus tunicamycin-treated HT1080/Neo; #, p < 0.05 versus brefeldin A-treated HT1080/Neo (D) HT1080/Neo and HT1080/BI-1 were transfected with erAEQ or loaded with Rhod II and subsequently treated with either 5 μM thapsigargin, 5 μg/ml tunicamycin, or 1 μg/ml brefeldin A in the presence or absence of 5 μM CsA. After the indicated treatments, the intensity of erAEQ luminesence or Rhod II fluorescence was quantified. Cropped gels/blots were run under the same experimental conditions. CsA, Cyclosporine A; Tg, Thapsigargin; Tu, Tunicamycin; Bre, Brefeldin A; Con, Control; [Ca2+]ER (%TG), Negative peak of luminescence of erAEQ compared to TG; [Ca2+]mito (%TG), peak of fluorescence of Rhod II compared to TG; Neo, neomycin-resistant pcDNA3-transfected HT1080 cells (HT1080/Neo); BI-1, HA-BI-1-pcDNA3-transfected HT1080 cells (HT1080/BI-1).
Figure 6
Figure 6. Ca2+-induced mitochondrial permeability transition pore opening and cytochrome c release are regulated by BI-1.
(A) Immunoblotting of total cells and mitochondria fractions from HT1080/Neo and HT1080/BI-1 with anti-Hsp60, anti-caspase-3, or anti-calreticulin antibodies. Mitochondria from HT1080/Neo and HT1080/BI-1 were treated with buffer and 100 μM CaCl2 in the presence or absence of 5 μM CsA. Absorbance at 540 nm was measured at the indicated time points after incubation at 30°C. Data shown are mean ± S.E. (n = 4). *p < 0.05 versus Ca2+-exposed mitochondria from HT1080/Neo. (B) Mitochondria from HT1080/Neo and HT1080/BI-1 were loaded with JC-1 dye and treated with 100 μM CaCl2 in the presence or absence of 5 μM CsA. Mitochondrial membrane potential (Δψm) was assessed using a spectrofluorometer as described in the Materials and Methods. (C) Mitochondria from HT1080/Neo and HT1080/BI-1 were treated with 100 μM CaCl2 in the presence or absence of 5 μM CsA. Cytochrome c released into supernatants was detected by immunoblotting with antibody against cytochrome c. Quantification is shown in the bottom panel. (D) Immunoblotting of total cells and mitochondria fractions from BI-1+/+ and BI-1-/- MEF with anti-Hsp60, anti-caspase-3, or anti-calreticulin antibodies. Mitochondria from BI-1+/+ and BI-1-/- MEF cells were treated with buffer, 100 μM CaCl2, or 100 μM CaCl2 plus 5 μM CsA. Absorbance at 540 nm was measured at the designated time points after incubation at 30°C. *, p < 0.05 versus Ca2+-exposed mitochondria from BI-1+/+ MEF cells, #, p < 0.01 versus Ca2+-exposed mitochondria from BI-1-/- MEF cells. (E) Mitochondria were loaded with JC-1 dye. Δψm was assessed using a spectrofluorimeter as described in the Materials and Methods. (F) Mitochondria were treated with 100 μM CaCl2 in the presence or absence of CsA. Cytochrome c released into the supernatant was detected by immunoblotting with antibody against cytochrome c. Quantification is shown in the bottom panel. *, p < 0.05 versus non-treated mitochondria from BI-1+/+ MEF cells, #, p < 0.01 versus non-treated mitochondria from BI-1-/- MEF cells. CsA: Cyclosporine A, Neo, neomycin-resistant pcDNA3-transfected HT1080 cells (HT1080/Neo); BI-1, HA-BI-1-pcDNA3-transfected HT1080 cells (HT1080/BI-1); BI-1+/+, BI-1 wild type mouse embryo fibroblasts; BI-1-/-, BI-1 knock-out mouse embryo fibroblasts. Sup, supernatants.
Figure 7
Figure 7. Activation of the mitochondrial Ca2+-dependent K+ channel in HT1080/BI-1.
(A) Mitochondria isolated from HT1080/Neo and HT1080/BI-1 were exposed to 100 μM Ca2+ with or without 100 μM diazoxide, 500 μM 5-HD, 100 μM NS1619, or 2 μM paxilline. Δψm was examined at the indicated times. (B) HT1080/Neo and HT1080/BI-1 were treated with 100 μM NS1619 in the presence or absence of paxilline; flavoprotein fluorescence was calibrated by exposing cells to 100 μmol/L DNP. (C) HT1080/Neo and HT1080/BI-1 were treated with 100 μM NS1619 and subsequently with 5 μM thapsigargin; flavoprotein fluorescence was calibrated by exposing cells to 100 μmol/L DNP. CsA, Cyclosporine; DNP, 2,4-dinitrophenol; Neo, neomycin-resistant pcDNA3-transfected HT1080 cells (HT1080/Neo); BI-1, HA-BI-1-pcDNA3-transfected HT1080 cells (HT1080/BI-1).
Figure 8
Figure 8. Mitochondrial Ca2+ and cell death are regulated by mitoKCa channel opening in HT1080/BI-1.
(A) HT1080/Neo and HT1080/BI-1 cells were loaded with Rhod II AM and then treated with 5 μM thapsigargin in the presence or absence of NS1619. Rhod II was subsequently monitored. (B) Quantification of Rhod II fluorescence peaks. *, p < 0.05 versus thapsigargin-treated HT1080/Neo. HT1080/Neo and HT1080/BI-1 were treated with 5 μM thapsigargin (C) or 5 μg/ml tunicamycin (D) in the presence or absence of 100 μM diazoxide, 500 μM 5-HD, 100 μM NS1619, or 2 μM paxilline for 48 hrs. Cell viability was measured by trypan blue exclusion. *, p < 0.05 versus thapsigargin-treated HT1080/Neo; #, p < 0.05 versus thapsigargin-treated HT1080/BI-1. $, p < 0.05 versus tunicamycin-treated HT1080/Neo; &, p < 0.05 versus tunicamycin-treated HT1080/BI-1. 5-HD, 5-hydroxydecanoate; DZ, diazoxide; NS, NS1619; 5HD, 5-hydroxydecanoate; Neo, neomycin-resistant pcDNA3-transfected HT1080 cells (HT1080/Neo); BI-1, HA-BI-1-pcDNA3-transfected HT1080 cells (HT1080/BI-1).

Similar articles

Cited by

References

    1. Berridge M. J. The endoplasmic reticulum: a multifunctional signaling organelle. Cell Calcium 32, 235–49 (2002). - PubMed
    1. Van Coppenolle F. et al. Ribosome-translocon complex mediates calcium leakage from endoplasmic reticulum stores. J Cell Sci 117, 4135–42 (2004). - PubMed
    1. Pinton P., Giorgi C., Siviero R., Zecchini E. & Rizzuto R. Calcium and apoptosis: ER-mitochondria Ca2+ transfer in the control of apoptosis. Oncogene 27, 6407–18 (2008). - PMC - PubMed
    1. Giorgi C. et al. Mitochondrial calcium homeostasis as potential target for mitochondrial medicine. Mitochondrion 12, 77–85 (2012). - PMC - PubMed
    1. Ben-Hail D., Palty R. & Shoshan-Barmatz V. Measurement of Mitochondrial Ca2+ Transport Mediated by Three Transport Proteins: VDAC1, the Na+/Ca2+ Exchanger, and the Ca2+ Uniporter. Cold Spring Harb Protoc 2, 161–166 (2014). - PubMed

Publication types

MeSH terms