

Association of purine asymmetry, strand-biased gene distribution and PolC within Firmicutes and beyond: a new appraisal
- PMID: 24899249
- PMCID: PMC4070872
- DOI: 10.1186/1471-2164-15-430
Association of purine asymmetry, strand-biased gene distribution and PolC within Firmicutes and beyond: a new appraisal
Abstract
Background: The Firmicutes often possess three conspicuous genome features: marked Purine Asymmetry (PAS) across two strands of replication, Strand-biased Gene Distribution (SGD) and presence of two isoforms of DNA polymerase III alpha subunit, PolC and DnaE. Despite considerable research efforts, it is not clear whether the co-existence of PAS, PolC and/or SGD is an essential and exclusive characteristic of the Firmicutes. The nature of correlations, if any, between these three features within and beyond the lineages of Firmicutes has also remained elusive. The present study has been designed to address these issues.
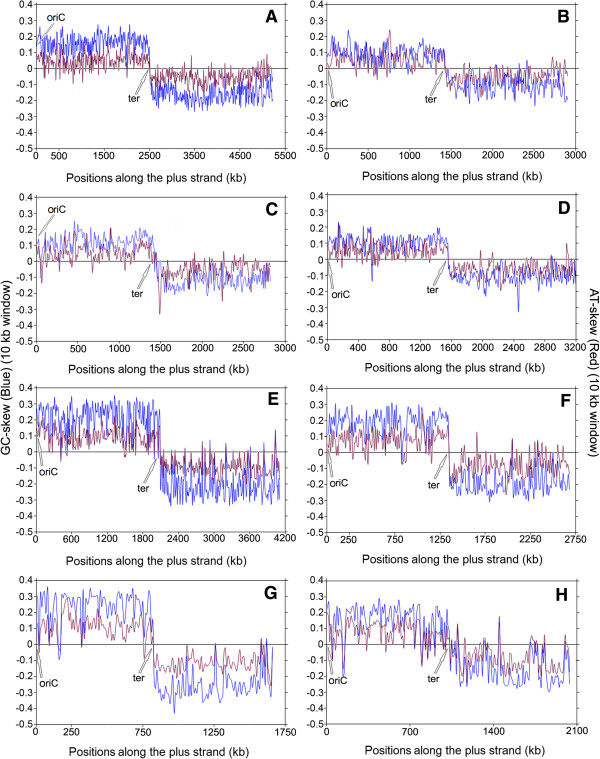
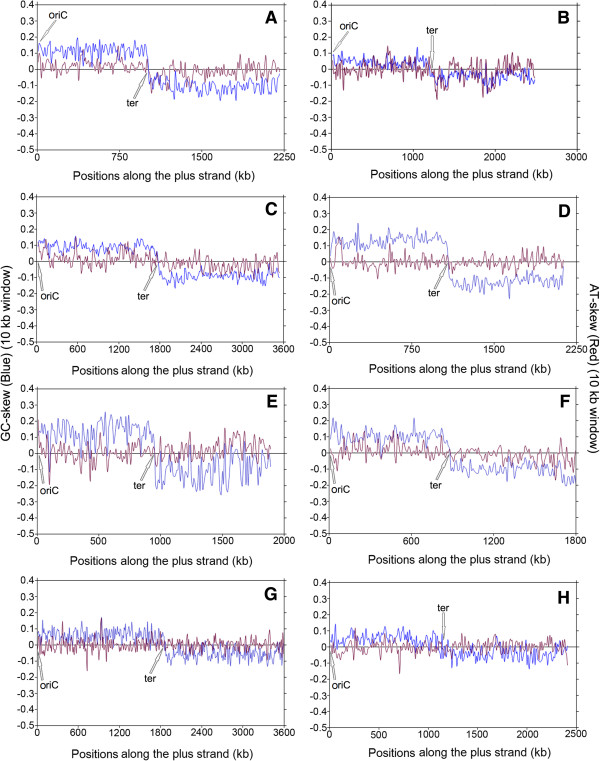
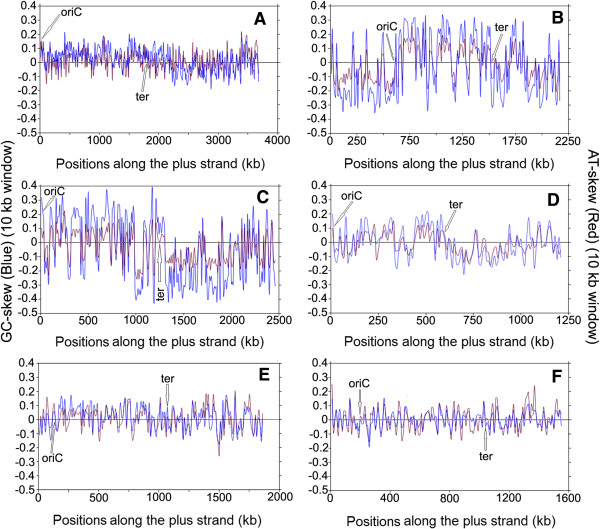
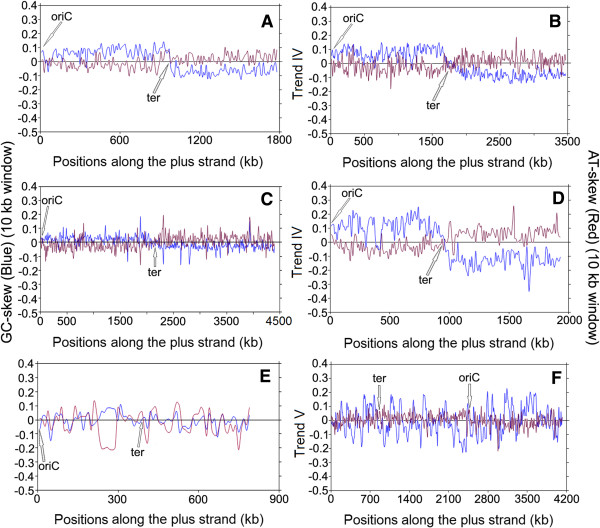
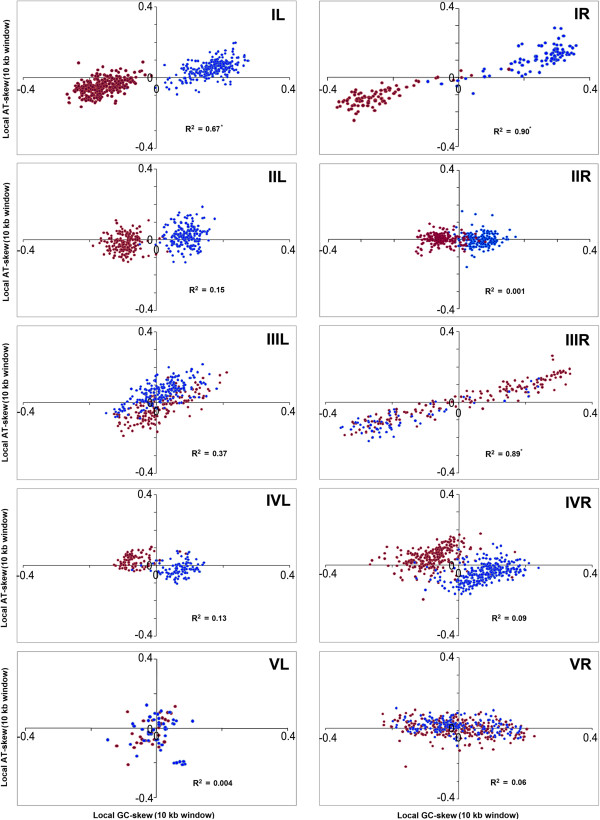
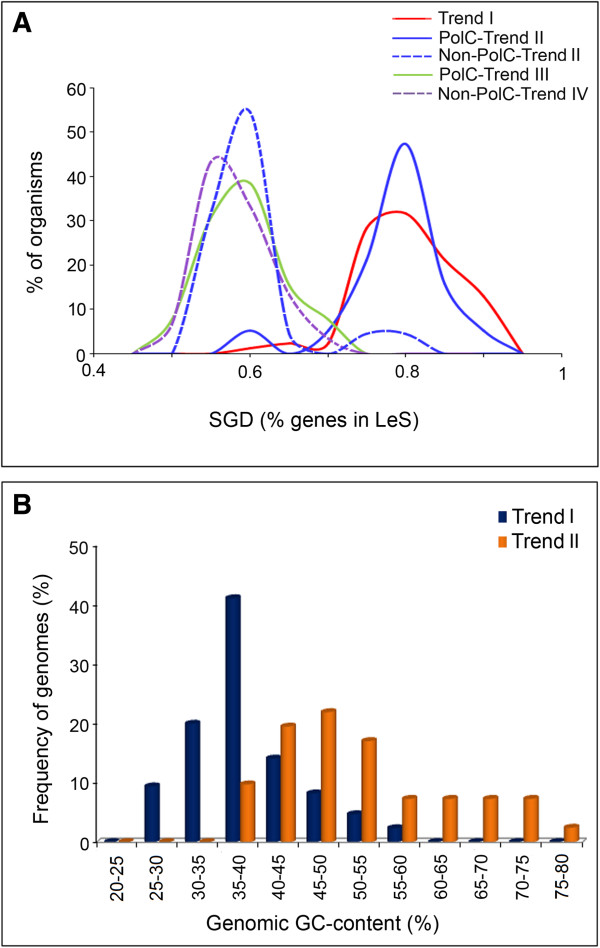
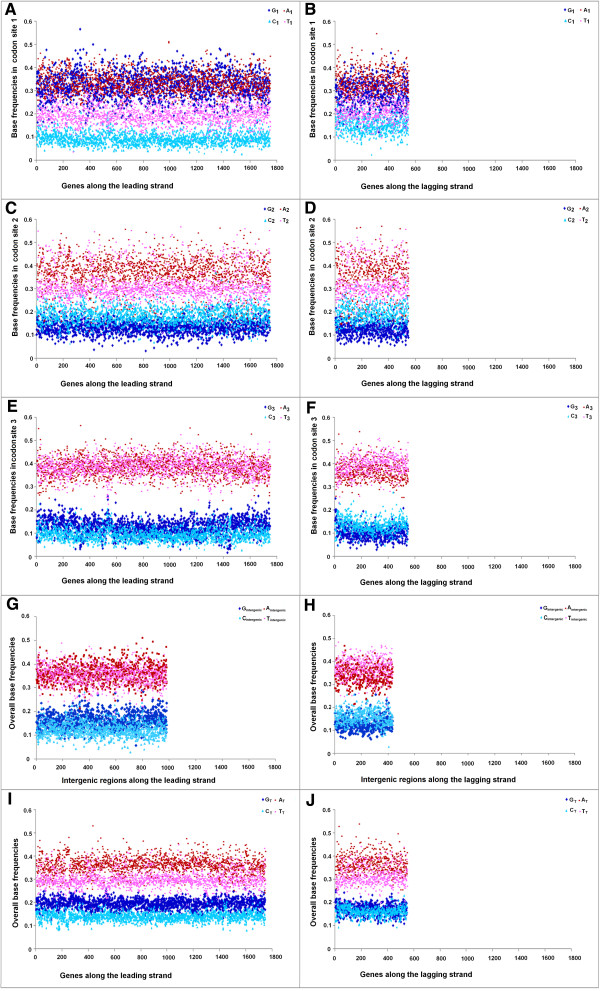
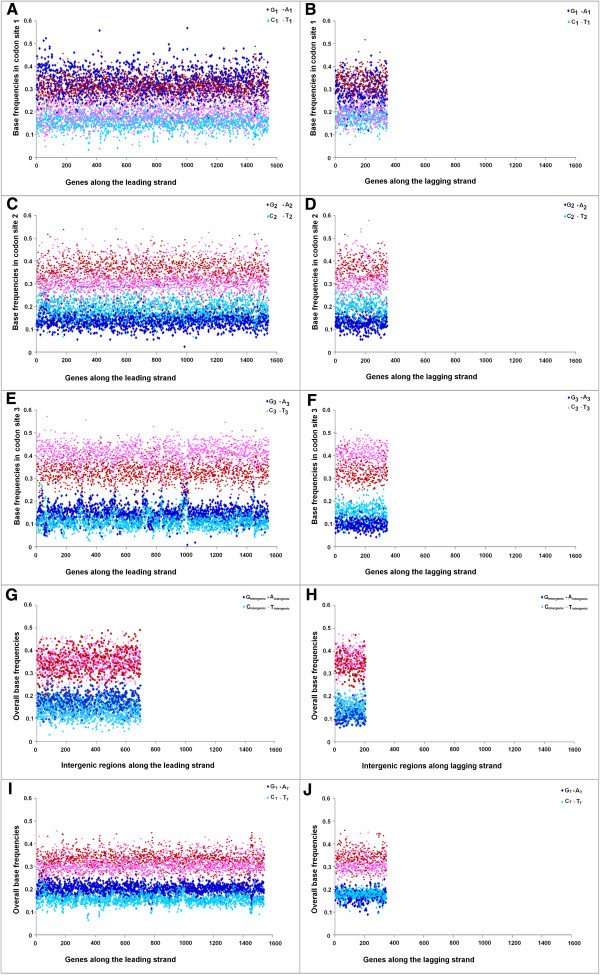
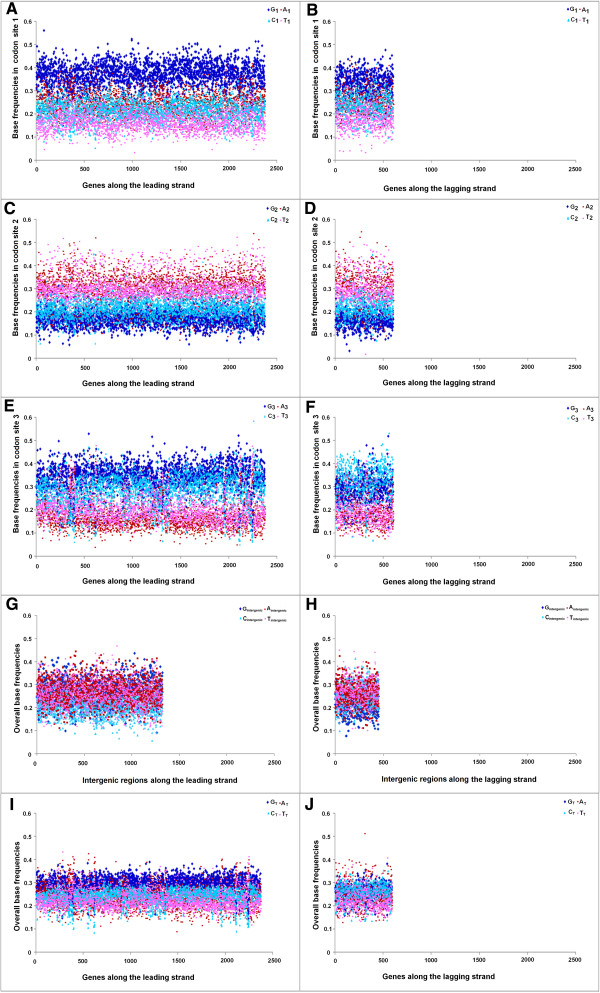
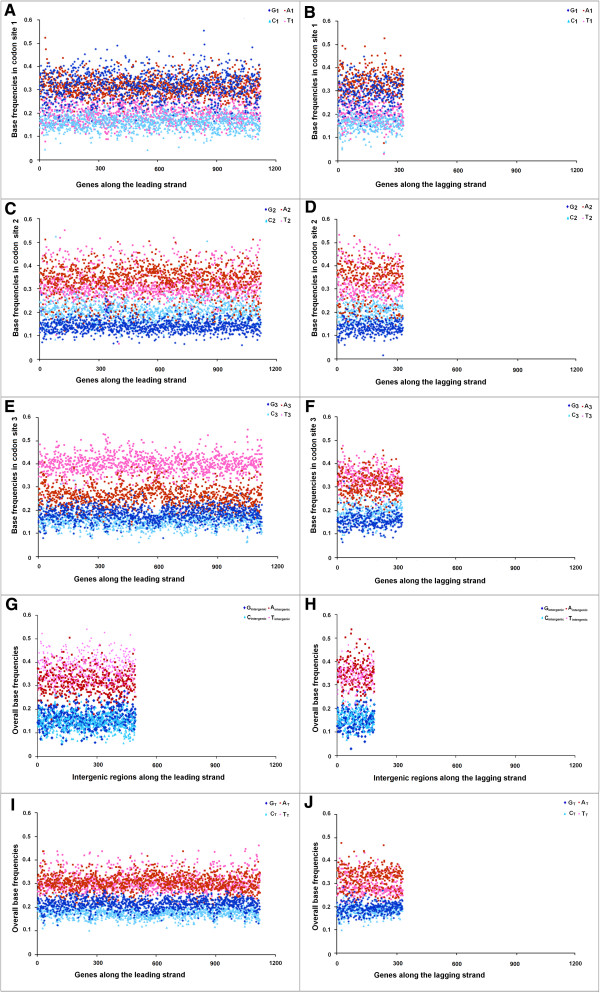
Results: A large-scale analysis of diverse bacterial genomes indicates that PAS, PolC and SGD are neither essential nor exclusive features of the Firmicutes. PolC prevails in four bacterial phyla: Firmicutes, Fusobacteria, Tenericutes and Thermotogae, while PAS occurs only in subsets of Firmicutes, Fusobacteria and Tenericutes. There are five major compositional trends in Firmicutes: (I) an explicit PAS or G + A-dominance along the entire leading strand (II) only G-dominance in the leading strand, (III) alternate stretches of purine-rich and pyrimidine-rich sequences, (IV) G + T dominance along the leading strand, and (V) no identifiable patterns in base usage. Presence of strong SGD has been observed not only in genomes having PAS, but also in genomes with G-dominance along their leading strands - an observation that defies the notion of co-occurrence of PAS and SGD in Firmicutes. The PolC-containing non-Firmicutes organisms often have alternate stretches of R-dominant and Y-dominant sequences along their genomes and most of them show relatively weak, but significant SGD. Firmicutes having G + A-dominance or G-dominance along LeS usually show distinct base usage patterns in three codon sites of genes. Probable molecular mechanisms that might have incurred such usage patterns have been proposed.
Conclusion: Co-occurrence of PAS, strong SGD and PolC should not be regarded as a genome signature of the Firmicutes. Presence of PAS in a species may warrant PolC and strong SGD, but PolC and/or SGD not necessarily implies PAS.
Figures
Similar articles
-
Replication-associated purine asymmetry may contribute to strand-biased gene distribution.Genomics. 2007 Aug;90(2):186-94. doi: 10.1016/j.ygeno.2007.04.002. Epub 2007 May 29. Genomics. 2007. PMID: 17532183
-
Strand-biased gene distribution in bacteria is related to both horizontal gene transfer and strand-biased nucleotide composition.Genomics Proteomics Bioinformatics. 2012 Aug;10(4):186-96. doi: 10.1016/j.gpb.2012.08.001. Epub 2012 Aug 8. Genomics Proteomics Bioinformatics. 2012. PMID: 23084774 Free PMC article.
-
Distinct co-evolution patterns of genes associated to DNA polymerase III DnaE and PolC.BMC Genomics. 2012 Feb 14;13:69. doi: 10.1186/1471-2164-13-69. BMC Genomics. 2012. PMID: 22333191 Free PMC article.
-
Is there a role for replication fork asymmetry in the distribution of genes in bacterial genomes?Trends Microbiol. 2002 Sep;10(9):393-5. doi: 10.1016/s0966-842x(02)02420-4. Trends Microbiol. 2002. PMID: 12217498 Review.
-
Chromosomal replicases as asymmetric dimers: studies of subunit arrangement and functional consequences.Mol Microbiol. 2003 Sep;49(5):1157-65. doi: 10.1046/j.1365-2958.2003.03645.x. Mol Microbiol. 2003. PMID: 12940977 Review.
Cited by
-
Bacillus subtilis DNA polymerases, PolC and DnaE, are required for both leading and lagging strand synthesis in SPP1 origin-dependent DNA replication.Nucleic Acids Res. 2017 Aug 21;45(14):8302-8313. doi: 10.1093/nar/gkx493. Nucleic Acids Res. 2017. PMID: 28575448 Free PMC article.
-
Data-independent acquisition-based blood proteomics unveils predictive biomarkers for neonatal necrotizing enterocolitis.Anal Bioanal Chem. 2025 Jan;417(1):199-218. doi: 10.1007/s00216-024-05637-7. Epub 2024 Nov 20. Anal Bioanal Chem. 2025. PMID: 39562369 Free PMC article.
-
Quantitative analysis of correlation between AT and GC biases among bacterial genomes.PLoS One. 2017 Feb 3;12(2):e0171408. doi: 10.1371/journal.pone.0171408. eCollection 2017. PLoS One. 2017. PMID: 28158313 Free PMC article.
-
On the evolution of chromosomal regions with high gene strand bias in bacteria.mBio. 2024 Jun 12;15(6):e0060224. doi: 10.1128/mbio.00602-24. Epub 2024 May 16. mBio. 2024. PMID: 38752745 Free PMC article.
-
Evolutionary History of Mitochondrial Genomes in Discoba, Including the Extreme Halophile Pleurostomum flabellatum (Heterolobosea).Genome Biol Evol. 2021 Feb 3;13(2):evaa241. doi: 10.1093/gbe/evaa241. Genome Biol Evol. 2021. PMID: 33185659 Free PMC article.
References
Publication types
MeSH terms
Substances
LinkOut - more resources
Full Text Sources
Other Literature Sources
Molecular Biology Databases
