. 2014 Jul;24(7):1180-92.
doi: 10.1101/gr.171934.113. Epub 2014 Jun 4.

A cloud-compatible bioinformatics pipeline for ultrarapid pathogen identification from next-generation sequencing of clinical samples

Affiliations

A cloud-compatible bioinformatics pipeline for ultrarapid pathogen identification from next-generation sequencing of clinical samples

Samia N Naccache et al. Genome Res. 2014 Jul.

Abstract

Unbiased next-generation sequencing (NGS) approaches enable comprehensive pathogen detection in the clinical microbiology laboratory and have numerous applications for public health surveillance, outbreak investigation, and the diagnosis of infectious diseases. However, practical deployment of the technology is hindered by the bioinformatics challenge of analyzing results accurately and in a clinically relevant timeframe. Here we describe SURPI ("sequence-based ultrarapid pathogen identification"), a computational pipeline for pathogen identification from complex metagenomic NGS data generated from clinical samples, and demonstrate use of the pipeline in the analysis of 237 clinical samples comprising more than 1.1 billion sequences. Deployable on both cloud-based and standalone servers, SURPI leverages two state-of-the-art aligners for accelerated analyses, SNAP and RAPSearch, which are as accurate as existing bioinformatics tools but orders of magnitude faster in performance. In fast mode, SURPI detects viruses and bacteria by scanning data sets of 7-500 million reads in 11 min to 5 h, while in comprehensive mode, all known microorganisms are identified, followed by de novo assembly and protein homology searches for divergent viruses in 50 min to 16 h. SURPI has also directly contributed to real-time microbial diagnosis in acutely ill patients, underscoring its potential key role in the development of unbiased NGS-based clinical assays in infectious diseases that demand rapid turnaround times.


Figures

Figure 1.
Figure 1.
The SURPI pipeline for pathogen detection. (A) A schematic overview of the SURPI pipeline. Raw NGS reads are preprocessed by removal of adapter, low-quality, and low-complexity sequences, followed by computational subtraction of human reads using SNAP. In fast mode, viruses and bacteria are identified by SNAP alignment to viral and bacterial nucleotide databases. In comprehensive mode, reads are aligned using SNAP to all nucleotide sequences in the NCBI nt collection, enabling identification of bacteria, fungi, parasites, and viruses. For pathogen discovery of divergent microorganisms, unmatched reads and contigs generated from de novo assembly are then aligned to a viral protein database or all protein sequences in the NCBI nr collection using RAPSearch. SURPI reports include a list of all classified reads with taxonomic assignments, a summary table of read counts, and both viral and bacterial genomic coverage maps. (B) Relative proportion of NGS reads classified as human, bacterial, viral, or other in different clinical sample types. (C) The SNAP nucleotide aligner (Zaharia et al. 2011). SNAP aligns reads by generating a hash table of sequences of length “s” from the reference database and then comparing the hash index with “n” seeds of length “s” generated from the query sequence, producing a match based on the edit distance “d.” (D) The RAPSearch protein similarity search tool (Zhao et al. 2012). RAPSearch aligns translated nucleotide queries to a protein database using a compressed amino acid alphabet at the level of chemical similarity for greatly increased processing speed.
Figure 2.
Figure 2.
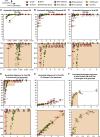
SURPI aligners (SNAP and RAPSearch) are comparable to other tested aligners for detection of human, bacterial, and viral reads from in silico-generated query data sets. ROC curves were generated to evaluate the ability of four nucleotide aligners (SNAP, BWA, BT2, and BLASTn) to correctly detect in silico-generated NGS reads when mapped against the human DB (A), bacterial DB (B), or viral nucleotide DB (C). The accuracy of detection was assessed using Youden’s index and the F1 score. Sensitivity or the true positive rate (TPR) (y-axis) is plotted against 1-specificity or the false positive rate (FPR) (x-axis). (D) Detection of reads corresponding to four viral genomes [norovirus, Zaire ebolavirus, influenza A(H1N1)pdm09, and HIV-1] by nucleotide alignment. (E) Detection of reads corresponding to three divergent viruses (TMAdV, BASV, and bat influenza H17N10, a novel influenza strain) by nucleotide alignment. (F) Detection of reads corresponding to three divergent viruses (TMAdV, BASV, and bat influenza H17N10) by translated nucleotide (protein) alignment using the RAPSearch and BLASTx aligners. The sequences of these viruses were removed from the nucleotide and protein viral reference databases prior to alignment. The lower shaded panels are magnifications of the corresponding shaded boxed regions in the upper panels.
Figure 3.
Figure 3.
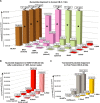
SURPI aligners (SNAP and RAPSearch) are significantly faster than other tested aligners and scale better with larger data sets. Timing performance was benchmarked on a single computational server using in silico query data sets of increasing size. The breaks (zigzag lines) represent computational times that are off-scale. Some of the computational times were estimated (asterisks). (A) Performance time for alignment of reads to the human DB. (B) Performance time for SNAP alignment of reads to the entire 42-Gb NCBI nt DB. The z-axis denotes the approximate number of remaining reads following computational subtraction against the human DB. SNAP performance times were benchmarked separately on local and cloud servers. (C) Performance times for translated nucleotide alignment to the viral protein DB using RAPSearch and BLASTx.
Figure 4.
Figure 4.
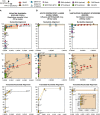
SURPI aligners (SNAP and RAPSearch) are comparable to other tested aligners for detection of viral reads in clinical NGS data sets. ROC curves were generated to evaluate the ability of nucleotide and translated nucleotide (protein) aligners to detect reads corresponding to three target viruses: (A) respiratory syncytial virus (RSV) from stool; (B) influenza A(H1N1)pdm09 from a nasal swab; and (C) Sin Nombre hantavirus from serum. Sensitivity or the true positive rate (TPR) (y-axis) is plotted against 1-specificity or the false positive rate (FPR) (x-axis). For each aligner, reads assigned to the correct viral genus were used for generating the ROC curve. The shaded panels are magnifications of the corresponding shaded regions in the upper panels (AC, nucleotide alignment) or overlapping larger panel (C, translated nucleotide alignment).
Figure 5.
Figure 5.
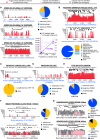
The SURPI pipeline correctly identifies viral species in clinical NGS data sets. Data sets corresponding to clinical samples or sample pools harboring target viral pathogens were analyzed using SURPI. Pie charts show detected viruses derived from the output summary tables. Target viruses are color-coded in yellow or orange; other viruses are color-coded ranked by their relative abundance in shades of blue, followed by shades of purple. Coverage maps of the “best hit” viral genome in fast mode (red) and comprehensive mode (pink, overlaid by red) display automated SURPI output corresponding to the detected target viral genome (blue text). The read coverage (y-axis, log scale) and de novo assembled contigs (black lines) are plotted as a function of nucleotide position along the genome (x-axis). Percent coverage achieved using SURPI in fast mode (“FAST”), in comprehensive mode (“COMPREHENSIVE”), and by de novo assembly (“ASSEMBLY”), as well as the actual coverage from all reads in the data set (“ALL”) are shown. (A) Coverage plots of HIV-1 spiked at titers of 102−104 copies/mL. The number of mapped reads and percent coverage are plotted against the viral copy number (inset). Coverage plots of SaV and HPeV-1 (B), HPV-18 (C), HHV-3 (D), and HCV-1b (E). (F) Coverage plot mapping SURPI-classified genus-level Mastadenovirus reads (red/pink) to the SAdV-18 genome, or Mastadenovirus reads (red/pink) and all specific TMAdV reads (gray) to the TMAdV genome. (G) Coverage plots mapping SURPI-classified family-level Rhabdoviridae reads (pink) or all specific BASV reads (gray) to the BASV genome.
Figure 6.
Figure 6.
The SURPI pipeline correctly identifies bacterial and parasitic species in clinical NGS data sets. Three NGS data sets corresponding to clinical samples or sample pools and found to harbor target pathogenic bacteria or parasites were analyzed using SURPI in comprehensive mode. Pie charts represent the breakdown of SURPI-classified pathogen reads by family. (A) Serum from an individual with acute hemorrhagic fever in the Democratic Republic of the Congo (DRC), Africa, was analyzed by unbiased NGS. NGS reads identified as Plasmodium by SURPI are mapped to the 14 chromosomes of Plasmodium falciparum clone 3D7, including multiple hits to telomeric ends by reads corresponding to the var gene (Gardner et al. 2002). (B) Serum from a patient who died from a critical febrile illness in Tanzania, Africa (Crump et al. 2013) was analyzed using NGS. SURPI generates a coverage map corresponding to the “best hit” bacterial genome, Haemophilus influenzae. (C) SURPI was used to classify the diversity of bacterial species in 22 clinical samples, 11 from colorectal tumors and 11 from normal tissue (Castellarin et al. 2012). For the top 10 bacterial species, the fold-increase in the average normalized abundance between normal and diseased tissue is plotted in rank order from most to least abundant.
Figure 7.
Figure 7.
Speed of SURPI and feasibility for real-time clinical analysis. (A) Timing performance for SURPI in fast mode (red) and comprehensive mode (blue) was benchmarked on a single computational server across 12 NGS data sets representing a variety of infectious diseases and sample types. Processing end-to-end-times are plotted against the number of reads (inset), along with regression trend lines corresponding to SURPI processing in fast and comprehensive modes. (B) A serum sample from a returning traveler with an acute febrile illness was analyzed using NGS, resulting in SURPI detection of human herpesvirus 7 (HHV-7) infection (inset, coverage plot) in a clinically relevant 48-h timeframe.

Similar articles

Cited by

References

    1. Akobeng AK 2007. Understanding diagnostic tests 3: receiver operating characteristic curves. Acta Paediatr 96: 644–647 - PubMed
    1. Altschul SF, Gish W, Miller W, Myers EW, Lipman DJ 1990. Basic local alignment search tool. J Mol Biol 215: 403–410 - PubMed
    1. Barnes GL, Uren E, Stevens KB, Bishop RF 1998. Etiology of acute gastroenteritis in hospitalized children in Melbourne, Australia, from April 1980 to March 1993. J Clin Microbiol 36: 133–138 - PMC - PubMed
    1. Bhaduri A, Qu K, Lee CS, Ungewickell A, Khavari PA 2012. Rapid identification of non-human sequences in high-throughput sequencing datasets. Bioinformatics 28: 1174–1175 - PMC - PubMed
    1. Bloch KC, Glaser C 2007. Diagnostic approaches for patients with suspected encephalitis. Curr Infect Dis Rep 9: 315–322 - PubMed

Publication types