. 2014 Sep;31(9):2342-55.
doi: 10.1093/molbev/msu178. Epub 2014 Jun 3.

Evolutionary insights into premetazoan functions of the neuronal protein homer

Affiliations

Evolutionary insights into premetazoan functions of the neuronal protein homer

Pawel Burkhardt et al. Mol Biol Evol. 2014 Sep.

Abstract

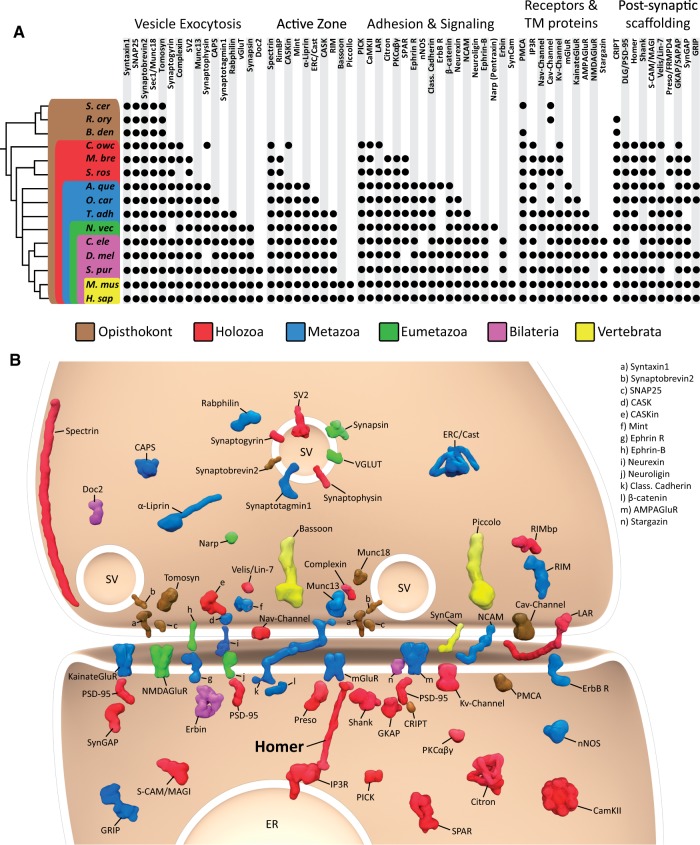
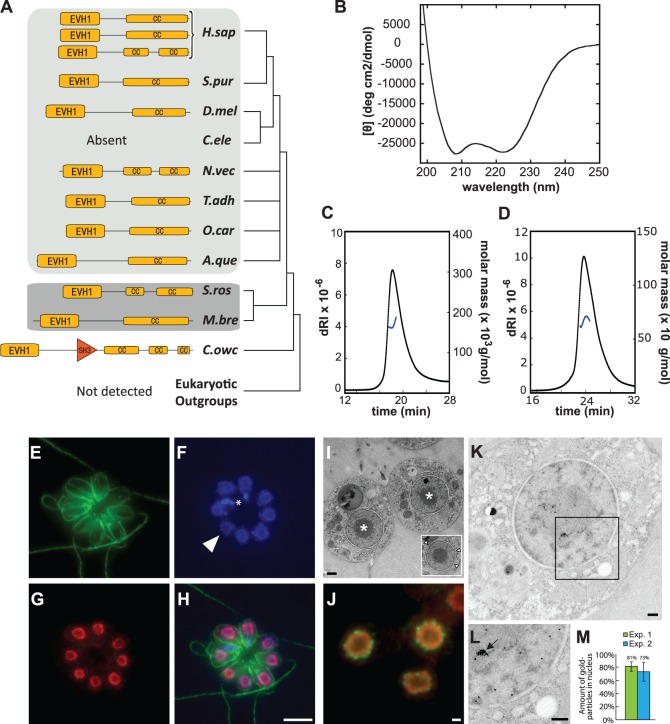
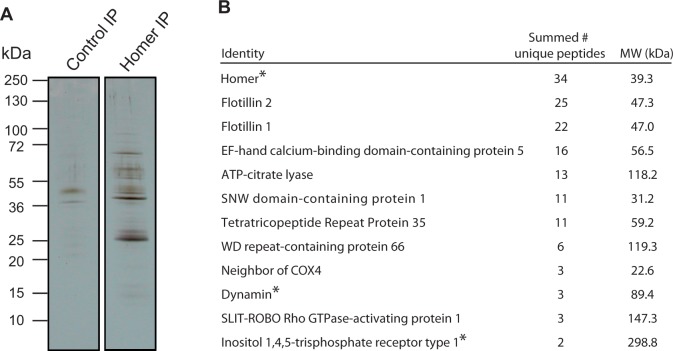
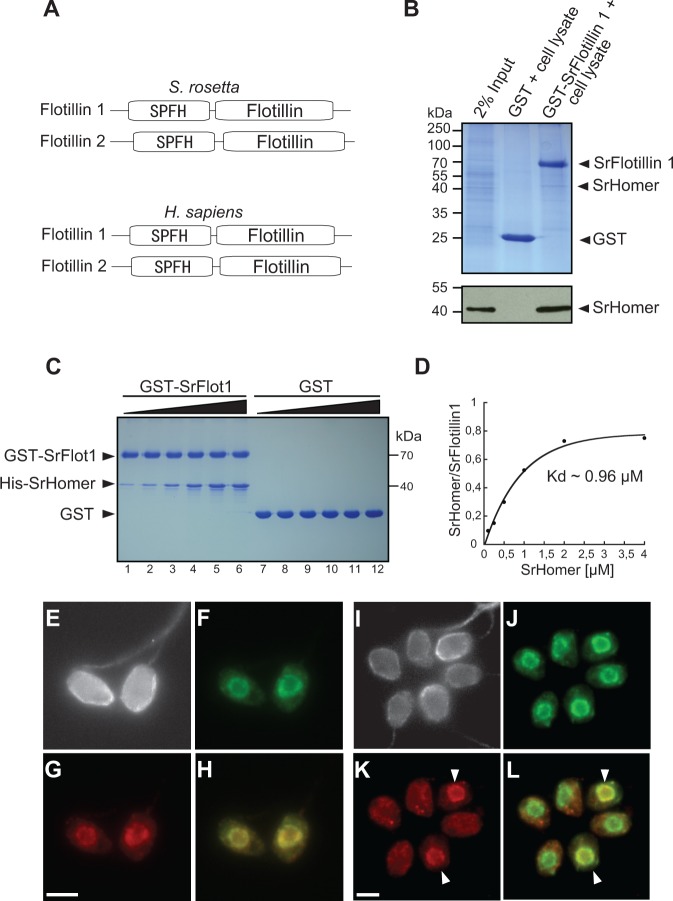
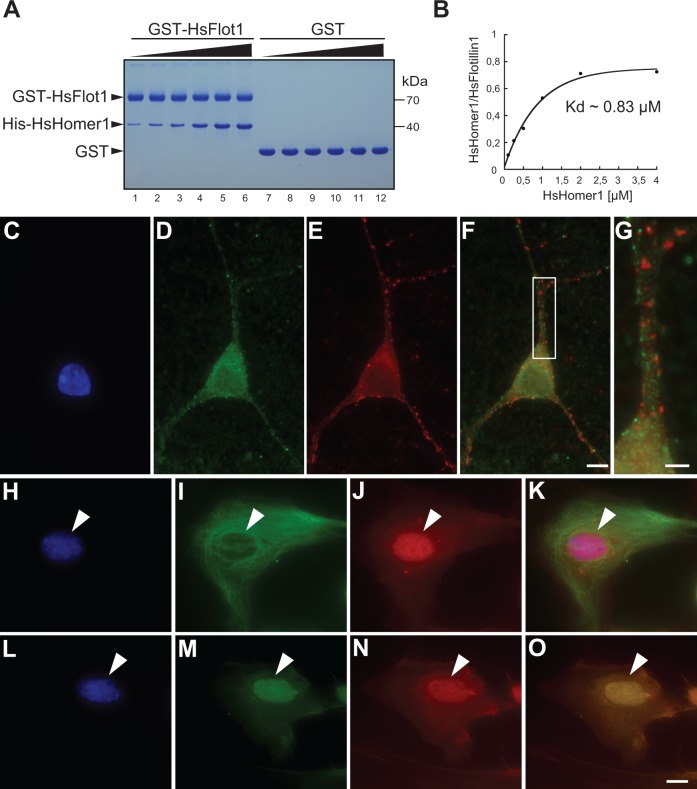
Reconstructing the evolution and ancestral functions of synaptic proteins promises to shed light on how neurons first evolved. The postsynaptic density (PSD) protein Homer scaffolds membrane receptors and regulates Ca(2+) signaling in diverse metazoan cell types (including neurons and muscle cells), yet its ancestry and core functions are poorly understood. We find that the protein domain organization and essential biochemical properties of metazoan Homer proteins, including their ability to tetramerize, are conserved in the choanoflagellate Salpingoeca rosetta, one of the closest living relatives of metazoans. Unlike in neurons, Homer localizes to the nucleoplasm in S. rosetta and interacts directly with Flotillin, a protein more commonly associated with cell membranes. Surprisingly, we found that the Homer/Flotillin interaction and its localization to the nucleus are conserved in metazoan astrocytes. These findings suggest that Homer originally interacted with Flotillin in the nucleus of the last common ancestor of metazoans and choanoflagellates and was later co-opted to function as a membrane receptor scaffold in the PSD.

Keywords: Flotillin; Homer; S. rosetta; choanoflagellate; postsynaptic scaffold evolution; synapse.


Figures

F<sc>ig</sc>. 1.
Fig. 1.
The genome of the choanoflagellate Salpingoeca rosetta encodes diverse synaptic protein homologs. (A) Metazoan synaptic proteins fall into five major functional categories: Vesicle exocytosis proteins, active zone proteins, adhesion and signaling proteins, receptors and transmembrane (TM) proteins, and postsynaptic scaffolding proteins. A black dot indicates the presence of clear homologs (also see supplementary table S1, Supplementary Material online), whereas absence of a dot indicates that a homolog was not detected in that taxon. Taxonomic groupings are indicated as follows: Brown box, Opisthokonta; red box, Holozoa; blue box, Metazoa; green box, Eumetazoa; violet box, Bilateria; yellow box, Vertebrata. The topology of the reference phylogeny was based on a consensus phylogeny (Baldauf 2003; Ruiz-Trillo et al. 2008; Philippe et al. 2009; Fairclough et al. 2013), with the nodes of the earlier branching metazoan lineages collapsed to indicate current controversy concerning their evolutionary relationships. A. que, Amphimedon queenslandica; B. den, Batrachochytrium dendrobatidis; C. ele, Caenorhabditis elegans; C. owc, Capsaspora owczarzaki; D. mel, Drosophila melanogaster; H. sap, Homo sapiens; M. bre, Monosiga brevicollis; M. mus, Mus musculus; N. vec, Nematostella vectensis; O. car, Oscarella carmela; R. ory, Rhizopus oryzae; S. cer, Saccharomyces cerevisae; S. pur, Strongylocentrotus purpuratus; S. ros, Salpingoeca rosetta; T. adh, Trichoplax adhaerens. (B) Graphic representation of an excitatory synapse indicating the subcellular contexts in which many pre- and postsynaptic proteins function. The phylogenetic distribution of each protein is indicated using the color scheme in (A). SV, synaptic vesicle; ER, endoplasmic reticulum.
F<sc>ig</sc>. 2.
Fig. 2.
Conserved biochemical properties and nuclear localization of Homer in the choanoflagellate Salpingoeca rosetta. (A) The protein domain organization of Homer is conserved in S. rosetta and metazoan Homer proteins. The protein domain organizations of Homer homologs from Capsaspora owczarzaki, the choanoflagellates S. rosetta and Monosiga brevicollis, and diverse metazoan taxa were mapped onto the consensus phylogeny from figure 1(A). Yellow boxes highlight the conserved Enabled/VASP homology 1 (EVH1) domain and the CC domains of Homer. Orange triangle indicates SH3 domain in C. owczarzaki Homer protein. Although Homer was found in almost all metazoan (light gray), choanoflagellate (dark gray), and C. owczarzaki genomes analyzed in this study, it was not detected in any other lineage. (B) CD spectroscopy of the C-terminal CC domain of bacterially expressed SrHomer (SrHomerCC). The CD spectrum, with two clearly defined minima at 208 and 222 nm, reveals that SrHomerCC is alpha-helical. (C and D) Oligomerization of SrHomer in solution. Size-exclusion chromatography (SEC)-MALS data are shown for full-length SrHomer (C) and SrHomerΔCC (D). Full-length SrHomer exists predominantly as a tetramer (MW: 167 kDa), whereas the deletion of the C-terminal CC domain renders SrHomer dimeric (MW: 67 kDa). The signal from the refractive index detector (dRI; left, Y axis) is shown as solid, black lines. Molecular mass as calculated across the protein elution peak (right, Y axis) is shown as blue lines. (E–I) A rosette colony in which the apical flagellum of each cell is oriented outward. The plasma membrane and flagellum of each cell are revealed by staining with antibodies to beta-tubulin (E, green). (F) DAPI staining reveals DNA in the nucleus of each cell. Arrowhead indicates a representative nucleus from one cell. DNA from prey bacteria (indicated with asterisk) also stains with DAPI. (G) SrHomer colocalizes with DNA in the nucleus, as revealed in the merge (H). (I) In S. rosetta, the nucleus is organized with the electron-dense spherical nucleolus (asterisk) in the center surrounded by a shell of nuclear DNA and nucleoplasm, as revealed by TEM of a thin section through a S. rosetta rosette colony. Inset: Nuclear pores from a single nucleus are indicated with arrowheads. (J) Staining with antibodies to nuclear pore complexes (green) revealed that SrHomer (red) is contained within the nuclear membrane and distributed throughout the nucleoplasm. The hollow center of the nucleus suggests that SrHomer is either excluded from the nucleolus or that antibodies to SrHomer did not efficiently penetrate the nucleolus. (K) Immunogold labeling of S. rosetta cells with an antibody directed against SrHomer. Gold particles are visible as black dots that localize throughout the nucleus. (L) Higher magnification of the region of the nucleus contained within the box in (K). Homer was seen to localize to both the nucleoplasm and nucleolus. High densities of Homer localization in the nucleus (arrow) were frequently observed. (M) Two independent immunogold labeling experiments (Exp. 1 and Exp. 2) show that Homer localizes predominantly to the nucleus (73% and 81%). Nuclear versus cytosolic localization of gold particles was measured from 25 cells per experiment. Scale bars: 5 µm in (G), 500 nm in (I) and (J), 200 nm in (K) and (L). Species abbreviations as in figure 1.
F<sc>ig</sc>. 3.
Fig. 3.
Mass spectrometric identification of Salpingoeca rosetta Homer-binding proteins. (A) In a coimmunoprecipitation experiment, diverse proteins were pulled down by SrHomer antibodies, but not by control antibodies. Whole cell lysates from S. rosetta rosette colonies were used for coimmunoprecipitation experiments and the resulting bound proteins analyzed by SDS-PAGE, silver staining, and LC-MS/MS (supplementary table S2, Supplementary Material online). (B) Select candidate binding partners of SrHomer identified by LC-MS/MS analysis of SrHomer coimmunoprecipitates. The summed number of unique peptides represents the total number of identified peptides from two independent SrHomer IP experiments. No peptides were detected in the control IP experiments for these proteins, suggesting that they are selective binding partners of SrHomer. Previously known Homer-binding partners from metazoans are marked with an asterisk.
F<sc>ig</sc>. 4.
Fig. 4.
SrHomer interacts directly with SrFlotillin 1 in the Salpingoeca rosetta nucleus. (A) Salpingoeca rosetta and human Flotillins 1 and 2 contain a conserved N-terminal SPFH-domain and a C-terminal Flotillin domain. (B) Purified GST-SrFlotillin 1 (GST-SrFlot1) pulls down SrHomer from S. rosetta cell lysate. Glutathione-sepharose beads bound to GST alone or GST-SrFlotillin 1 were incubated with S. rosetta cell lysate. The input lane represents 2% of the lysate used in the pull-down experiments. The remaining lanes show elutions from the beads separated by SDS-PAGE and visualized with Coomassie Blue (upper panel) or by immunoblotting with SrHomer antibodies (lower panel). (C) Purified His-SrHomer binds directly to GST-SrFlotillin 1 but not GST alone. To measure the binding affinity between SrHomer and SrFlotillin 1, increasing concentrations of His-SrHomer were incubated with 2 µM GST-SrFlotillin 1 (lanes 1–6), or with 2 µM GST (lanes 7–12) bound to glutathione-Sepharose beads for 1 h at RT, washed and analyzed on SDS-PAGE (concentrations of His-SrHomer used for the binding assays in lanes 1–6 and lanes 7–12 were 0.1 µM, 0.25 µM, 0.5 µM, 1 µM, 2 µM, and 4 µM, respectively). Saturated binding of SrHomer to SrFlotillin 1 was reached at approximately 2 µM SrHomer. (D) Amounts of precipitated His-SrHomer were measured, normalized to GST-SrFlotillin 1, and plotted. The Kd of the reaction was determined by fitting the data to a Hill function assuming 1:1 binding stoichiometry. The apparent binding Kd is approximately 0.96 µM. (E–L) SrFlotillin 1 colocalizes with SrHomer in all solitary S. rosetta cells (E–H) and in some (indicated with white arrowhead), but not all, cells within S. rosetta rosette colonies (I–L). Subcellular localization of beta-tubulin (E and I, gray), SrHomer (F and J, green), and SrFlotillin 1 (G and K, red) in S. rosetta. (H and L). The overlay of SrHomer and SrFlotillin 1 shows colocalization of the two proteins, presumably in the nucleus. Scale bar: 2 µm. Sr, S. rosetta.
F<sc>ig</sc>. 5.
Fig. 5.
Homer 1 and Flotillin 1 from vertebrates interact directly and colocalize in the nuclei of primary astrocytes. (A) Bacterially expressed His-HsHomer 1 binds to GST-HsFlotillin 1 (GST-HsFlot1) but not GST. To measure the binding affinity between HsHomer and HsFlotillin 1, increasing concentrations of His-HsHomer were incubated with 2 µM GST-HsFlotillin 1 (lanes 1–6) or with 2 µM GST (lanes 7–12) bound to glutathione-Sepharose beads for 1 h at RT, washed, and analyzed on SDS-PAGE (concentrations of His-HsHomer 1 used for the binding assays in lanes 1–6 and lanes 7–12 were 0.1 µM, 0.25 µM, 0.5 µM, 1 µM, 2 µM, and 4 µM, respectively). Saturated binding of HsHomer 1 to HsFlotillin 1 was reached at approximately 2 µM SrHomer. (B) The Kd of the reaction was determined by fitting the data to a Hill function assuming 1:1 binding stoichiometry. The apparent binding Kd is approximately 0.83 µM. (C–G) Homer 1 and Flotillin 1 do not appear to colocalize in rat hippocampal neurons. Hippocampal neurons (12 days in vitro) were stained with DAPI (C, blue), Flotillin 1 antibodies (D, green), and Homer 1 antibodies (E, red). Although Flotillin 1 and Homer 1 both form puncta throughout the dendrites and cytoplasm, both appear to be excluded from the nucleus. An overlay of Flotillin 1 and Homer 1 is shown in panel (F). (G) Segment of dendrite magnified from (F) shows little colocalization between Flotillin 1 and Homer 1. (H–K) Homer 1 localizes to the nucleus in rat astrocytes (4 days in vitro) as shown by staining with DAPI (H, blue), antibodies to the astrocyte marker GFAP (I, green), and antibodies to Homer 1 (J, red). (K) The overlay of DAPI, GFAP, and Homer 1 reveals that Homer 1 colocalizes with DNA in the nucleus. (L–O) Flotillin 1 and Homer 1 colocalize in rat astrocyte nuclei. Subcellular localization of DNA (L, blue), Flotillin 1 (M, green), and Homer 1 (N, red) are shown. (O) The overlay of DAPI-stained DNA, Flotillin1, and Homer 1 shows colocalization in the nucleus. Scale bars: 10 µm in (O) and (F), 5 µm in (G). Hs, Homo sapiens.

References

    1. Alié A, Manuel M. The backbone of the post-synaptic density originated in a unicellular ancestor of choanoflagellates and metazoans. BMC Evol Biol. 2010;10:34. - PMC - PubMed
    1. Altschul SF, Madden TL, Schäffer AA, Zhang J, Zhang Z, Miller W, Lipman DJ. Gapped BLAST and PSI-BLAST: a new generation of protein database search programs. Nucleic Acids Res. 1997;25:3389–3402. - PMC - PubMed
    1. Babu K, Cai Y, Bahri S, Yang X, Chia W. Roles of bifocal, Homer, and F-actin in anchoring Oskar to the posterior cortex of Drosophila oocytes. Genes Dev. 2004;18:138–143. - PMC - PubMed
    1. Baldauf SL. The deep roots of eukaryotes. Science. 2003;300:1703–1706. - PubMed
    1. Bickel PE, Scherer PE, Schnitzer JE, Oh P, Lisanti MP, Lodish HF. Flotillin and epidermal surface antigen define a new family of caveolae-associated integral membrane proteins. J Biol Chem. 1997;272:13793–13802. - PubMed

Publication types