

Mouse visual neocortex supports multiple stereotyped patterns of microcircuit activity
- PMID: 24899701
- PMCID: PMC4044243
- DOI: 10.1523/JNEUROSCI.0169-14.2014
Mouse visual neocortex supports multiple stereotyped patterns of microcircuit activity
Abstract
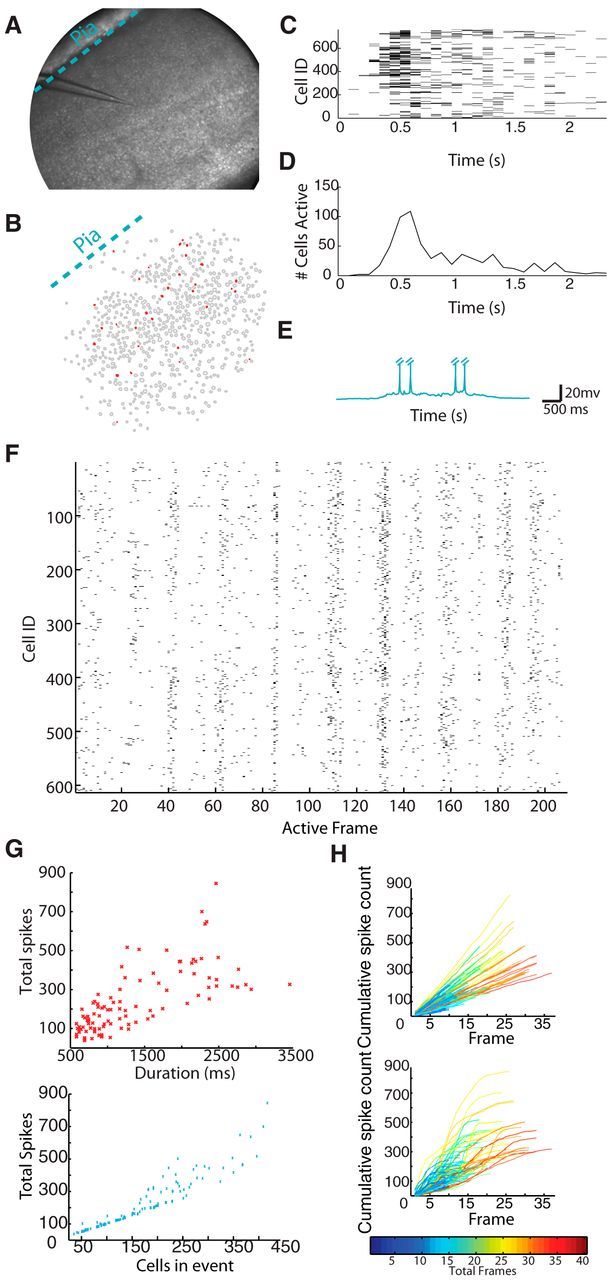
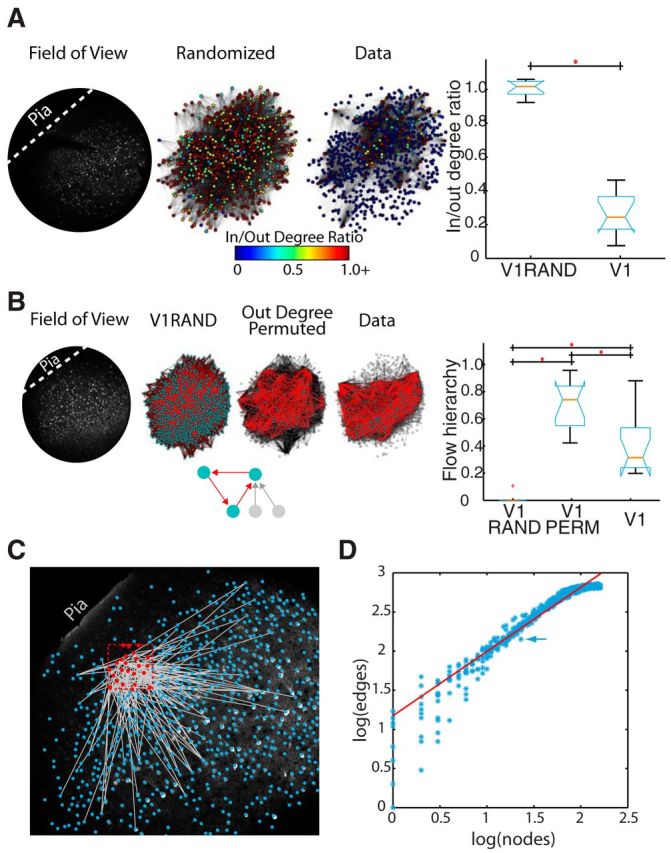
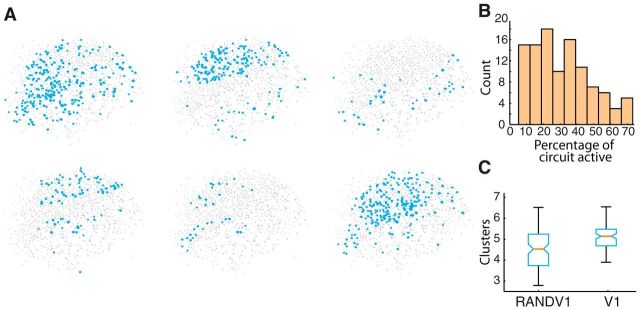
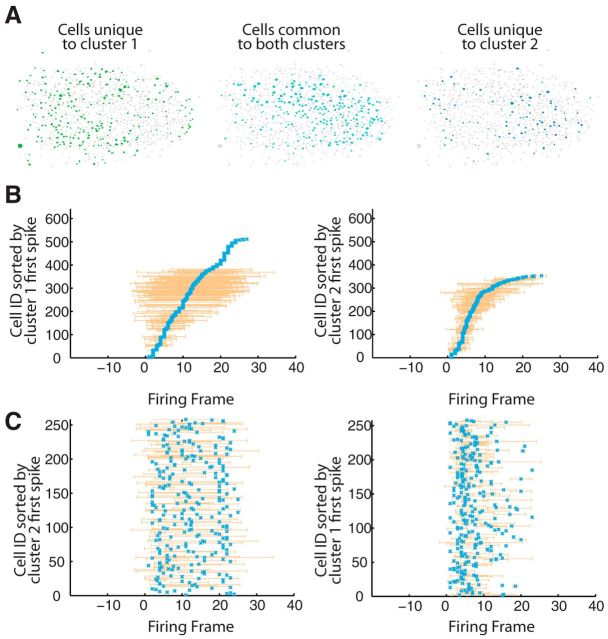
Spiking correlations between neocortical neurons provide insight into the underlying synaptic connectivity that defines cortical microcircuitry. Here, using two-photon calcium fluorescence imaging, we observed the simultaneous dynamics of hundreds of neurons in slices of mouse primary visual cortex (V1). Consistent with a balance of excitation and inhibition, V1 dynamics were characterized by a linear scaling between firing rate and circuit size. Using lagged firing correlations between neurons, we generated functional wiring diagrams to evaluate the topological features of V1 microcircuitry. We found that circuit connectivity exhibited both cyclic graph motifs, indicating recurrent wiring, and acyclic graph motifs, indicating feedforward wiring. After overlaying the functional wiring diagrams onto the imaged field of view, we found properties consistent with Rentian scaling: wiring diagrams were topologically efficient because they minimized wiring with a modular architecture. Within single imaged fields of view, V1 contained multiple discrete circuits that were overlapping and highly interdigitated but were still distinct from one another. The majority of neurons that were shared between circuits displayed peri-event spiking activity whose timing was specific to the active circuit, whereas spike times for a smaller percentage of neurons were invariant to circuit identity. These data provide evidence that V1 microcircuitry exhibits balanced dynamics, is efficiently arranged in anatomical space, and is capable of supporting a diversity of multineuron spike firing patterns from overlapping sets of neurons.
Keywords: circuitry; connectivity; cortex; graphs; two-photon; visual.
Copyright © 2014 the authors 0270-6474/14/347769-09$15.00/0.
Figures
Similar articles
-
Analysis of graph invariants in functional neocortical circuitry reveals generalized features common to three areas of sensory cortex.PLoS Comput Biol. 2014 Jul 10;10(7):e1003710. doi: 10.1371/journal.pcbi.1003710. eCollection 2014 Jul. PLoS Comput Biol. 2014. PMID: 25010654 Free PMC article.
-
Scaling of topologically similar functional modules defines mouse primary auditory and somatosensory microcircuitry.J Neurosci. 2013 Aug 28;33(35):14048-60, 14060a. doi: 10.1523/JNEUROSCI.1977-13.2013. J Neurosci. 2013. PMID: 23986241 Free PMC article.
-
Emergence of feature-specific connectivity in cortical microcircuits in the absence of visual experience.J Neurosci. 2014 Jul 16;34(29):9812-6. doi: 10.1523/JNEUROSCI.0875-14.2014. J Neurosci. 2014. PMID: 25031418 Free PMC article.
-
Specificity and randomness in the visual cortex.Curr Opin Neurobiol. 2007 Aug;17(4):401-7. doi: 10.1016/j.conb.2007.07.007. Epub 2007 Aug 27. Curr Opin Neurobiol. 2007. PMID: 17720489 Free PMC article. Review.
-
Mouse vision as a gateway for understanding how experience shapes neural circuits.Front Neural Circuits. 2014 Oct 2;8:123. doi: 10.3389/fncir.2014.00123. eCollection 2014. Front Neural Circuits. 2014. PMID: 25324730 Free PMC article. Review.
Cited by
-
Spontaneous activations follow a common developmental course across primary sensory areas in mouse neocortex.J Neurophysiol. 2016 Aug 1;116(2):431-7. doi: 10.1152/jn.00172.2016. Epub 2016 May 4. J Neurophysiol. 2016. PMID: 27146981 Free PMC article.
-
Intrinsic dynamics of randomly clustered networks generate place fields and preplay of novel environments.Elife. 2024 Oct 18;13:RP93981. doi: 10.7554/eLife.93981. Elife. 2024. PMID: 39422556 Free PMC article.
-
The diversity and specificity of functional connectivity across spatial and temporal scales.Neuroimage. 2021 Dec 15;245:118692. doi: 10.1016/j.neuroimage.2021.118692. Epub 2021 Oct 29. Neuroimage. 2021. PMID: 34751153 Free PMC article. Review.
-
Analysis of graph invariants in functional neocortical circuitry reveals generalized features common to three areas of sensory cortex.PLoS Comput Biol. 2014 Jul 10;10(7):e1003710. doi: 10.1371/journal.pcbi.1003710. eCollection 2014 Jul. PLoS Comput Biol. 2014. PMID: 25010654 Free PMC article.
-
Differential Excitability of PV and SST Neurons Results in Distinct Functional Roles in Inhibition Stabilization of Up States.J Neurosci. 2021 Aug 25;41(34):7182-7196. doi: 10.1523/JNEUROSCI.2830-20.2021. Epub 2021 Jul 12. J Neurosci. 2021. PMID: 34253625 Free PMC article.
References
Publication types
MeSH terms
Substances
Grants and funding
LinkOut - more resources
Full Text Sources
Other Literature Sources