. 2014 Jun 4;34(23):7845-61.
doi: 10.1523/JNEUROSCI.2960-13.2014.

Genetically targeted binary labeling of retinal neurons

Affiliations

Genetically targeted binary labeling of retinal neurons

Yongling Zhu et al. J Neurosci. .

Abstract

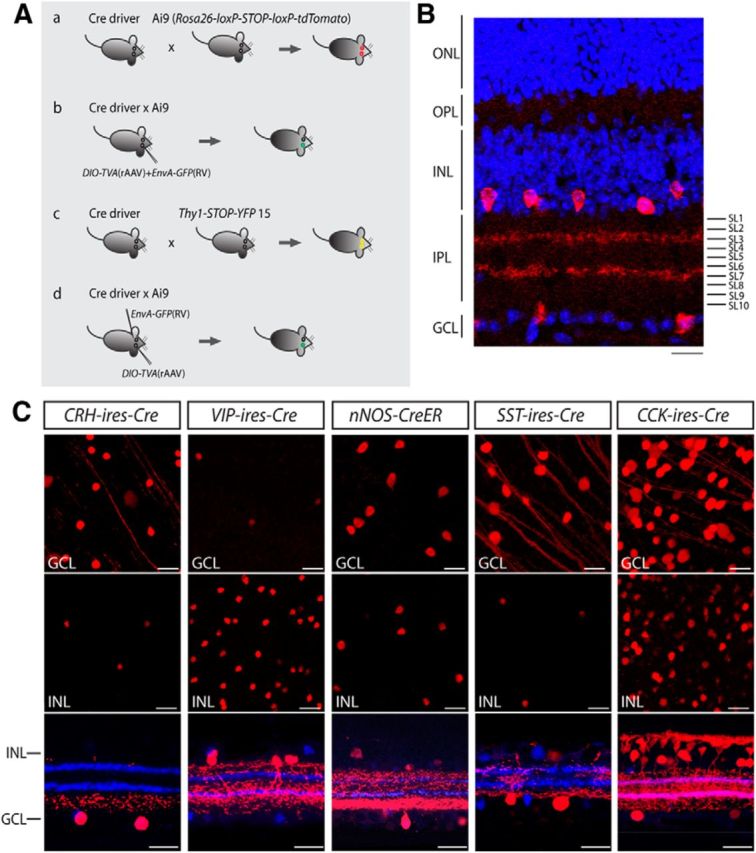
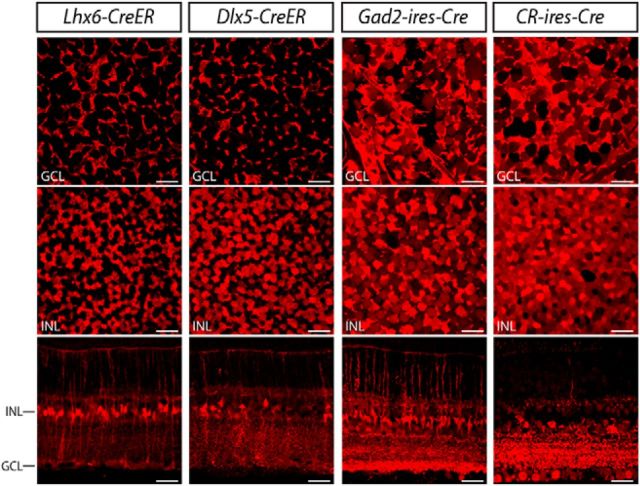
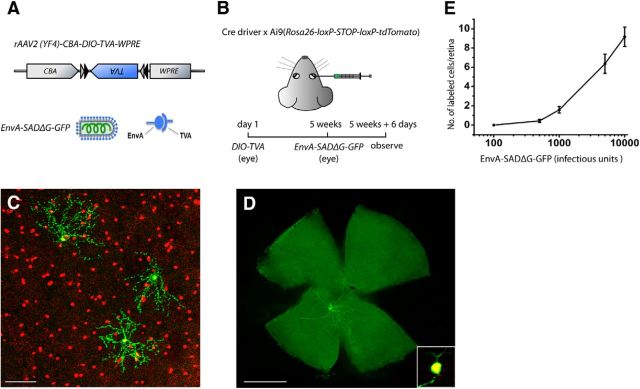
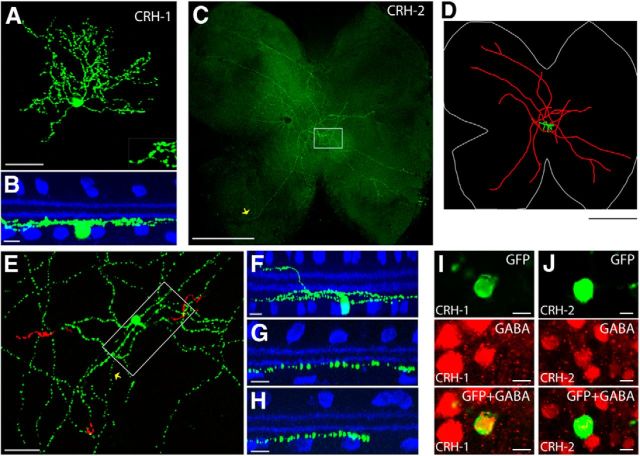
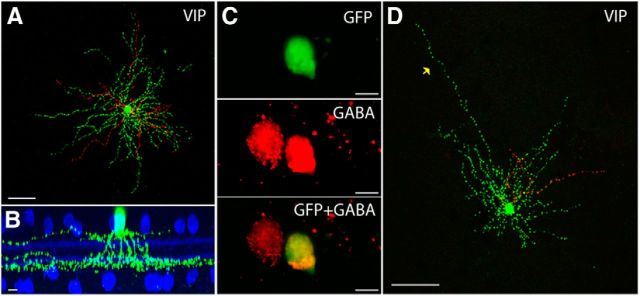
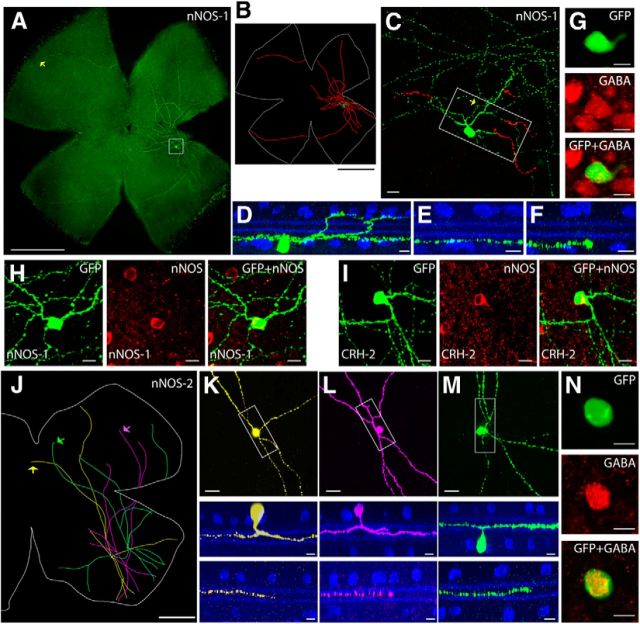
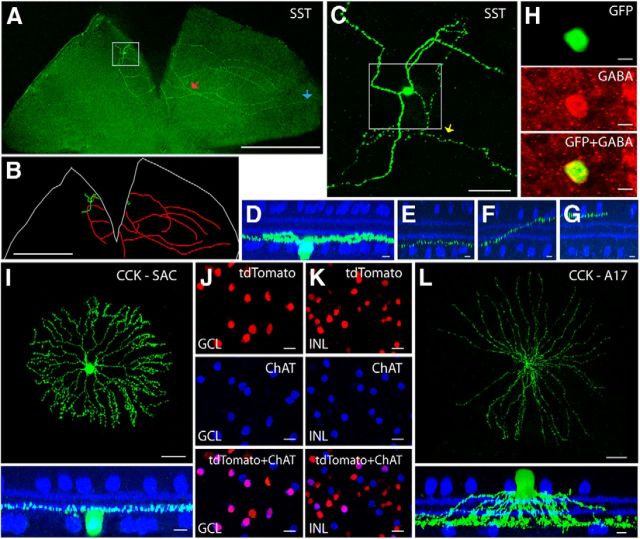
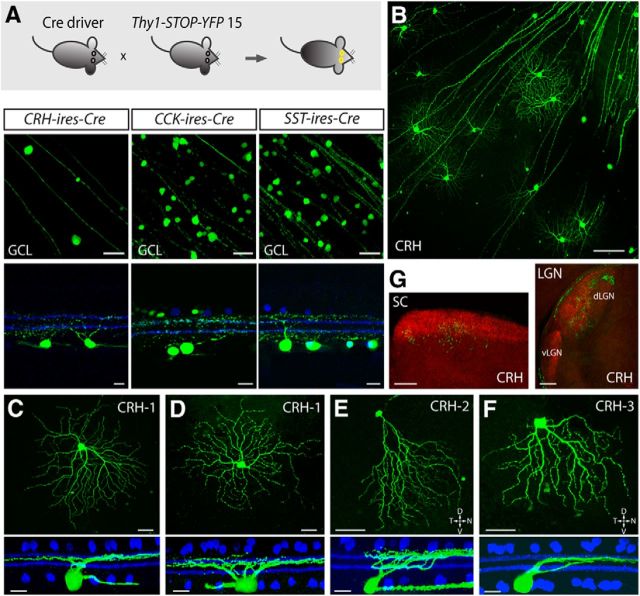
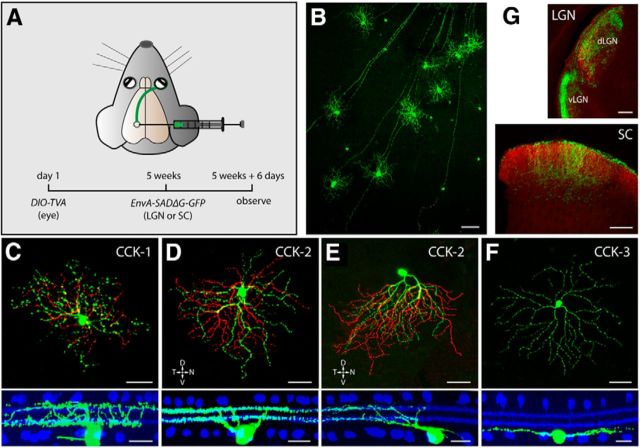
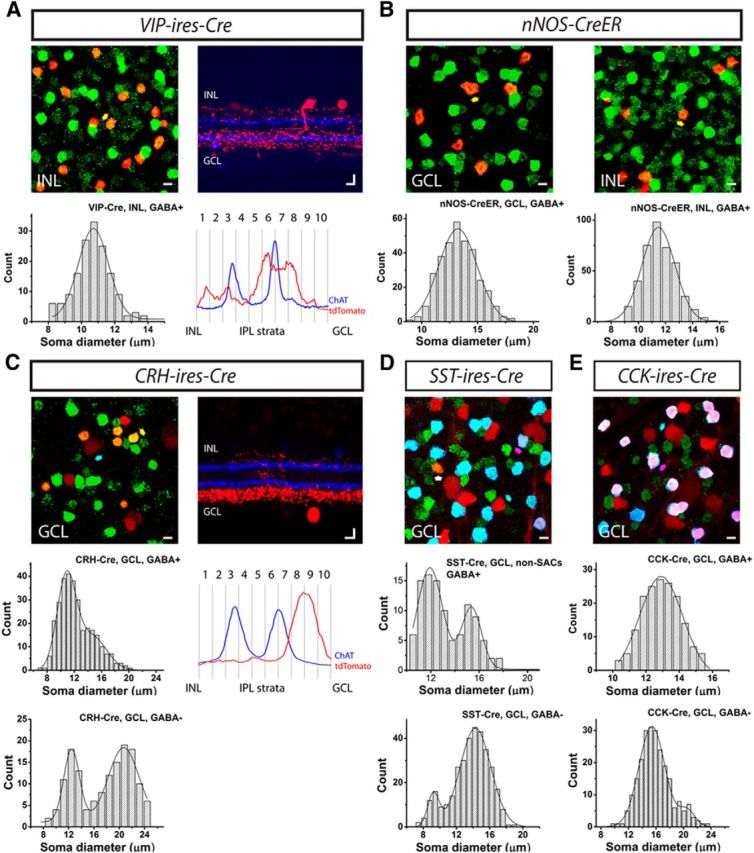
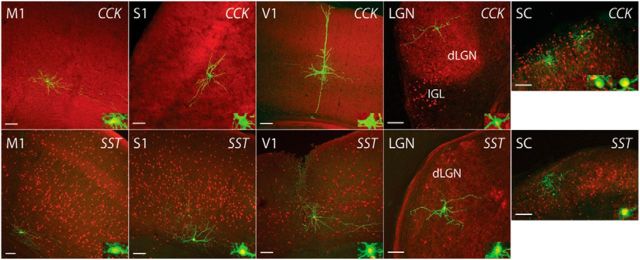
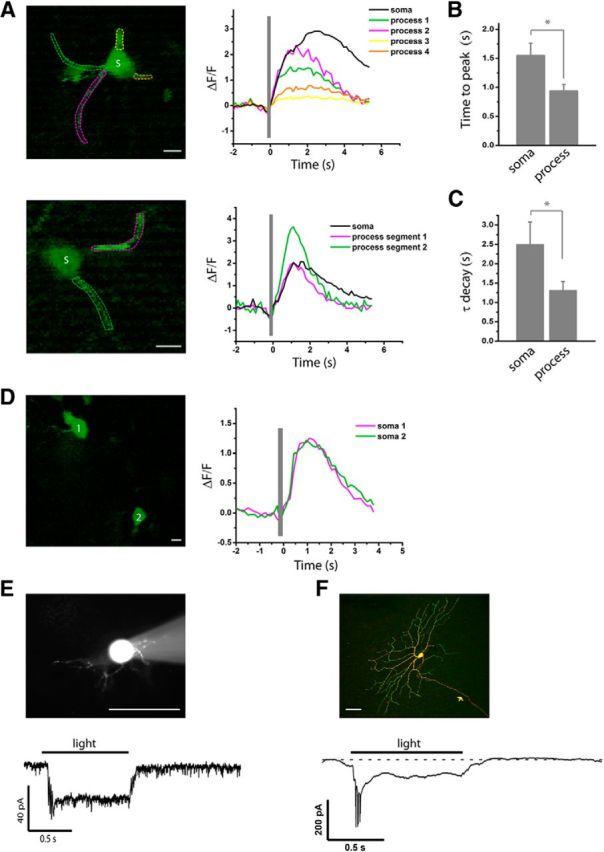
A major stumbling block to understanding neural circuits is the extreme anatomical and functional diversity of interneurons. Subsets of interneurons can be targeted for manipulation using Cre mouse lines, but Cre expression is rarely confined to a single interneuron type. It is essential to have a strategy that further restricts labeling in Cre driver lines. We now describe an approach that combines Cre driver mice, recombinant adeno-associated virus, and rabies virus to produce sparse but binary labeling of select interneurons--frequently only a single cell in a large region. We used this approach to characterize the retinal amacrine and ganglion cell types in five GABAergic Cre mouse (Mus musculus) lines, and identified two new amacrine cell types: an asymmetric medium-field type and a wide-field type. We also labeled several wide-field amacrine cell types that have been previously identified based on morphology but whose connectivity and function had not been systematically studied due to lack of genetic markers. All Cre-expressing amacrine cells labeled with an antibody to GABA. Cre-expressing RGCs lacked GABA labeling and included classically defined as well as recently identified types. In addition to the retina, our technique leads to sparse labeling of neurons in the cortex, lateral geniculate nucleus, and superior colliculus, and can be used to express optogenetic tools such as channelrhodopsin and protein sensors such as GCaMP. The Cre drivers identified in this study provide genetic access to otherwise hard to access cell types for systematic analysis including anatomical characterization, physiological recording, optogenetic and/or chemical manipulation, and circuit mapping.

Keywords: Cre recombinase; amacrine cell; ganglion cell; rabies virus; retina.


Figures

Figure 1.
Figure 1.
Mouse lines with Cre predominantly expressed in inner retinal neurons. A, Screening strategies for cell type-specific expression of Cre in the inner retina. The distribution of Cre-expressing cells was examined by crossing each Cre driver with Ai9 reporter mice (a), followed by cell type-specific labeling of amacrine cells with intravitreal injection of a rAAV that codes for a floxed TVA and an EnvA-pseudotyped rabies virus carrying GFP (b). Cre expression in ganglion cells was evaluated by crossing each line with Thy1-STOP-YFP 15 mice (c). To individually label ganglion cells, a rAAV encoding for a floxed TVA was introduced into the eye of the Cre × Ai9 mice, and EnvA-pseudotyped rabies virus carrying GFP was subsequently applied to ganglion cell axonal terminals in a retino-recipient area such as the LGN or SC (d). B, Organization of the retina and definition of IPL stratification. A vertical section of mouse retina labeled with the nuclear stain TO-PRO-3 (blue) and antibodies to ChAT (red). The level of stratification was defined as 0–100% from the border of the INL to the border of the GCL. The positions of ON and OFF-ChAT bands were estimated at 60% and 27% of the IPL, respectively. The IPL can be further divided into 10 equal strata or sublaminae (SL1–SL10) in which the ChAT bands occupy SL3 and SL7. ONL, Outer nuclear layer; OPL, outer plexiform layer. Scale bar, 25 μm. C, Distribution of Cre-expressing cells in the CRH-ires-Cre, VIP-ires-Cre, nNOS-CreER, SST-ires-Cre, and CCK-ires-Cre retinas. Each driver was crossed with Ai9 mice (Rosa26-lox-stop-lox-tdTomato) as shown in Aa). TdTomato-labeled cells are shown in the GCL (top), the INL (middle), and vertical sections with ChAT (blue; bottom). Scale bar 25 μm.
Figure 2.
Figure 2.
Distribution of Cre-expressing cells in the Lhx6-CreER, Dlx5-CreER, Gad2-ires-Cre, and CR-ires-Cre retinas. Each driver was crossed with Ai9 mice. TdTomato-labeled cells were located in the GCL (top) and the INL (middle panels) in both flat-mount (top and middle) and vertical sections (bottom). CreER in the Lhx6-CreER and Dlx5-CreER drivers was activated with tamoxifen injections. Scale bar, 25 μm.
Figure 3.
Figure 3.
Labeling strategy for single-cell analysis. A, rAAV and pseudotyped rabies virus used for intravitreal injections. B, Scheme of experimental design. C, Three GFP medium-field amacrine cells were discretely labeled in a retina. The image shows an overlay of GFP (green) and tdTomato labeling (red). Note the colocalization of GFP and tdTomato in the somata. Scale bar 100 μm. D, A single wide-field amacrine cell was labeled in a different retina. The image is shown as GFP labeling alone. Inset, Coexpression of GFP (green) and tdTomato (red) in the soma. Scale bar, 1 mm. Retinas in C and D are from CRH-ires-Cre × Ai9 mice. E, Dose-dependent labeling of Cre-expressing cells in the CRH-ires-Cre driver by the rAAV/EnvA rabies virus combination. Because labeling density is more sensitive to the dose of EnvA rabies virus than to that of rAAV, we fixed the amount of rAAV while adjusting the dose of EnvA rabies virus and measured the number of labeled cells/retina. A total of 5 × 10⁹ genome copies of rAAV2(YF4)-CBA-DIO-TVA were injected into an eye followed by a variable dose of EnvA-SADΔG-GFP (plotted on a logarithmic scale). Single-cell labeling occurred at 500 (0.44 ± 0.16 labeled cells/retina)–1000 (1.58 ± 0.34 labeled cells /retina) IU of EnvA-SADΔG-GFP. Data are presented as mean ± SEM (n = 13 retinas for 100 IU; n = 16 retinas for 500 IU; n = 12 retinas for 1000 IU; n = 14 retinas for 5000 IU, and n = 6 retinas for 10,000 IU).
Figure 4.
Figure 4.
The CRH-ires-Cre driver targets two amacrine cell types. A, B, CRH-1 amacrine cell. Flat-mount view of a CRH-1 amacrine cell is shown in A (inset shows the spiny dendrites), and side view with ChAT (blue) is shown in B. Scale bars: A, 50 μm; B, 10 μm. C–H, CRH-2 amacrine cell. A flat-mount retina with a single GFP-labeled CRH-2 wide-field amacrine cell is shown in C. Neurolucida tracing from C is shown in D, with the dendrites and soma drawn in green, the axon-like processes drawn in red, and the outline of the retina marked in white. The region around the soma (marked with the box in C) is enlarged in E, with soma and ON arbors labeled in green and OFF arbors pseudocolored in red. F, Side view with ChAT (blue) of a center region, including the soma, dendrites, and axon-like processes (boxed region in E). G, Side view of a proximal segment of the axon-like process near the soma (yellow arrow in E). H, Side view of a distal segment of the axon-like process (yellow arrow in C). I, J, CRH-1 (I) and CRH-2 (J) amacrine cells are both GABAergic. CRH amacrine cells (green) are colabeled with an antibody against GABA (red). scale bar 10 μm. Scale bars: C, D, 1 mm; E, in 50 μm; F–H, 10 μm.
Figure 5.
Figure 5.
The VIP-ires-Cre driver targets one amacrine cell type. A, A VIP-1 wide-field amacrine cell is shown in flat-mount view with soma and ON arbors labeled in green, and OFF arbors pseudocolored in red. Scale bar, 50 μm. B, Side view with ChAT (blue) of the cell in A. Scale bar, 10 μm. C, The VIP-1 amacrine cell is GABAergic. Scale bar, 10 μm. D, A VIP-1 amacrine cell with “tail” (yellow arrow). Soma and ON arbors are labeled in green and OFF arbors are labeled in red. Scale bar, 100 μm.
Figure 6.
Figure 6.
Labeling in the nNOS-CreER driver line. A, nNOS-1 wide-field amacrine cell. A single nNOS-1 wide-field amacrine cell was labeled in a whole-mount retina. Scale bar, 1 mm. B, Neurolucida tracing of A, with the dendrites and soma drawn in green, the axon-like processes drawn in red, and the outline of the retina marked in white. Scale bar, 1 mm. C, Enlarged view of the boxed region in A, with the soma and ON arbors labeled in green and the OFF arbors labeled in red. Scale bar, 50 μm. D, Side view with ChAT (blue) of the boxed region in C, including the soma, dendrites, and axon-like processes. E, Side view of a segment of axon-like process near the soma (yellow arrow in C). F, Side view of a distal segment of axon-like process (yellow arrow in A). Scale bars: D–F, 10 μm. G, The nNOS-1 amacrine cell is GABAergic. Scale bar, 10 μm. H, I, Both nNOS-1 and CRH-2 amacrine cells are positive for nNOS. Scale bars, 10 μm. J, Three nNOS-2 wide-field amacrine cells reconstructed from a projected image. Scale bar, 500 μm. K–M, Morphologies of nNOS-2 amacrine cells. Each cell was pseudocolored corresponding to J. Top, Enlarged view of a center region including the soma and nearby arbors. Scale bar, 20 μm. Side view with ChAT (blue) of the boxed region is shown in the middle. Scale bar, 10 μm. Bottom, Side view of the distal arbors (arrows in J). Scale bar, 10 μm. N, The nNOS-2 amacrine cell is GABAergic. Scale bar, 10 μm.
Figure 7.
Figure 7.
Labeling in the SST-ires-Cre and CCK-ires-Cre driver lines. A, A flat-mounted retina with a single-labeled SST-1 amacrine cell. Scale bar, 1 mm. B, Neurolucida tracing of A, with the dendrites and soma drawn in green, the axon-like processes drawn in red, and the outline of the retina marked in white. Scale bar, 1 mm. C, Enlarged view of the boxed region in A. Scale bar, 50 μm. D, The side views with ChAT (blue) of the boxed region in C, including the soma, dendrites, and axon-like processes. Scale bars, 10 μm. E–G, An axon-like process starts near the GCL (E, marked with the yellow arrow in C), extends across the IPL (F, red arrow in A), and finally runs near the INL (G, blue arrow in A). Scale bars, 10 μm. H, The SST-1 amacrine cell is GABAergic. Scale bar, 10 μm. I, The displaced amacrine cells in the CCK-ires-Cre driver are SACs. A GFP-labeled SAC is shown in the flat-mount view (top; scale bar, 50 μm), and the side view with ChAT (bottom; scale bar, 10 μm). J, K, Cre-positive SACs in the GCL (J) and INL (K). A retina from a CCK-ires-Cre × Ai9 mouse was stained with antibody against ChAT. Note that only a fraction of the SACs (labeled with ChAT) express Cre in the CCK-ires-Cre driver line. Scale bars, 20 μm. L, A17 amacrine cells were targeted in the CCK-ires-Cre driver line. An A17 cell was labeled with GFP. The flat-mount view is shown in the top (scale bar, 100 μm) and the side view with ChAT labeling is shown in the bottom (scale bar, 10 μm).
Figure 8.
Figure 8.
Cre-expressing RGCs in the CRH-ires-Cre driver line. A, Strategy for isolating Cre-expressing RGCs. Each Cre driver line was crossed with a Thy1-STOP-YFP 15 line (top). EYFP-labeled RGCs were observed in the CRH-ires-Cre, CCK-ires-Cre, and SST-ires-Cre lines, with flat-mount views shown in the middle (scale bar, 50 μm), and side views with ChAT (blue) shown in the bottom (scale bar, 10 μm). B, A flat-mount retina from a CRH-ires-Cre × Thy1-STOP-YFP 15 mouse. Scale bar, 100 μm. C–F, Morphology of different types of CRH-RGCs. Flat-mount views are shown in the top (scale bar, 50 μm), and side views with ChAT (blue) are shown in the bottom (scale bar, 20 μm). G, Coronal view of CRH-RGC axonal projections within the retino-recipient zone of the SC (left) and the dLGN (right). All the RGC axons from both eyes were labeled with CTb-594 (red); CRH-RGC axons were labeled with GFP (green). Scale bar, 200 μm.
Figure 9.
Figure 9.
Cre-expressing RGCs in the CCK-ires-Cre driver line. A, Strategy using rAAV/EnvA rabies virus to label CCK-RGCs from axonal terminals. B, GFP-labeled CCK-RGCs in a flat-mount retina from a CCK-ires-Cre mouse. Scale bar, 100 μm. C–F, Morphology of different types of CCK-RGCs. Flat-mount view of each type of RGC (green) are shown in the top, with soma and ON arbors labeled in green and OFF arbors pseudocolored in red. Scale bar, 50 μm. Side views with ChAT-band (blue) are shown in the bottom. Scale bars, 20 μm. G, Coronal view of CCK-RGC axonal terminals in the SC, the dLGN, and the vLGN. All RGC axons from both eyes are labeled with CTb-594 (red); CCK-RGC axons are labeled with GFP (green). Scale bar, 200 μm.
Figure 10.
Figure 10.
Evaluation of the completeness of labeling in Cre driver lines based on soma diameter and level of dendritic stratification. A–E, Five Cre driver lines, including VIP-ires-Cre (A), nNOS-ires-CreER (B), CRH-ires-Cre (C), SST-ires-Cre (D), and CCK-ires-Cre (E), were crossed with Ai9 reporter mice (tdTomato; red), and the retinas were further stained with an antibody against GABA (green). A, B, All tdTomato-labeled cells were GABAergic (GABA+; yellow arrow shows an example of somatic colocalization). C–E, In addition to GABAergic cells (yellow arrow), non-GABAergic cells (GABA−; cyan arrow) were also observed, with somata labeled with tdTomato, but not GABA. D, E, GABAergic cells were further separated with an antibody against ChAT (blue). Cells labeled with tdTomato, GABA, and ChAT were SACs (pink arrow), whereas cells labeled with tdTomato and GABA but not ChAT were non-SAC GABAergic cells (white arrow). Evidently, all of the GABAergic cells in the CCK-ires-Cre retina were SACs. The soma diameters of GABAergic cells (A–C) in the INL (A), GCL and INL (B), and GCL (C), and non-GABAergic cells (C–E), SACs (E), and non-SAC GABAergic cells (D) in the GCL were measured and plotted as distribution histograms. The histograms were fitted with either single or double Gaussian curves (see Table 3 for fit parameters). The non-GABAergic cells (presumptive RGCs) in the SST-ires-Cre line (D) were omitted from our classification due to the high abundance of labeled cell types, but their soma sizes were analyzed here for completeness. The IPL strata in the VIP-ires-Cre and CRH-ires-Cre were further analyzed in A and C. Vertical slices of the retinas were stained with an antibody against ChAT (blue), and 10 strata in the IPL were defined using the ChAT bands. Stratification of tdTomato-labeled arbors was quantified relative to the ChAT. Scale bar, 10 μm.
Figure 11.
Figure 11.
rAAV/EnvA rabies virus labels individual cells in the cerebral cortex and other brain regions. rAAV2(YF4)-CBA-DIO-TVA (1.5 × 10⁹ genome copies) and EnvA-SADΔG-GFP were injected into M1, S1,V1, LGN, and SC in two Cre drivers crossed with the Ai9 reporter: CCK-ires-Cre × Ai9 and SST-ires-Cre × Ai9. The doses of EnvA-SADΔG-GFP injected into each region were: 300 IU for M1, S1, V1, and SC in CCK-ires-Cre driver; 30 IU for M1, S1, V1, and SC in SST-ires-Cre driver; and 3 × 10³ IU for the LGN in both drivers. Cre expression in each region is revealed by tdTomato labeling (red); GFP labeling of individual cells is shown in green. Insets, Coexpression of GFP (green) and tdTomato (red) in the somata. Scale bars, 100 μm.
Figure 12.
Figure 12.
rAAV/EnvA rabies virus-mediated expression of GCaMP3 and ChR2 permits cell type-specific functional imaging and optogenetic manipulation in the retina. GCaMP3 or ChR2-venus was delivered to the retina by intravitreal injection of rAAV2(YF4)-CBA-DIO-TVA followed by either EnvA-SADΔG-GCaMP3 or EnvA-SADΔG-ChR2-venus. A–D, Light-evoked GCaMP3 responses recorded from Cre-expressing amacrine and ganglion cells. The visual stimulus was a brief light flash (timing shown by the gray bar). The fluorescence responses of the calcium indicator were imaged with a two-photon microscope. A, Light-evoked GCaMP3 responses recorded from the somas (S) and proximal processes of two CRH-2 amacrine cells. Regions of interest are marked by colored dashed lines, with corresponding traces presented in the same color. B, C, Comparison of rise (B) and decay (C) kinetics of GCaMP3 responses recorded from the soma and proximal processes of three CRH-2 amacrine cells including the two cells shown in A. Time to peak is measured from the end of light flash to the peak of fluorescence response. Decay time constant is calculated from a single exponential fit to each response. Data are presented as mean ± SEM (n = 3 for soma and n = 8 for process), *p < 0.05. D, Light-evoked GCaMP3 responses recorded from the somas of two CCK-RGCs. E, F, ChR2 enables light-controlled activation of Cre-expressing amacrine and ganglion cells. E, Sustained inward current recorded from a ChR2-positive CRH-1 amacrine cell (shown with sulforhodamine 101 fill during whole-cell recording) in response to a 470 ± 20 nm light stimulus (duration indicated by the horizontal bar). F, Current spikes followed by a sustained inward current recorded in a ChR2-positive CRH-RGC in response to the stimulus. The cell is shown with antibody staining after whole-cell recording and fixation. Green, ChR2-venus; red, Neurobiotin fill; arrow, RGC axon. For both E and F, the stimulus intensity was 3.05 W-cm−2. The currents were recorded in voltage clamp at a holding potential of −70 mV. The holding current in E was −31.5 pA and in F was −6.2 pA. Traces are averages of 3 or more responses. Scale bars: A, D, 10 μm; E, F, 50 μm (n = 8 cells from 3 mice for E and F).

Similar articles

Cited by

References

    1. Badea TC, Nathans J. Quantitative analysis of neuronal morphologies in the mouse retina visualized by using a genetically directed reporter. J Comp Neurol. 2004;480:331–351. doi: 10.1002/cne.20304. - DOI - PubMed
    1. Beier KT, Saunders A, Oldenburg IA, Miyamichi K, Akhtar N, Luo L, Whelan SP, Sabatini B, Cepko CL. Anterograde or retrograde transsynaptic labeling of CNS neurons with vesicular stomatitis virus vectors. Proc Natl Acad Sci U S A. 2011;108:15414–15419. doi: 10.1073/pnas.1110854108. - DOI - PMC - PubMed
    1. Borghuis BG, Tian L, Xu Y, Nikonov SS, Vardi N, Zemelman BV, Looger LL. Imaging light responses of targeted neuron populations in the rodent retina. J Neurosci. 2011;31:2855–2867. doi: 10.1523/JNEUROSCI.6064-10.2011. - DOI - PMC - PubMed
    1. Boyden ES, Zhang F, Bamberg E, Nagel G, Deisseroth K. Millisecond-timescale, genetically targeted optical control of neural activity. Nat Neurosci. 2005;8:1263–1268. doi: 10.1038/nn1525. - DOI - PubMed
    1. Buffelli M, Burgess RW, Feng G, Lobe CG, Lichtman JW, Sanes JR. Genetic evidence that relative synaptic efficacy biases the outcome of synaptic competition. Nature. 2003;424:430–434. doi: 10.1038/nature01844. - DOI - PubMed

Publication types

MeSH terms

LinkOut - more resources