. 2014 Jun 4;34(23):7886-98.
doi: 10.1523/JNEUROSCI.5068-13.2014.

How local excitation-inhibition ratio impacts the whole brain dynamics

Affiliations

How local excitation-inhibition ratio impacts the whole brain dynamics

Gustavo Deco et al. J Neurosci. .

Abstract

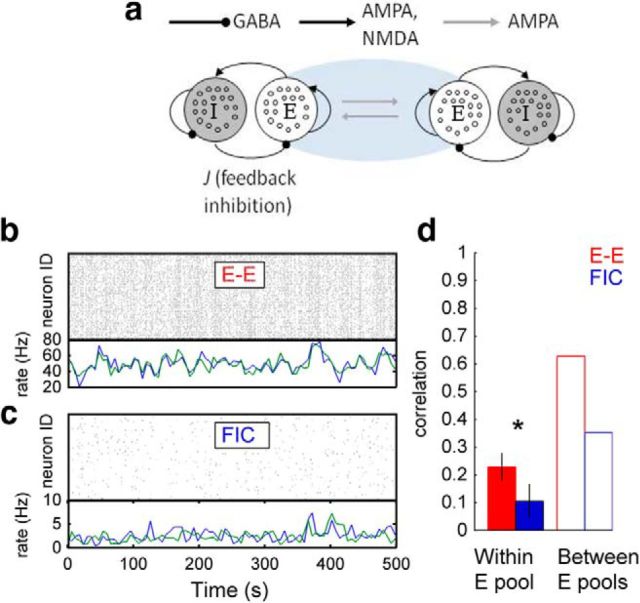
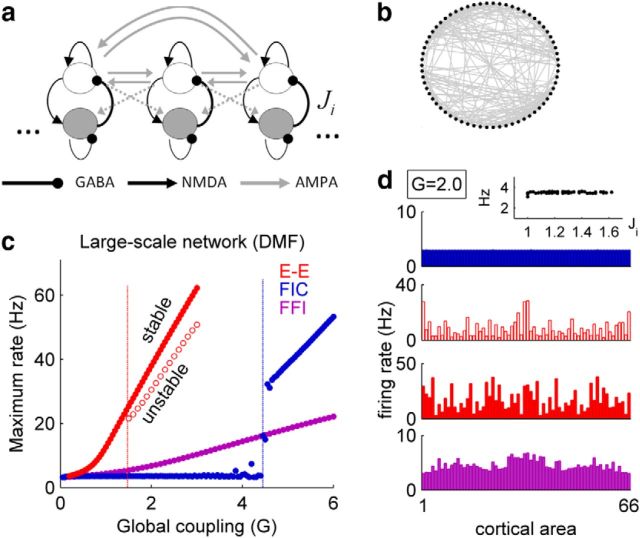
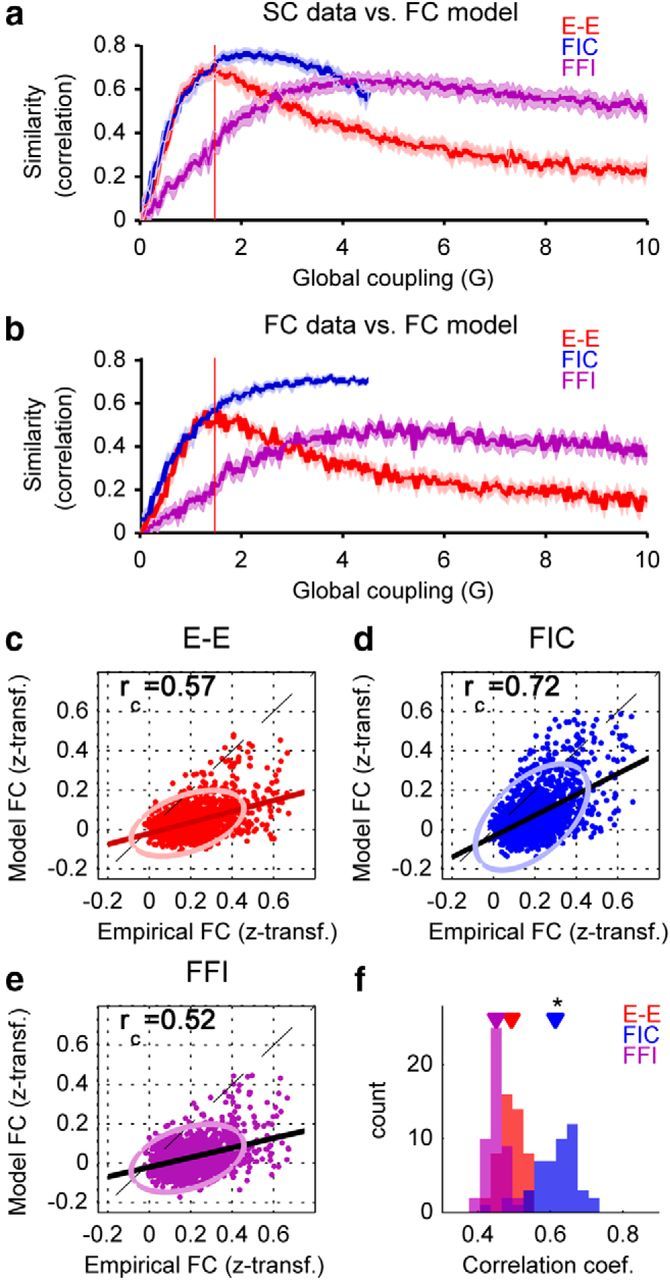
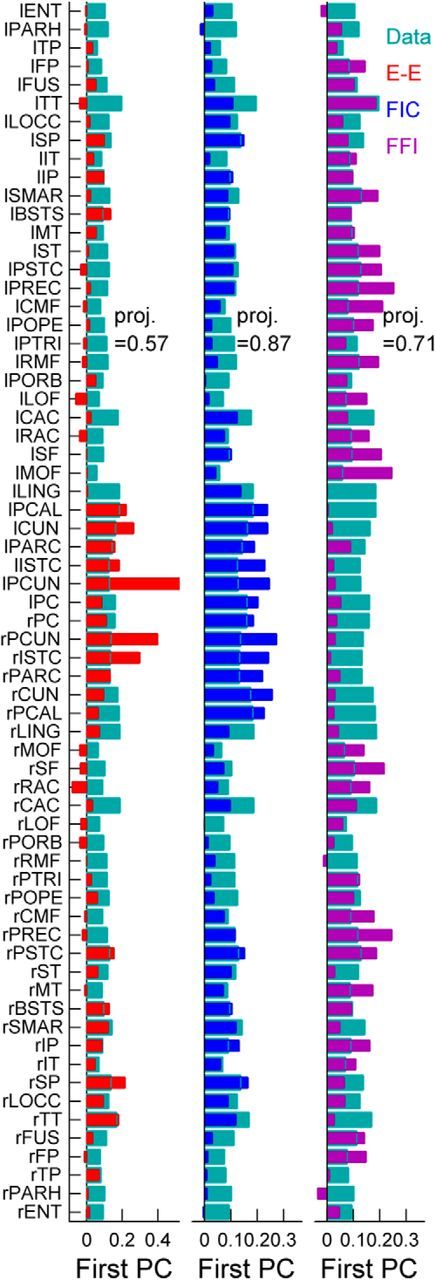
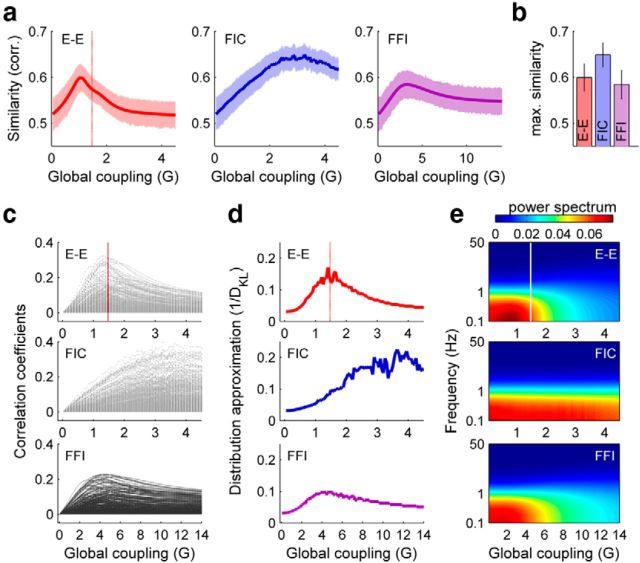
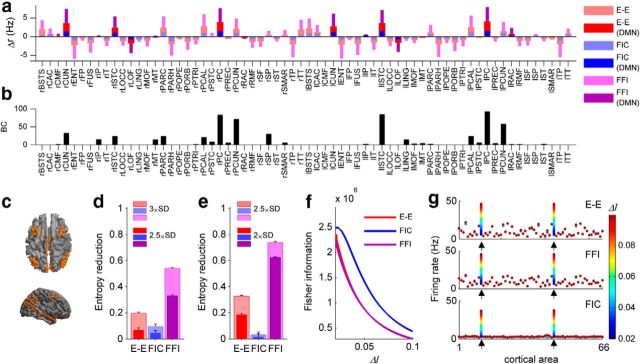
The spontaneous activity of the brain shows different features at different scales. On one hand, neuroimaging studies show that long-range correlations are highly structured in spatiotemporal patterns, known as resting-state networks, on the other hand, neurophysiological reports show that short-range correlations between neighboring neurons are low, despite a large amount of shared presynaptic inputs. Different dynamical mechanisms of local decorrelation have been proposed, among which is feedback inhibition. Here, we investigated the effect of locally regulating the feedback inhibition on the global dynamics of a large-scale brain model, in which the long-range connections are given by diffusion imaging data of human subjects. We used simulations and analytical methods to show that locally constraining the feedback inhibition to compensate for the excess of long-range excitatory connectivity, to preserve the asynchronous state, crucially changes the characteristics of the emergent resting and evoked activity. First, it significantly improves the model's prediction of the empirical human functional connectivity. Second, relaxing this constraint leads to an unrealistic network evoked activity, with systematic coactivation of cortical areas which are components of the default-mode network, whereas regulation of feedback inhibition prevents this. Finally, information theoretic analysis shows that regulation of the local feedback inhibition increases both the entropy and the Fisher information of the network evoked responses. Hence, it enhances the information capacity and the discrimination accuracy of the global network. In conclusion, the local excitation-inhibition ratio impacts the structure of the spontaneous activity and the information transmission at the large-scale brain level.

Keywords: anatomical connectivity; functional connectivity; large-scale brain model; local feedback inhibition; resting-state activity.


Figures

Figure 1.
Figure 1.
The effect of FIC on the spontaneous spiking activity of two coupled model areas. a, Two network brain areas model with symmetric connections through their corresponding excitatory pools. The local brain area models consist of 80% excitatory neurons and 20% inhibitory neurons recurrently connected such that when isolated the network emulates the neurophysiological characteristics of the empirical observed spontaneous state, i.e., low correlations between the spiking activities of the neurons and low firing rate at 3 Hz. In the FIC scenario, the feedback inhibition is adjusted to compensate the extra excitation the each excitatory pool receive when the brain areas model are connected. b, c, Spiking activity of excitatory units from one brain area without FIC (b, top) and with FIC (c, top). Due to symmetry, the spiking activity in the other brain area has the same statistics. The averaged activities of both excitatory pools are plotted in blue and green, for the model without FIC (b, bottom) and the model with FIC (c, bottom). d, Filled bars, Mean correlation coefficient (±SEM) across all pairwise correlations within one excitatory pool, without and with FIC (red and blue, respectively). Open bars, Correlation between the mean firing rates of both excitatory pools, without and with FIC (red and blue, respectively).
Figure 2.
Figure 2.
The effect of FIC on the spontaneous mean-field activity of the large-scale brain model. a, A dynamic mean field (DMF) reduction of the model was used to study the large-scale model of the brain, composed of N nodes, each containing one excitatory and one inhibitory neural population. The inter-area connections are established as long range synaptic AMPA-mediated instantaneous connections between the excitatory pools in those areas. In the case of the model with feedforward inhibition (FFI) long-range synaptic AMPA-mediated instantaneous connections from the excitatory pool of a given area to the inhibitory pool of a different area were also considered (dashed arrows). Inter-areal connections are weighted by the strength specified in the neuroanatomical matrix SC, denoting the density of fibers between those regions, and scaled by a global factor G. The local recurrent excitation is NMDA-mediated. In the FIC condition, the local feedback inhibition (Ji) was adjusted such that the excitatory pool of each local brain area has a low firing rate ∼3 Hz. b, Adjacency matrix of the neuroanatomical connectivity. c, Attractor landscape as a function of the global coupling strength G, for the three large-scale models, (E–E: long-range excitatory–excitatory connections; FIC: long-range excitatory–excitatory connections and local feedback inhibition regulation; FFI long-range excitatory–excitatory connections and long-range feedforward inhibition). Each point represents the maximum firing rate activity among all excitatory pools. In the E–E model, for low values of G, the network converges to a single stable state; for G > 1.47 (vertical line), a bifurcation appears whereby a new unstable state coexists together with the spontaneous state. In the FIC model, for G < 4.45, the optimization of feedback inhibition weights makes the network to converge to a single stable state of low firing activity; for G > 4.45, the low firing activity solution becomes unstable. In the FFI model the maximum firing rate monotonically increases as a function of G. d, The stationary-state of excitatory pools (firing rate vector of dimension N = 66) is shown for G = 2.0 for the three large-scale DMF models. Blue, FIC model (stable state); the inset shows the stationary firing rates as a function of the local feedback inhibition strength; red, E–E model (stable state); red, open bars, E–E model (unstable state); magenta, FFI model (stable-state).
Figure 3.
Figure 3.
Model prediction of the empirical functional connectivity. a, The similarity (correlation coefficient) between the empirical anatomical connectivity (SC) matrix and the model FC was calculated, as a function of the global coupling parameter G, for the three different models. In the E-E model, the highest correlation is achieved at the edge of the bifurcation (dashed vertical red line). Shaded areas represent the 95% confidence interval of the similarity measure. b, Similarity (correlation coefficient) between the empirical fMRI FC and the model FC as a function of the global coupling parameter G, for the three models. Shaded areas represent the 95% confidence interval of the similarity measure. c–e, Comparison between the empirical FC matrix and the FC generated by each of the three models, E–E (c), FIC (d), and FFI (e), for the corresponding optimal values of G, equal to G = 1.3, G = 3.3, and G = 4.7, respectively. Solid lines indicate linear regressions. Ellipses are 95% confidence ellipses. rc indicates the level of similarity reach for each model. f, For each individual fMRI scanning session the FC was predicted after optimization of the parameter G using the FC matrix averaged over the remaining 47 scanning sessions. The distribution of similarity measures is presented for each of the three models. The mean similarity is significantly higher for the FIC model compared with the mean similarity of models E–E and FFI (ANOVA, *p < 10−7).
Figure 4.
Figure 4.
Prediction of the principal mode. The first PC of the empirical covariance matrix of BOLD signals (turquoise) and the first PC of the model covariance matrix generated by each of the three models, for the corresponding optimal values of G. The projection (scalar product) between the first PC of the empirical data and the first PC of model data are equal to 0.57 ± 0.05, 0.87 ± 0.02, and 0.71 ± 0.03 for the E–E, FIC, and FFI models, respectively.
Figure 5.
Figure 5.
Linear fluctuations. a, Similarity (correlation coefficient) between the empirical BOLD FC and the correlation structure of gating variables as obtained by the moments' method, for the three models. Shaded areas represent the 95% confidence interval of the similarity measure. In the FIC case, the same local feedback inhibition weights (Ji) used in Figure 2a,b were used here. b, Comparison of the maximum similarity between the empirical BOLD FC and the correlation structure of gating variables for the three models. c, Correlation coefficients of all pairwise correlations between excitatory gating variables of the 66 cortical areas as a function of the global coupling G, for the three models. Top, The red line indicates the bifurcation of the E–E model. d, Inverse of the Kullback–Leibler divergence (DKL) between the empirical distribution of correlation coefficients and the distribution of correlation coefficients between gating variables for each model. e, Mean power spectrum of the excitatory gating variables as a function of the global coupling G, for the three different models. Top, The white line indicates the bifurcation of the E–E model.
Figure 6.
Figure 6.
The effect of FIC on the evoked activity of the large-scale brain model. a, Mean activity in each local brain area (with respect to the activity averaged over all brain areas) for each model obtained in response to 1000 different hypothetical task conditions. Tasks were simulated by imposing an external input Iexternal = 0.02 to the excitatory population of 10% of the brain areas, randomly selected. Dark colors indicate the areas composing the default mode network. b, Betweenness centrality (BC) of each brain area. BC was calculated from the anatomical connectivity matrix. It represents the number of shortest paths passing through a given node. c, The default mode network is composed of midline frontal and parietal areas, posterior inferior parietal lobule, and medial and lateral temporal lobe regions. d, The entropy Hevoked of evoked binary patterns was calculated for different activity thresholds, defined as θ.SD, were SD is the standard deviation across all possible evoked responses. Bars indicate the reduction of entropy ΔH, for the three different models, for different values of θ (θ = 2.5, 3, or 4). ΔH was defined as ΔH = (HmaxHevoked)/Hmax, where Hmax is the maximum entropy for the set of n patterns, i.e., Hmax = log2(n). Error bars indicate estimation errors (50%) given by the quadratic extrapolation procedure, used for the entropy sampling bias correction. e, Entropy reduction when external stimuli are imposed to both the excitatory and the inhibitory populations. The values of θ are lower than in (d) to avoid patterns with null entries. f, The encoding accuracy of the models was calculated using the FI. The FI was calculated for various stimulus intensities (ΔI). The stimulus was applied to the excitatory population of both right and left LOCC; i.e., Iexternal = ΔI for rLOCC and lLOCC, and Iexternal = 0 for all other cortical areas. g, Evoked response of the network for the E–E model (top), the FFI model (middle), and for the FIC model (bottom). The colors indicate the intensity (ΔI) of the applied stimulus. The arrows indicate the stimulated nodes.

Similar articles

Cited by

References

    1. Abbott LF, Dayan P. The effect of correlated variability on the accuracy of a population code. Neural Comput. 1999;11:91–101. doi: 10.1162/089976699300016827. - DOI - PubMed
    1. Achard S, Salvador R, Whitcher B, Suckling J, Bullmore E. A resilient, low-frequency, small-world human brain functional network with highly connected association cortical hubs. J Neurosci. 2006;26:63–72. doi: 10.1523/JNEUROSCI.3874-05.2006. - DOI - PMC - PubMed
    1. Allen EA, Damaraju E, Plis SM, Erhardt EB, Eichele T, Calhoun VD. Tracking whole-brain connectivity dynamics in the resting state. Cereb Cortex. 2014;24:663–676. doi: 10.1093/cercor/bhs352. - DOI - PMC - PubMed
    1. Bar M. The proactive brain: memory for predictions. Philos Trans R Soc Lond B Biol Sci. 2009;364:1235–1243. doi: 10.1098/rstb.2008.0310. - DOI - PMC - PubMed
    1. Barth AL, Poulet JF. Experimental evidence for sparse firing in the neocortex. Trends Neurosci. 2012;35:345–355. doi: 10.1016/j.tins.2012.03.008. - DOI - PubMed

Publication types