Comparative Study
. 2014 Apr 1;37(4):753-61.
doi: 10.5665/sleep.3584.

Ecology and neurophysiology of sleep in two wild sloth species

Affiliations
Comparative Study

Ecology and neurophysiology of sleep in two wild sloth species

Bryson Voirin et al. Sleep. .

Abstract

Study objectives: Interspecific variation in sleep measured in captivity correlates with various physiological and environmental factors, including estimates of predation risk in the wild. However, it remains unclear whether prior comparative studies have been confounded by the captive recording environment. Herein we examine the effect of predation pressure on sleep in sloths living in the wild.

Design: Comparison of two closely related sloth species, one exposed to predation and one free from predation.

Setting: Panamanian mainland rainforest (predators present) and island mangrove (predators absent).

Participants: Mainland (Bradypus variegatus, five males and four females) and island (Bradypus pygmaeus, six males) sloths.

Interventions: None.

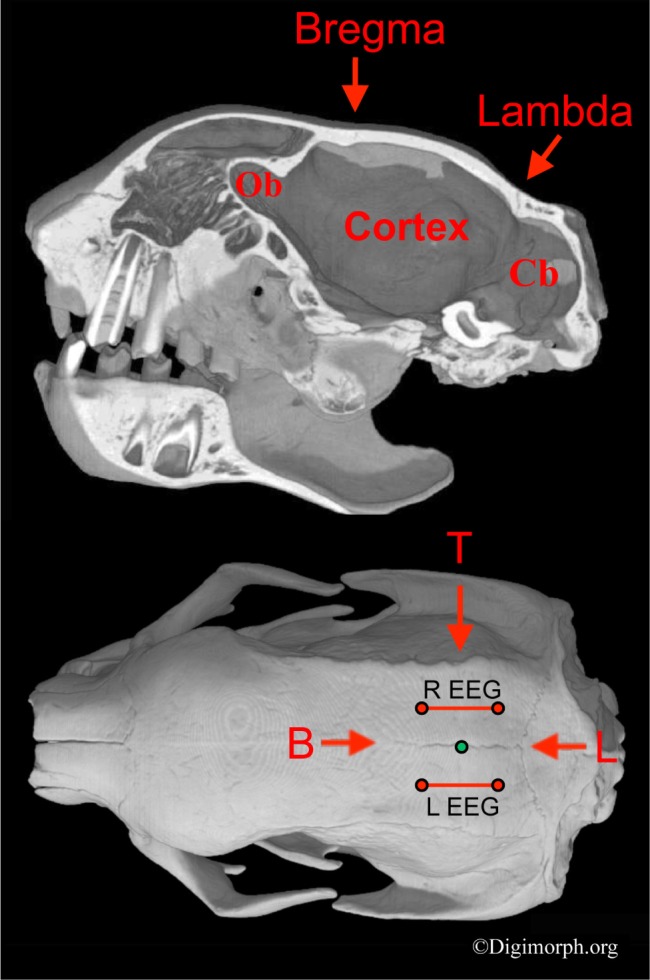
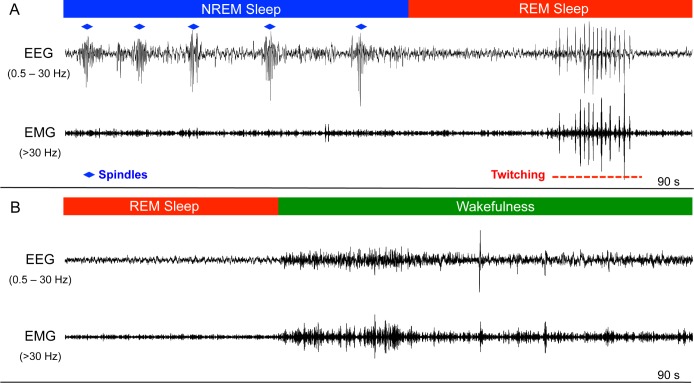
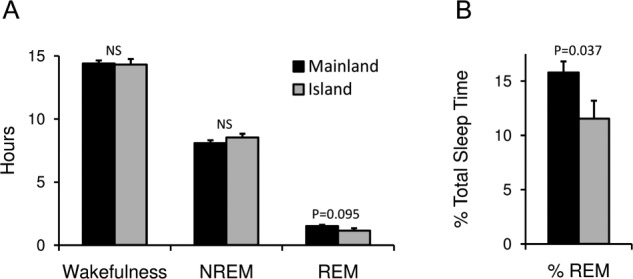
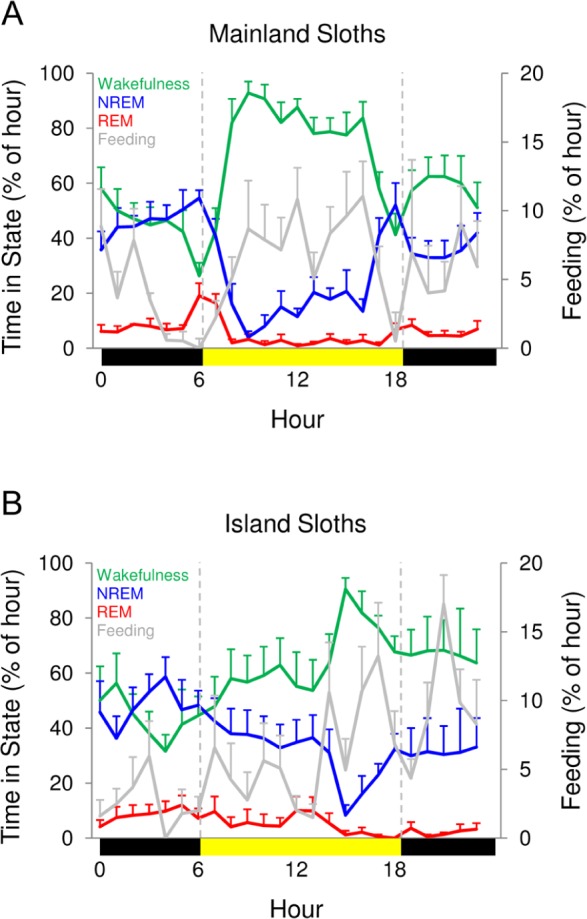
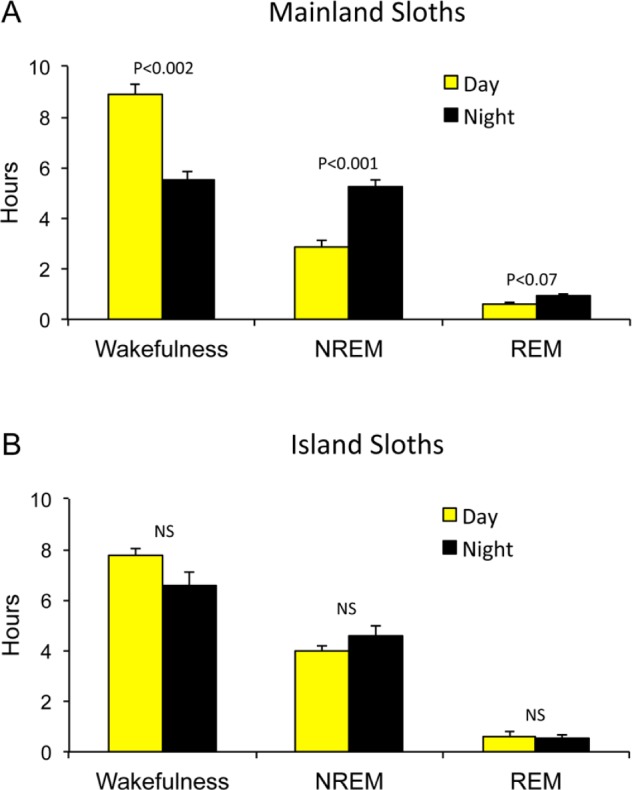
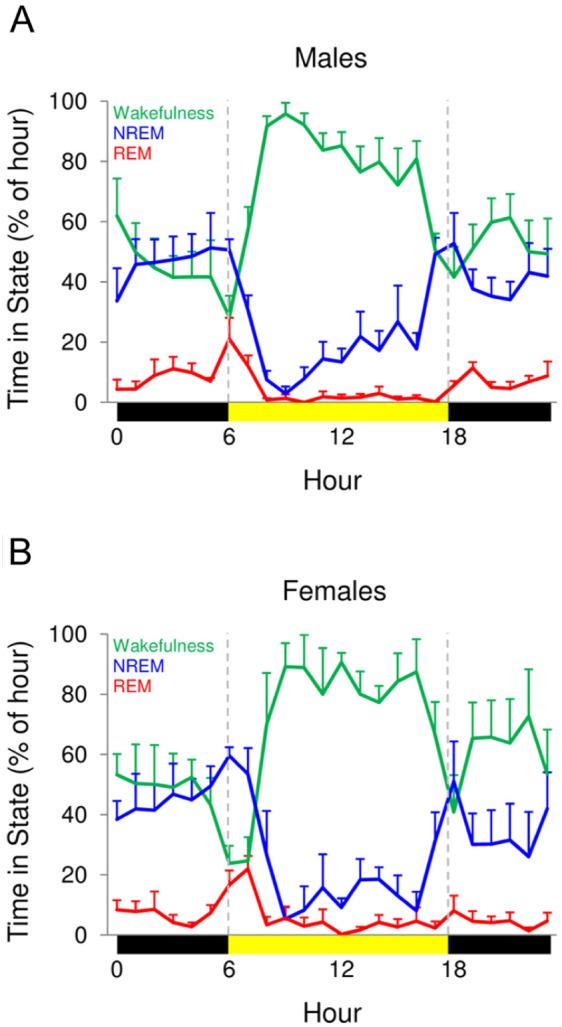
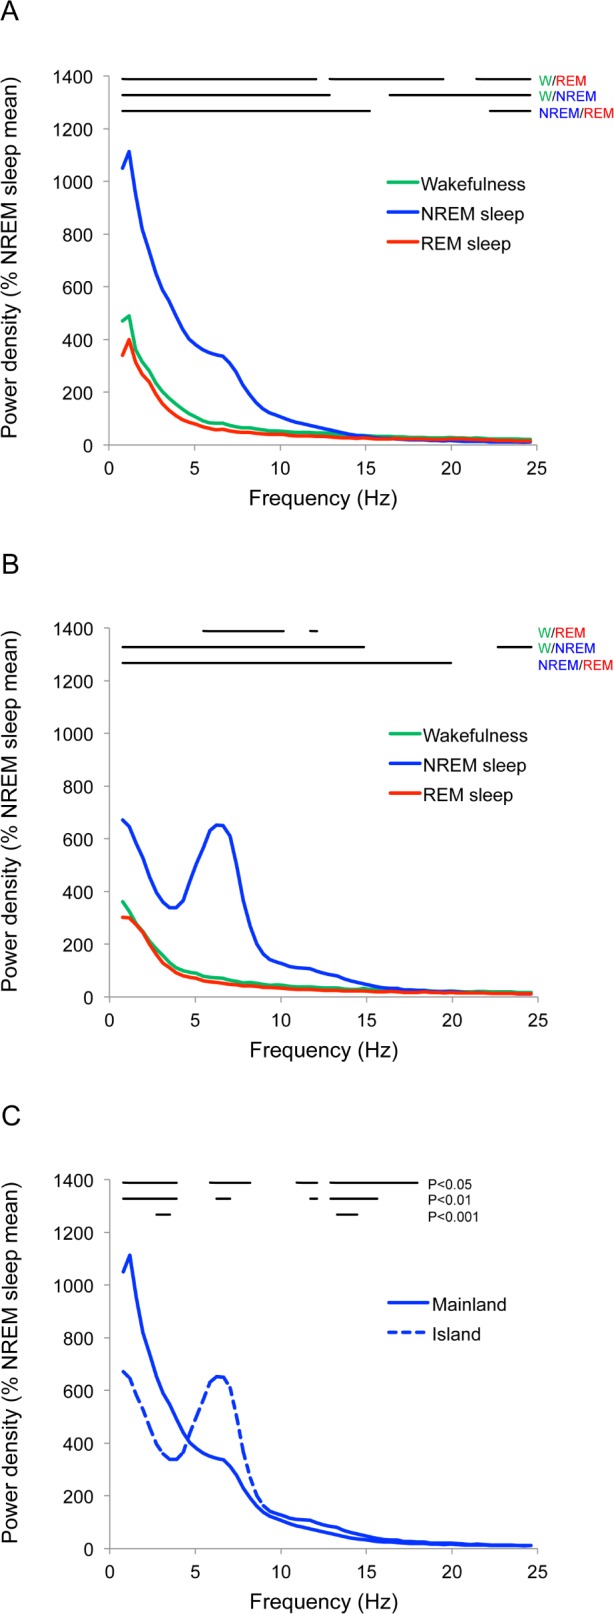
Measurements and results: Electroencephalographic (EEG) and electromyographic (EMG) activity was recorded using a miniature data logger. Although both species spent between 9 and 10 h per day sleeping, the mainland sloths showed a preference for sleeping at night, whereas island sloths showed no preference for sleeping during the day or night. Standardized EEG activity during nonrapid eye movement (NREM) sleep showed lower low-frequency power, and increased spindle and higher frequency power in island sloths when compared to mainland sloths.

Conclusions: In sloths sleeping in the wild, predation pressure influenced the timing of sleep, but not the amount of time spent asleep. The preference for sleeping at night in mainland sloths may be a strategy to avoid detection by nocturnal cats. The pronounced differences in the NREM sleep EEG spectrum remain unexplained, but might be related to genetic or environmental factors.

Keywords: Benzodiazepine; EEG; NREM sleep; REM sleep; phasing; predation; sloth; spindle; wild.


Figures

Figure 1
Figure 1
Sagittal cross section (top) and dorsal view (bottom) of Bradypus variegatus' (CT image) skull showing electrode placement. Electroencephalogram (EEG) electrodes (red dots) and bipolar EEG derivations (red lines) are shown relative to bregma (B), lambda (L), and the most dorsal point of attachment of the temporalis muscle (T). The green dot shows the ground electrode. The sagittal cross-section through the midline shows the concavities overlying the cranial sutures bregma and lambda, and their positions relative to the underlying brain case. These surface concavities were palpable through the skin and used as landmarks. Given that the skull structure of B. pygmaeus and B. variegatus are very similar, the same landmarks were used to position the electrodes in both species. The electrode placement was scaled to the size of the individual's skull. Ob, olfactory bulb; Cb, cerebellum. CT images provided with permission from Digimorph.org.
Figure 2
Figure 2
Brown-throated three-toed sloth equipped with an encephalo-graphic logger (black hat).
Figure 3
Figure 3
Electroencephalographic (EEG) recordings from Bradypus pygmaeus. (A) EEG recording (90 sec) showing a period of nonrapid eye movement (NREM) sleep transitioning into rapid eye movement (REM) sleep. NREM sleep was characterized by frequent high-amplitude spindles (blue diamonds) and slow waves. During REM sleep, a stereotypical and rhythmic “twitching” artifact is visible. (B) Transition from REM sleep to wakefulness characterized by an abrupt increase in tonic electromyogram (EMG) artifact in the EEG signal. The EMG signal was obtained by high-pass (> 30 Hz) filtering the EEG signal.
Figure 4
Figure 4
Time spent in each state. (A) Number of hours spent in wakefulness, nonrapid eye movement (NREM) sleep, and rapid eye movement (REM) sleep in mainland (black) and island (gray) sloths. (B) REM sleep as a percentage of total sleep time for the two sloth species. Error bars show standard error of the mean.
Figure 5
Figure 5
Hourly time spent in each state. The percentage of time spent in wakefulness (green), nonrapid eye movement (NREM) sleep (blue), and rapid eye movement (REM) sleep (red) for each hour for (A) mainland and (B) island sloths. The bars on the x-axis mark day (sunrise to sunset, yellow) and night (sunset to sunrise, black). Data reflect averages of all 3 days for each sloth. Percentage of time spent feeding (gray) is plotted on the secondary y-axis. Values for a given hour are plotted at the start of the hour. Error bars show standard error of the mean.
Figure 6
Figure 6
Time spent in the three states during the day and night. Time spent in wakefulness, nonrapid eye movement (NREM) sleep, and rapid eye movement (REM) sleep during the day (sunrise to sunset, yellow) and night (sunset to sunrise, black) for (A) mainland and (B) island sloths. Error bars show standard error of the mean.
Figure 7
Figure 7
Hourly time spent in each state for male and female mainland sloths. The percentage of time spent in wakefulness (green), nonrapid eye movement (NREM) sleep (blue), and rapid eye movement (REM) sleep (red) for each hour for (A) male and (B) female mainland sloths. The bars on the x-axis mark day (sunrise to sunset, yellow) and night (sunset to sunrise, black). Data reflects averages of all 3 days for each sloth. Values for a given hour are plotted at the start of the hour. Error bars show standard error of the mean.
Figure 8
Figure 8
Standardized EEG power density for each state. (A) Mainland sloths and (B) island sloths during wakefulness (green), nonrapid eye movement (NREM) sleep (blue), and rapid eye movement (REM) sleep (red). Lines at the top show significant (paired, two-tailed t-test, P < 0.05) differences between states. (C) Standardized NREM sleep power density from (A) and (B) plotted together to illustrate the differences between mainland (solid line) and island (dashed line) sloths. Lines at the top of the graph show significant differences (P < 0.05, P < 0.01, and P < 0.001). Power for each 0.4 Hz frequency bin is plotted at the start of the bin.

References

    1. Siegel JM. Clues to the functions of mammalian sleep. Nature. 2005;437:1264–71. - PMC - PubMed
    1. Lima SL, Rattenborg NC. A behavioural shutdown can make sleeping safer: a strategic perspective on the function of sleep. Anim Behav. 2007;74:189–97.
    1. Diekelmann S, Born J. The memory function of sleep. Nat Rev Neurosci. 2010;11:114–26. - PubMed
    1. Rattenborg NC, Lesku JA, Martinez-Gonzalez D, Lima SL. The nontrivial functions of sleep. Sleep Med Rev. 2007;11:405–9. - PubMed
    1. Mignot E. Why we sleep: the temporal organization of recovery. PLoS Biol. 2008;6:e106. - PMC - PubMed

Publication types

MeSH terms

Substances