

The Purine Bias of Coding Sequences is Determined by Physicochemical Constraints on Proteins
- PMID: 24899802
- PMCID: PMC4039185
- DOI: 10.4137/BBI.S13161
The Purine Bias of Coding Sequences is Determined by Physicochemical Constraints on Proteins
Abstract
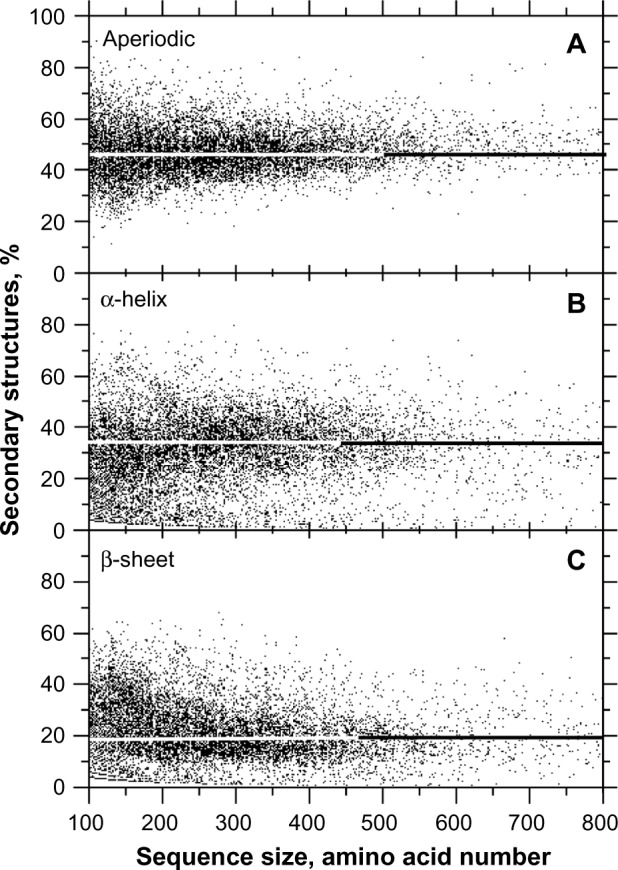
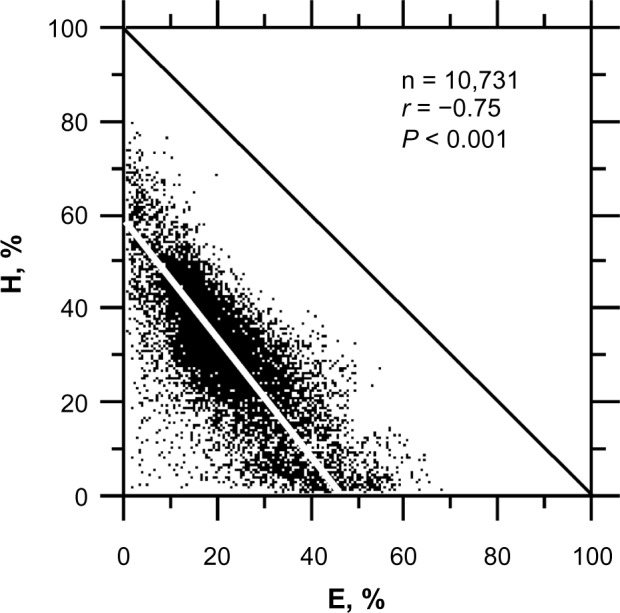
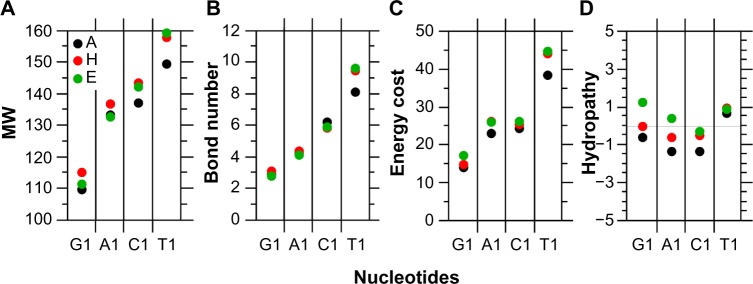
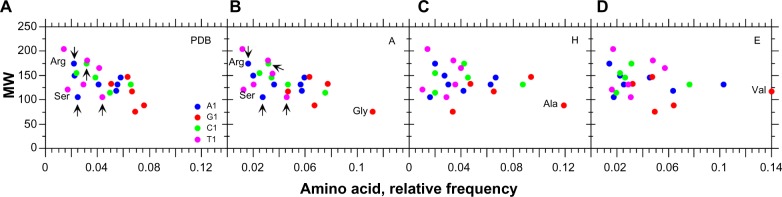
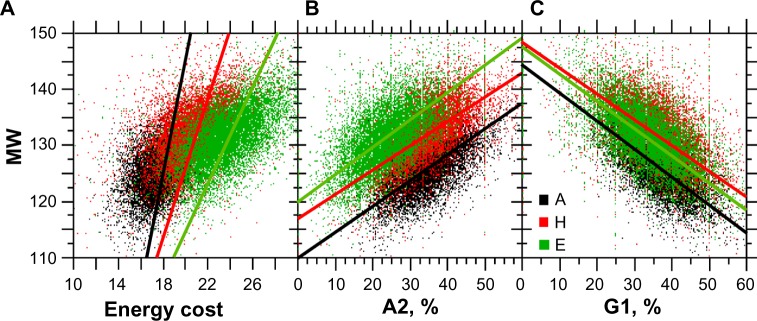
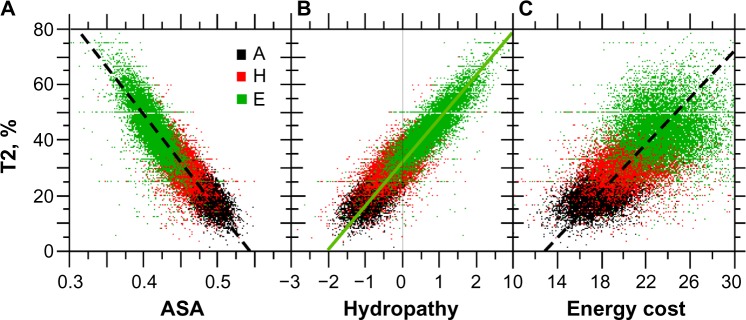
For this report, we analyzed protein secondary structures in relation to the statistics of three nucleotide codon positions. The purpose of this investigation was to find which properties of the ribosome, tRNA or protein level, could explain the purine bias (Rrr) as it is observed in coding DNA. We found that the Rrr pattern is the consequence of a regularity (the codon structure) resulting from physicochemical constraints on proteins and thermodynamic constraints on ribosomal machinery. The physicochemical constraints on proteins mainly come from the hydropathy and molecular weight (MW) of secondary structures as well as the energy cost of amino acid synthesis. These constraints appear through a network of statistical correlations, such as (i) the cost of amino acid synthesis, which is in favor of a higher level of guanine in the first codon position, (ii) the constructive contribution of hydropathy alternation in proteins, (iii) the spatial organization of secondary structure in proteins according to solvent accessibility, (iv) the spatial organization of secondary structure according to amino acid hydropathy, (v) the statistical correlation of MW with protein secondary structures and their overall hydropathy, (vi) the statistical correlation of thymine in the second codon position with hydropathy and the energy cost of amino acid synthesis, and (vii) the statistical correlation of adenine in the second codon position with amino acid complexity and the MW of secondary protein structures. Amino acid physicochemical properties and functional constraints on proteins constitute a code that is translated into a purine bias within the coding DNA via tRNAs. In that sense, the Rrr pattern within coding DNA is the effect of information transfer on nucleotide composition from protein to DNA by selection according to the codon positions. Thus, coding DNA structure and ribosomal machinery co-evolved to minimize the energy cost of protein coding given the functional constraints on proteins.
Keywords: RNY; ancestral codon; energy cost; genomics; helix; purine bias; ribosome; secondary structure; sheet; translation; turn coil.
Figures


Similar articles
-
An Interpretation of the Ancestral Codon from Miller's Amino Acids and Nucleotide Correlations in Modern Coding Sequences.Bioinform Biol Insights. 2015 Apr 15;9:37-47. doi: 10.4137/BBI.S24021. eCollection 2015. Bioinform Biol Insights. 2015. PMID: 25922573 Free PMC article.
-
Classifying coding DNA with nucleotide statistics.Bioinform Biol Insights. 2009 Oct 28;3:141-54. doi: 10.4137/bbi.s3030. Bioinform Biol Insights. 2009. PMID: 20140062 Free PMC article.
-
The Uroboros Theory of Life's Origin: 22-Nucleotide Theoretical Minimal RNA Rings Reflect Evolution of Genetic Code and tRNA-rRNA Translation Machineries.Acta Biotheor. 2019 Dec;67(4):273-297. doi: 10.1007/s10441-019-09356-w. Epub 2019 Aug 6. Acta Biotheor. 2019. PMID: 31388859
-
On universal coding events in protein biogenesis.Biosystems. 2018 Feb;164:16-25. doi: 10.1016/j.biosystems.2017.10.004. Epub 2017 Oct 10. Biosystems. 2018. PMID: 29030023 Review.
-
Multiple stages in codon-anticodon recognition: double-trigger mechanisms and geometric constraints.Biochimie. 2006 Aug;88(8):963-92. doi: 10.1016/j.biochi.2006.06.002. Epub 2006 Jun 27. Biochimie. 2006. PMID: 16843583 Review.
Cited by
-
Moonlighting genes harbor antisense ORFs that encode potential membrane proteins.Sci Rep. 2023 Aug 3;13(1):12591. doi: 10.1038/s41598-023-39869-x. Sci Rep. 2023. PMID: 37537268 Free PMC article.
-
A Metagenomic Analysis of Bacterial Microbiota in the Digestive Tract of Triatomines.Bioinform Biol Insights. 2017 Sep 27;11:1177932217733422. doi: 10.1177/1177932217733422. eCollection 2017. Bioinform Biol Insights. 2017. PMID: 28989277 Free PMC article.
-
Plant Tolerance to Drought Stress with Emphasis on Wheat.Plants (Basel). 2023 May 30;12(11):2170. doi: 10.3390/plants12112170. Plants (Basel). 2023. PMID: 37299149 Free PMC article. Review.
-
An Interpretation of the Ancestral Codon from Miller's Amino Acids and Nucleotide Correlations in Modern Coding Sequences.Bioinform Biol Insights. 2015 Apr 15;9:37-47. doi: 10.4137/BBI.S24021. eCollection 2015. Bioinform Biol Insights. 2015. PMID: 25922573 Free PMC article.
-
Physicochemical Foundations of Life that Direct Evolution: Chance and Natural Selection are not Evolutionary Driving Forces.Life (Basel). 2020 Jan 21;10(2):7. doi: 10.3390/life10020007. Life (Basel). 2020. PMID: 31973071 Free PMC article.
References
-
- Mortimer JR, Forsdyke DR. Comparison of responses by bacteriophage and bacteria to pressures on the base composition of open reading frames. Appl Bioinformatics. 2003;2:47–62. - PubMed
-
- Carels N, Frias D. The contribution of stop codon frequency and purine bias to the classification of coding sequences. In: Mondaini R, editor. Biomat 2012: International Symposium on Mathematical and Computational Biology. World Scientific; Singapore: 2013. pp. 301–22.
LinkOut - more resources
Full Text Sources
Other Literature Sources
