

doi: 10.1021/ml200163b.
eCollection 2011 Oct 13.
Optimization of Pharmacokinetics through Manipulation of Physicochemical Properties in a Series of HCV Inhibitors
Affiliations
- PMID: 24900257
- PMCID: PMC4018142
- DOI: 10.1021/ml200163b
Item in Clipboard
Optimization of Pharmacokinetics through Manipulation of Physicochemical Properties in a Series of HCV Inhibitors
ACS Med Chem Lett.
.
Abstract
A novel series of HCV replication inhibitors based on a pyrido[3,2-d]pyrimidine core were optimized for pharmacokinetics (PK) in rats. Several associations between physicochemical properties and PK were identified and exploited to guide the design of compounds. In addition, a simple new metric that may aid in the prediction of bioavailability for compounds with higher polar surface area is described (3*HBD-cLogP).
Keywords: 3*HBD-cLogP; HCV inhibitors; Pharmacokinetics; pyrido[3,2-d]pyrimidine core.
Figures
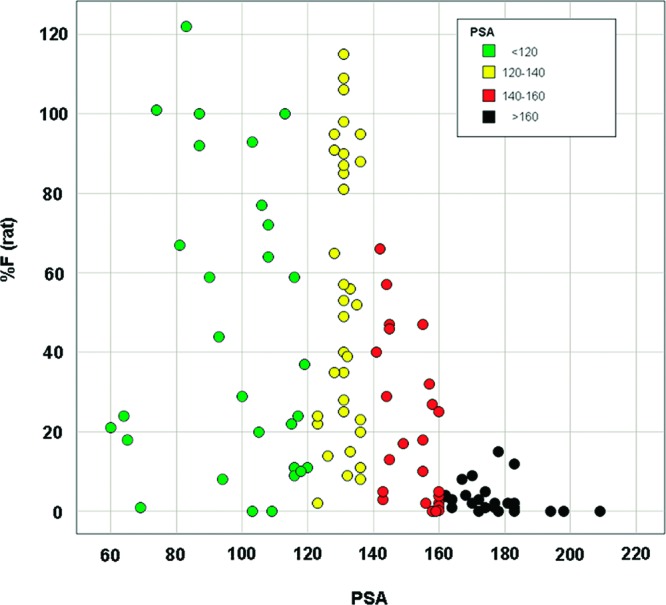
Relationship between rat bioavailability and PSA.
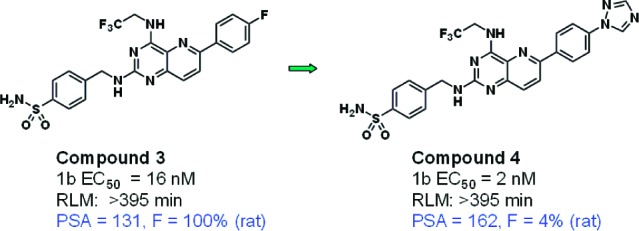
Example of increased PSA leading to reduced bioavailability.
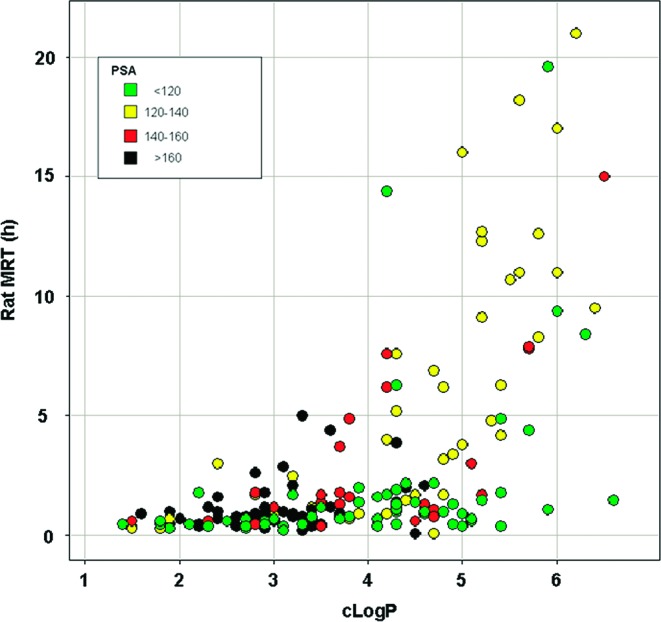
Relationship between MRT in the rat and cLogP.
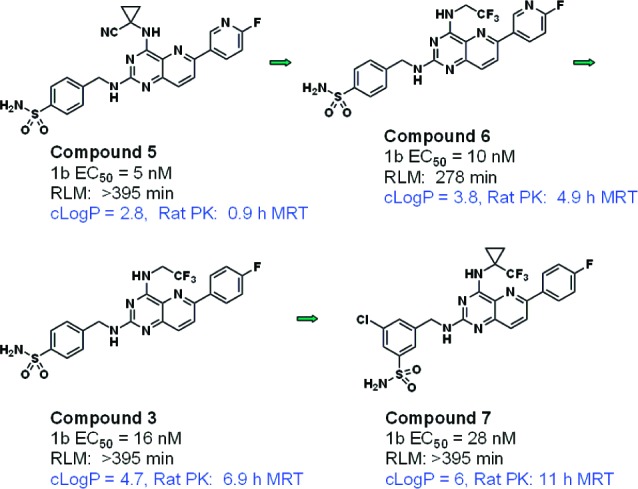
Examples of the association between MRT in the rat and cLogP.
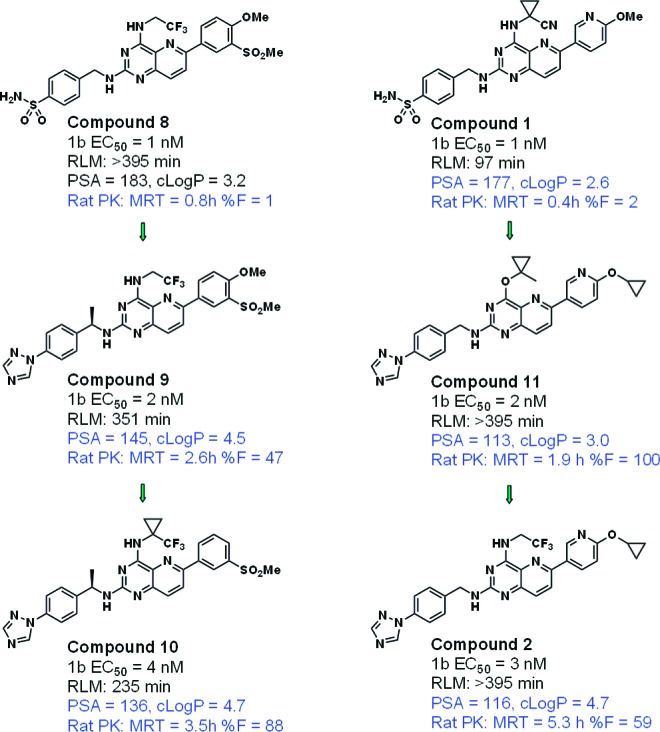
Two subseries in which PK was optimized through manipulation of PSA and cLogP.
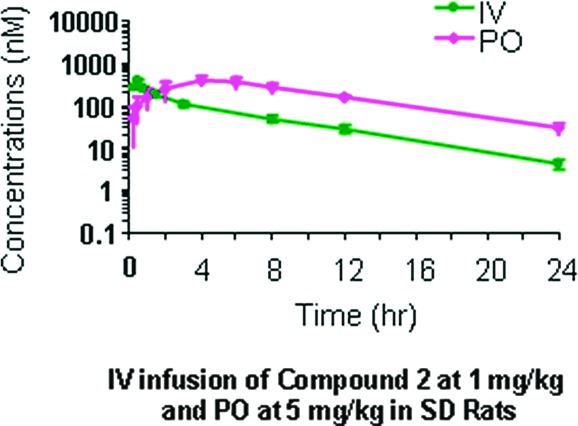
IV and oral rat PK for compound 2.
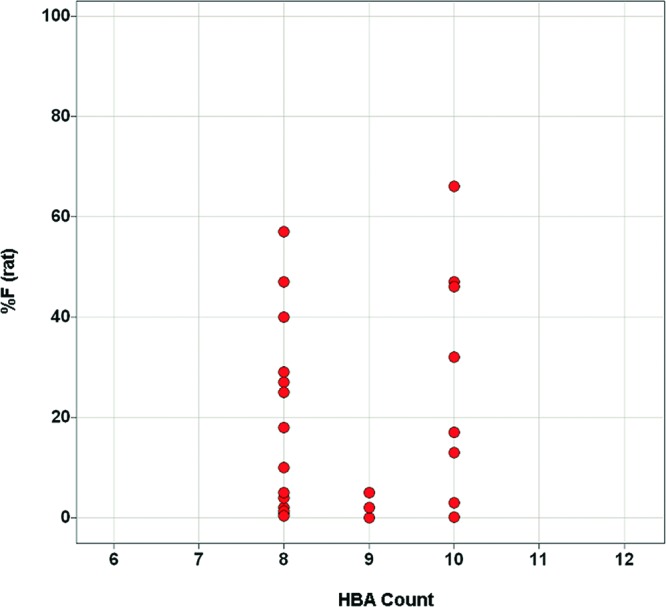
Relationship between % F (rat) and HBA count for analogues with PSA 140–160.
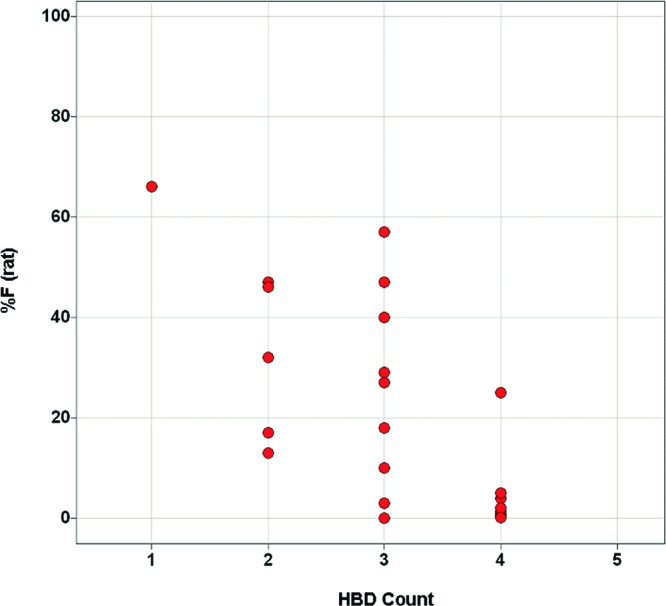
Relationship between % F (rat) and HBD count for analogues with PSA 140–160.
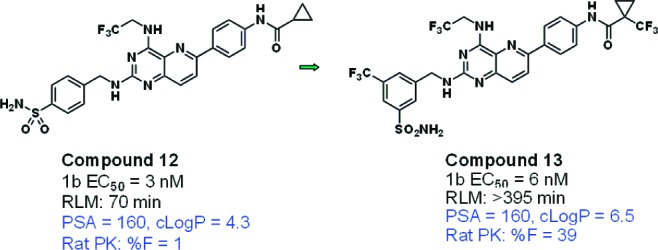
Example of a pair of high PSA analogues in which % F was improved by an increase in lipophilicity.
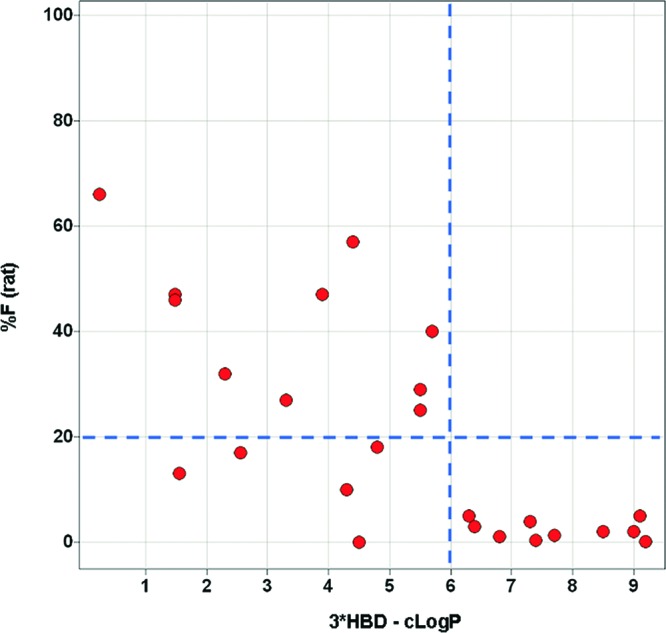
Relationship between % F (rat) and 3*HBD-cLogP for analogues with PSA 140–160.
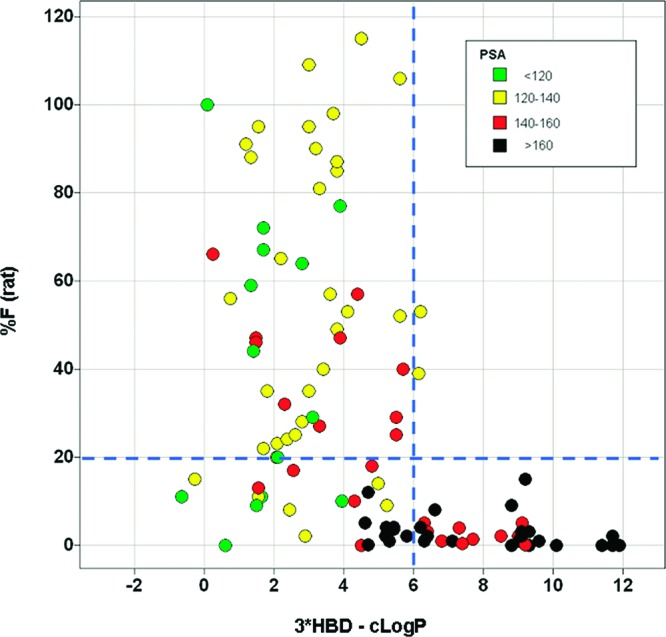
Relationship between % F (rat) and 3*HBD-cLogP for all of the pyridopyrimidines.
References
-
- Lipinski C. A.; Lombardo F.; Dominy B. W.; Feeney P. J. Experimental and computational approaches to estimate solubility and permeability in drug discovery and development settings. Adv. Drug Delivery Rev. 1997, 23, 4–25. - PubMed
-
- Veber D. F.; Johnson S. R.; Cheng H.-Y.; Smith B. R.; Ward K. W.; Kopple K. D. Molecular Properties That Influence the Oral Bioavailability of Drug Candidates. J. Med. Chem. 2002, 45, 2615–2623. - PubMed
-
- Leeson P. D.; Davis A. M. Time-Related Differences in the Physical Property Profiles of Oral Drugs. J. Med. Chem. 2004, 47, 6338–6348. - PubMed
-
- Johnson T. W.; Dress K. R.; Edwards M. Using the Golden Triangle to Optimize Clearance and Oral Absorption. Bioorg. Med. Chem. Lett. 2009, 19, 5560–5564. - PubMed
-
- Hou T.; Wang J.; Zhang W.; Xu X. ADME Evaluation in Drug Discovery. 7. Prediction of Oral Absorption by Correlation and Classification. J. Chem. Inf. Model. 2007, 47, 208–218. - PubMed
LinkOut - more resources
Full Text Sources
