

Extracting SAR Information from a Large Collection of Anti-Malarial Screening Hits by NSG-SPT Analysis
- PMID: 24900303
- PMCID: PMC4018131
- DOI: 10.1021/ml100240z
Extracting SAR Information from a Large Collection of Anti-Malarial Screening Hits by NSG-SPT Analysis
Abstract
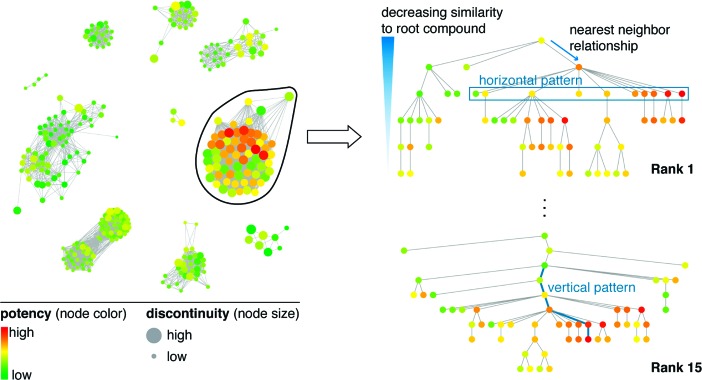
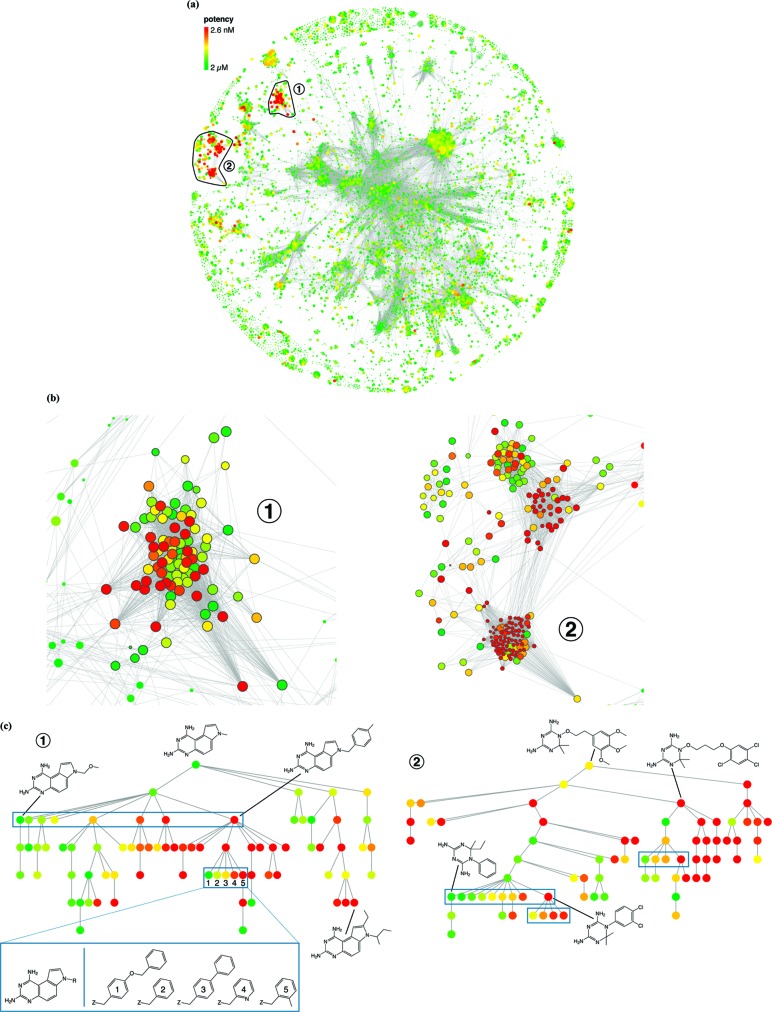
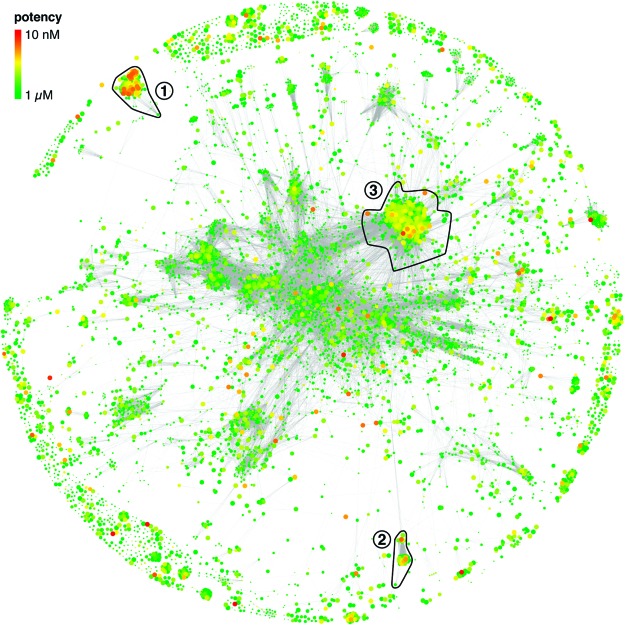
We combine two graphical SAR analysis methods, Network-like Similarity Graphs (NSGs) and Similarity-Potency Trees (SPTs), to search for SAR information in a large and heterogeneous compound data set containing more than 13,000 antimalarial screening hits that was recently released by GlaxoSmithKline (GSK). The NSG-SPT approach first identifies subsets of compounds inducing local SAR discontinuity in data sets and then extracts available SAR information from these subsets in a graphically intuitive manner. Applying the NSG-SPT analysis scheme, we have identified in the GSK collection compound subsets of high local SAR information content including both known and previously unknown antimalarial chemotypes, which yielded interpretable SAR patterns. This information should be helpful to prioritize and select antimalarial candidate compounds for further chemical exploration. Furthermore, the NSG-SPT tools are publicly available, and our study also shows how to practically apply these SAR analysis methods to study large compound data sets.
Keywords: Anti-malaria screening hits; data mining; graphical SAR analysis; network-like similarity graphs; similarity-potency trees; structure−activity relationship (SAR) information.
Figures
References
-
- Bajorath J.; Peltason L.; Wawer M.; Guha R.; Lajiness M. S.; Van Die J. H. Navigating Structure-Activity Landscapes. Drug Discovery Today 2009, 14, 698–705. - PubMed
-
- Wawer M.; Lounkine E.; Wassermann A. M.; Bajorath J. Data Structures and Computational Tools for the Extraction of SAR Information from Large Compound Sets. Drug Discovery Today 2010, 15, 630–639. - PubMed
-
- Wassermann A. M.; Wawer M.; Bajorath J.. Activity Landscape Representations for Structure-Activity Relationship Analysis. J. Med. Chem. 2010, 53, 8209−8223. - PubMed
-
- Malo N.; Hanley J. A.; Cerquozzi S.; Pelletier J.; Nadon R. Statistical Practice in High-Throughput Data Analysis. Nat. Biotechnol. 2006, 24, 167–175. - PubMed
-
- Ahlberg C. Visual Exploration of HTS Databases: Bridging the Gap between Chemistry and Biology. Drug Discovery Today 1999, 4, 270–485. - PubMed
LinkOut - more resources
Full Text Sources
Molecular Biology Databases
Miscellaneous
