

Time-intensity curve parameters in rectal cancer measured using endorectal ultrasonography with sterile coupling gels filling the rectum: correlations with tumor angiogenesis and clinicopathological features
- PMID: 24900973
- PMCID: PMC4036556
- DOI: 10.1155/2014/587806
Time-intensity curve parameters in rectal cancer measured using endorectal ultrasonography with sterile coupling gels filling the rectum: correlations with tumor angiogenesis and clinicopathological features
Abstract
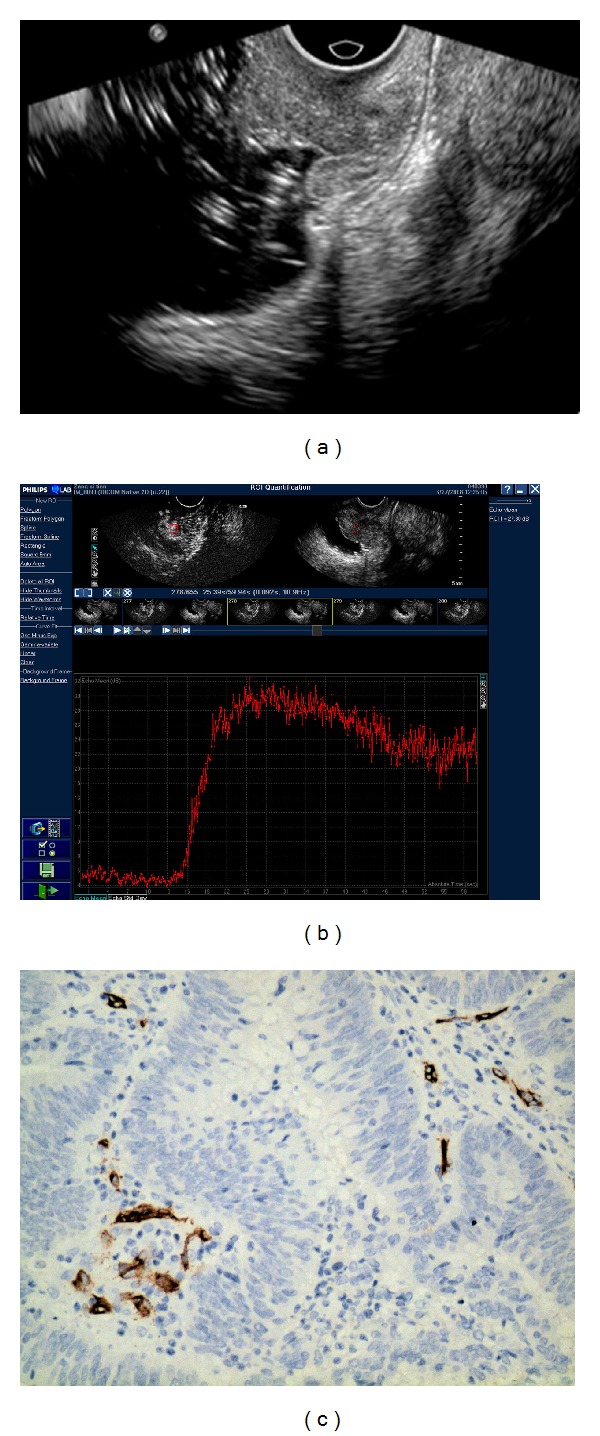
The primary aim of this study was to investigate the relationship between contrast-enhanced ultrasonography (CEUS) imaging parameters and clinicopathological features of rectal carcinoma and assess their potential as new radiological prognostic predictors. A total of 66 rectal carcinoma patients were analyzed with the time-intensity curve of CEUS. The parameter arrival time (AT), time to peak enhancement (TTP), wash-in time (WIT), enhanced intensity (EI), and ascending slope (AS) were measured. Microvessel density (MVD) was evaluated by immunohistochemical staining of surgical specimens. All findings were analysed prospectively and correlated with tumor staging, histological grading, and MVD. The mean values of AT, TTP, WIT, EI, and AS value of the rectal carcinoma were 10.84 ± 3.28 s, 20.61 ± 5.52 s, 9.78 ± 2.83 s, 28.68 ± 4.67 dB, and 3.20 ± 1.10, respectively. A positive linear correlation was found between the EI and MVD in rectal carcinoma (r = 0.295, P = 0.016), and there was a significant difference for EI among histological grading (r = -0.264, P = 0.007). EI decreased as T stage increased with a trend of association noted (P = 0.096). EI of contrast enhanced endorectal ultrasonography provides noninvasive biomarker of tumor angiogenesis in rectal cancer. CEUS data have the potential to predict patient prognosis.
Figures


Similar articles
-
Recurrences in stage II rectal carcinoma after curative resection alone: from the viewpoint of angiogenesis.World J Surg Oncol. 2016 Apr 22;14:122. doi: 10.1186/s12957-016-0877-6. World J Surg Oncol. 2016. PMID: 27102733 Free PMC article.
-
Rectal cancer: 3D dynamic contrast-enhanced MRI; correlation with microvascular density and clinicopathological features.Radiol Med. 2011 Apr;116(3):366-74. doi: 10.1007/s11547-011-0628-2. Epub 2011 Feb 1. Radiol Med. 2011. PMID: 21298356
-
The relationship between enhanced intensity and microvessel density of gastric carcinoma using double contrast-enhanced ultrasonography.Ultrasound Med Biol. 2009 Jul;35(7):1086-91. doi: 10.1016/j.ultrasmedbio.2009.03.010. Epub 2009 May 5. Ultrasound Med Biol. 2009. PMID: 19419811
-
Rectal endosonography, a new technique for the preoperative staging of rectal carcinoma.Eur J Surg Oncol. 1988 Aug;14(4):297-309. Eur J Surg Oncol. 1988. PMID: 3044832 Review.
-
Endorectal sonography.Crit Rev Diagn Imaging. 1992;33(1-2):1-28. Crit Rev Diagn Imaging. 1992. PMID: 1727038 Review.
Cited by
-
Predictive Value of TRUS and CEUS Parameters for Lymph Node Metastasis in Rectal Cancer: A Retrospective Study.Int J Gen Med. 2025 Jun 24;18:3335-3345. doi: 10.2147/IJGM.S519039. eCollection 2025. Int J Gen Med. 2025. PMID: 40585581 Free PMC article.
-
Intraoperative Contrast Enhanced Ultrasound Evaluates the Grade of Glioma.Biomed Res Int. 2016;2016:2643862. doi: 10.1155/2016/2643862. Epub 2016 Mar 16. Biomed Res Int. 2016. PMID: 27069921 Free PMC article.
-
EFSUMB Recommendations for Gastrointestinal Ultrasound Part 3: Endorectal, Endoanal and Perineal Ultrasound.Ultrasound Int Open. 2019 Jan;5(1):E34-E51. doi: 10.1055/a-0825-6708. Epub 2019 Feb 5. Ultrasound Int Open. 2019. PMID: 30729231 Free PMC article. Review.
-
Assessing tumor angiogenesis in colorectal cancer by quantitative contrast-enhanced endoscopic ultrasound and molecular and immunohistochemical analysis.Endosc Ultrasound. 2018 May-Jun;7(3):175-183. doi: 10.4103/eus.eus_7_17. Endosc Ultrasound. 2018. PMID: 28685747 Free PMC article.
-
Double contrast-enhanced ultrasonography improves diagnostic accuracy of T staging compared with multi-detector computed tomography in gastric cancer patients.World J Gastroenterol. 2024 Jun 21;30(23):3005-3015. doi: 10.3748/wjg.v30.i23.3005. World J Gastroenterol. 2024. PMID: 38946876 Free PMC article.
References
-
- Bendardaf R, Buhmeida A, Hilska M, et al. VEGF-1 expression in colorectal cancer is associated with disease localization, stage, and long-term disease-specific survival. Anticancer Research B. 2008;28(6):3865–3870. - PubMed
-
- Dighe S, Blake H, Jeyadevan N, et al. Perfusion CT vascular parameters do not correlate with immunohistochemically derived microvessel density count in colorectal tumors. Radiology. 2013;268(2) - PubMed
Publication types
MeSH terms
Substances
LinkOut - more resources
Full Text Sources
Other Literature Sources
Research Materials
Miscellaneous
