Comparative Study
. 2015 Mar;85(2):196-205.
doi: 10.2319/091913-690.1. Epub 2014 Jun 5.

Stress distribution in the temporomandibular joint after mandibular protraction: a three-dimensional finite element study

Affiliations
Comparative Study

Stress distribution in the temporomandibular joint after mandibular protraction: a three-dimensional finite element study

Abhinav Shrivastava et al. Angle Orthod. 2015 Mar.

Abstract

Objective: To evaluate the stress patterns in temporomandibular joint (TMJ) during mandibular protraction at different horizontal advancements with constant vertical height in a construction bite using a three-dimensional finite element method.

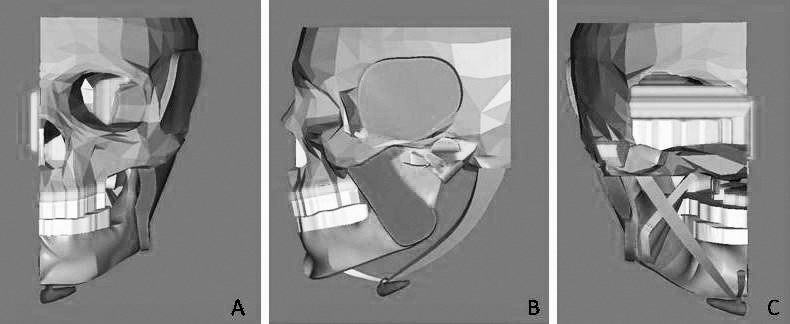
Materials and methods: A three-dimensional computer-aided model was developed from the magnetic resonance imaging (MRI) of a growing boy (age 12 years) using MIMICS software (version 7.0, Materialise, Leuven, Belgium). Stresses with constant vertical opening of 5 mm changing the sagittal advancements from 0 mm to 5 mm and 7.5 mm were recorded. Differences in magnitude and pattern of stresses were compared.

Results: The tensile stresses in the posterosuperior aspect of the condylar head and on the posterior aspect of the glenoid fossa migrated posteriorly with increased bite advancements. The location of tensile stresses changed in the condylar head and fossa on mandibular protraction of 5 mm to 7 mm.

Conclusion: This study indicates that larger horizontal advancements of construction bites may not be favorable for tissues of TMJ. Clinical application necessitates study on an animal model.

Keywords: 3D FEM study; Articular disc; Condyle; Fossa; Horizontal advancements; Mandibular protraction; Stresses; Temporomandibular joint.


Figures

Figure 1. Total displacements of the condylar head (A) and disc (B). Locating the condylar head and the articular disc on the MRI by using arbitrary reference lines (T1 and T2). T1 is the tangent to the superior-most point on the glenoid fossa. T2 is tangent to the postglenoid spine and perpendicular to T1.
Figure 1.
Total displacements of the condylar head (A) and disc (B). Locating the condylar head and the articular disc on the MRI by using arbitrary reference lines (T1 and T2). T1 is the tangent to the superior-most point on the glenoid fossa. T2 is tangent to the postglenoid spine and perpendicular to T1.
Figure 2. Total displacements of the condylar head (A) and the disc (B) from maximum intercuspation through physiologic rest position, HA1 and HA2, up to HA3.
Figure 2.
Total displacements of the condylar head (A) and the disc (B) from maximum intercuspation through physiologic rest position, HA1 and HA2, up to HA3.
Figure 3. Three-dimensional CAD model construction of temporomandibular joint and skull with muscle simulation.
Figure 3.
Three-dimensional CAD model construction of temporomandibular joint and skull with muscle simulation.
Figure 4. Marked points categorized into six regions on the condylar head: (A,B) anteroposterior; (C) mediolateral.
Figure 4.
Marked points categorized into six regions on the condylar head: (A,B) anteroposterior; (C) mediolateral.
Figure 5. Marked points categorized into six regions on the glenoid fossa: (A) anteroposterior; (B) mediolateral.
Figure 5.
Marked points categorized into six regions on the glenoid fossa: (A) anteroposterior; (B) mediolateral.
Figure 6. Marked points categorized into six regions on the articular disc for measurement of stresses: (A) anteroposterior; (B) mediolateral.
Figure 6.
Marked points categorized into six regions on the articular disc for measurement of stresses: (A) anteroposterior; (B) mediolateral.
Figure 7. Stress contour plots showing maximum and minimum principal stresses (MPa) on the condylar head at HA1, HA2, and HA3.
Figure 7.
Stress contour plots showing maximum and minimum principal stresses (MPa) on the condylar head at HA1, HA2, and HA3.
Figure 8. Mean principal stresses (MPa) on the condylar head in the anteroposterior direction at: (A) HA1, (B) HA2, and (C) HA3.
Figure 8.
Mean principal stresses (MPa) on the condylar head in the anteroposterior direction at: (A) HA1, (B) HA2, and (C) HA3.
Figure 9. Stress contour plots showing maximum and minimum principal stresses (MPa) on the glenoid fossa at (A) HA1, (B) HA2, and (C) HA3.
Figure 9.
Stress contour plots showing maximum and minimum principal stresses (MPa) on the glenoid fossa at (A) HA1, (B) HA2, and (C) HA3.
Figure 10. Mean principal stresses (MPa) on the glenoid fossa in the anteroposterior direction at (A) HA1, (B) HA2, and (C) HA3.
Figure 10.
Mean principal stresses (MPa) on the glenoid fossa in the anteroposterior direction at (A) HA1, (B) HA2, and (C) HA3.
Figure 11. Stress contour plots showing von Mises equivalent stresses (MPa) on the articular disc at HA1, HA2, and HA3.
Figure 11.
Stress contour plots showing von Mises equivalent stresses (MPa) on the articular disc at HA1, HA2, and HA3.
Figure 12. Von Mises equivalent stresses (MPa) on the articular disc at HA1, HA2, and HA3.
Figure 12.
Von Mises equivalent stresses (MPa) on the articular disc at HA1, HA2, and HA3.

References

    1. Tanaka E, Tanne K, Sakuda M. A three-dimensional finite element model of mandible including the TMJ and its application to stress analysis in TMJ during clenching. Med Eng Phys. 1994;16:316–322. - PubMed
    1. Zhou X, Zhao Z, Zhao M. Analysis of the condyle in the state on the mandibular protraction by means of the three-dimensional finite element method [in Chinese] Zhonghua Kou Qiang Yi Xue Za Zhi. 1999;34:85–87. - PubMed
    1. Beek M, Koolstra JH, van Ruijven LJ, van Eijden TM. Three-dimensional finite element analysis of the human temporomandibular joint disc. J Biomech. 2000;33:307–316. - PubMed
    1. Tanaka E, Rodrigo DP, Tanaka M, Kawaguchi A, Shibazaki T, Tanne K. Stress analysis in TMJ during jaw opening by use of three-dimensional finite element model based on magnetic resonance images. Int J Oral Maxillofac Surg. 2001;30:421–430. - PubMed
    1. del Pozo R, Tanaka E, Tanaka M, et al. Influence of friction at articular surfaces of temporomandibular joint on stresses in articular disk: a theoretical approach with the finite element method. Angle Orthod. 2003;73:319–327. - PubMed

Publication types

MeSH terms

LinkOut - more resources